

Sediment-hosted copper · Deposit model guide
Sediment-Hosted Copper Deposits: Geology and Examples
Sediment-hosted copper deposits supply about 20% of the world’s copper and rank first for cobalt (USGS). Learn the three subtypes, the main belts, typical grades and the exploration signs that work.
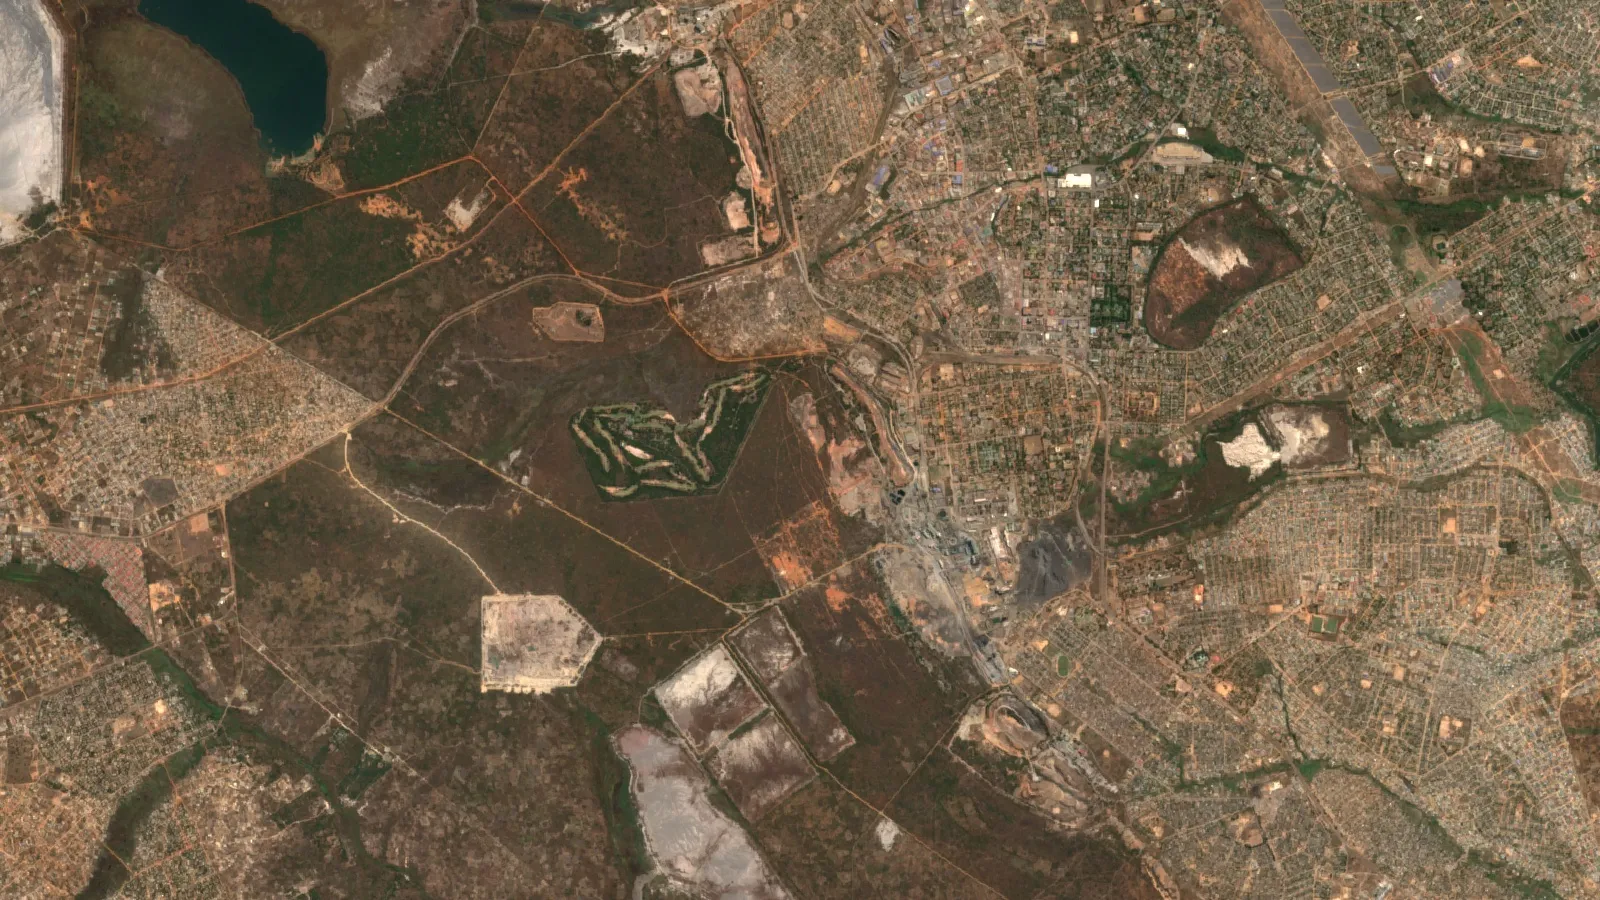
Key takeaways
- Sediment-hosted stratabound copper gives about 20% of world copper, ranks first among deposit types for cobalt and fourth for silver (USGS, 2015).
- Outside the Central African Copperbelt, average grades are 1.38% Cu (reduced-facies), 1.08% (sandstone) and 2.09% (redbed); Copperbelt averages are 2.59% and 2.20% (USGS, 2015).
- The Kupferschiefer district in Poland is compiled at 3,612 Mt at 1.99% Cu; KGHM Polska Miedz made 401.1 kt of copper in concentrate in 2025 (USGS; KGHM).
- Ore forms where oxidised brine meets a reductant; mapping red-bed bleaching, basin margins and sulfide zoning guides exploration (USGS, 2015).
- The DRC mined about 230,000 t of cobalt in 2025, much of it from this deposit class (USGS, 2026).
In this article
- What sediment-hosted copper deposits are
- Why these deposits matter for copper, cobalt and silver
- Stratiform, stratabound and redbed: what the words mean
- The three subtypes: reduced-facies, sandstone and redbed copper
- Grades and tonnages by subtype
- How these deposits form in five steps
- Zoning: the sulfide pattern explorers map
- Sediment-hosted copper versus porphyry copper
- Kupferschiefer deposits of Poland and Germany
- Central African Copperbelt geology
- Cobalt, silver and gold as by-products
- Kalahari copper belt in Botswana and Namibia
- Redbed copper and other sandstone-hosted examples
- Other basins: Udokan, Chu-Sarysu and Angola
What sediment-hosted copper deposits are
Sediment-hosted copper deposits are bodies of copper sulfide that sit inside sedimentary rock, in thin layers that follow the bedding. They formed when warm, oxidised salty water carried copper out of red sandstones and dropped it where it met a chemical reductant. The U.S. Geological Survey (USGS) calls the class “sediment-hosted stratabound copper”. It says the class supplies about 20 percent of the world’s copper, ranks first among all deposit types for cobalt and fourth for silver (USGS Scientific Investigations Report 2010-5070-M). Only porphyry copper deposits give more copper.
This page explains the geology in plain words: the three subtypes, how the ore forms, the mineral zoning that geologists map, the main belts (the Central African Copperbelt, the Kupferschiefer of Poland and Germany, the Kalahari copper belt of Botswana and Namibia), typical grades and tonnages, and the exploration signs that work. Tonnages and grades quoted below are published compilations or company reports with their dates. They are not resources or reserves under JORC, NI 43-101 or SAMREC, and nothing here is an estimate for any ground you may hold.
Terms used on this page
- Grade is the share of copper in the rock, in percent (%) by weight. 1% Cu means 10 kg of copper in each tonne of rock.
- Stratabound means the ore stays inside certain beds. Stratiform means the ore lies parallel to the layering. Papers use both words for the same family of deposits, so a search for sediment-hosted stratiform copper leads to the same geology.
- Redox boundary is the line where oxidised rock (red, iron-rich) meets reduced rock (grey or black, with organic matter or pyrite). Copper drops out there.
- Chalcocite, bornite, chalcopyrite are copper sulfides, listed from richest (chalcocite, about 80% Cu) to poorest. Malachite is the green copper carbonate seen where sulfides weather.
Why these deposits matter for copper, cobalt and silver
The USGS says the class is the economic base of three countries: the Democratic Republic of the Congo, Poland and Zambia (USGS, 2015). Its Mineral Commodity Summaries put 2025 estimated mine output at 3,200 thousand tonnes of copper in Congo (Kinshasa), 940 in Zambia and 410 in Poland, against 5,300 in Chile (USGS, Mineral Commodity Summaries 2026, copper). These are national totals, so they include some copper from other deposit types.
Chart
Mine copper output, 2025 estimate
Thousand tonnes of contained copper, national totals
The class also matters for battery metals. Of the identified world cobalt resources of about 25 million tonnes, the USGS says the great majority are in sediment-hosted stratiform copper deposits in Congo (Kinshasa) and Zambia, along with nickel laterites and magmatic nickel-copper deposits (USGS, Mineral Commodity Summaries 2026, cobalt).
Stratiform, stratabound and redbed: what the words mean
Three labels cause most of the confusion. “Sediment-hosted” says the host rock is sedimentary. “Stratabound” or “stratiform” says the ore is confined to certain beds instead of cutting across them. “Redbed copper” (also written red-bed) is one of the three subtypes, hosted by grey sandstone inside thick red sandstones, and it is the smallest of the three. The USGS model keeps all three under one system because they share the same ingredients: thick red beds as the copper source, hot oxidised brine as the carrier, and a reductant as the trap.
The three subtypes: reduced-facies, sandstone and redbed copper
The USGS splits the deposits by host rock and by the reductant that precipitated the metal (Hayes and others, USGS, 2015):
- Reduced-facies type. Black, grey or green shale, siltstone, mudstone or carbonaceous dolomitic siltstone that holds organic matter and pyrite. Deposits are sheets. The Kupferschiefer and the Katanga (Roan) ores of the Copperbelt belong here.
- Sandstone type. Grey, well-sorted sandstone that held petroleum or sour gas. Deposits are tabular or lens-like. Spar Lake in Montana and Udokan in Russia are examples.
- Redbed type. Grey, poorly sorted, often conglomeratic river sandstone with carbonised plant fragments, up to whole logs. Deposits are lenses, typically small. Corocoro in Bolivia is an example.
All three sit above or inside thick red-bed sequences, more than 300 m thick and often more than 1 km. The red colour comes from hematite, an oxidised iron mineral, and shows that the water in these rocks was once oxygen-rich enough to carry copper. The USGS adds that the host sequences formed within 20 to 30 degrees of the palaeo-equator, in hot, dry climates that also made evaporites such as salt and anhydrite.
Grades and tonnages by subtype
Outside the Central African Copperbelt, the USGS reports average grades of 1.38% Cu for reduced-facies deposits, 1.08% for sandstone deposits and 2.09% for redbed deposits. Inside the Copperbelt the averages are higher: 2.59% for reduced-facies and 2.20% for sandstone ores (USGS, 2015). Size varies even more than grade. Reduced-facies and sandstone deposits can hold tens of millions to more than a billion tonnes of ore, while redbed deposits rarely reach 10 million tonnes. The median reduced-facies deposit outside the Copperbelt holds 27 million tonnes, the median sandstone deposit 7.2 million tonnes and the median redbed deposit 1.2 million tonnes.
Chart
Median deposit size by subtype
Million tonnes of ore (reduced-facies and sandstone: outside the Copperbelt)
Chart
Average copper grade by subtype
Average % Cu of deposits with grade data
Silver and cobalt add value. About 25% of the deposits in the USGS database carry silver at 2 to 200 g/t, and about 14% carry cobalt at 0.05 to 0.5% in primary ore. A deposit that has by-product silver does not usually also have by-product cobalt. The Kupferschiefer is the exception (USGS, 2015).
How these deposits form in five steps
The five steps in the diagram follow the USGS description. It is a working model: the timing of copper arrival is still debated for several districts, and the USGS lists open questions for each.
Infographic
How the ore forms in five steps
- 1SourceThick red beds, over 300 m, hold copper that oxidised brines can dissolve.
- 2TransportWarm brines, 75 to 220 degrees Celsius per the USGS, move along faults and permeable beds.
- 3TrapThe brine meets a reductant: organic matter, pyrite, petroleum or sour gas.
- 4PrecipitationCopper and sulfur drop out as sulfides, zoned from pyrite to chalcocite to hematite.
- 5PreservationBurial, folding and faulting keep the thin sheet; weathering makes malachite at surface.
The brine temperature range matters for exploration. The USGS gives 75 to 220 degrees Celsius for the metal-carrying brines, which is warm enough to dissolve copper from red-bed minerals but far cooler than the fluids of porphyry systems. That is why the ore forms in thin, widespread sheets instead of in a stock or a vein swarm. Faults at a high angle to the beds are common at these deposits and may have been the channels that moved brine upward before it spread sideways, either through permeable sandstone or beneath a tight shale. Places where reduced host rocks onlap an old basement high are especially favourable.
Zoning: the sulfide pattern explorers map
The single most useful feature in the field is zoning. The ore minerals change in a fixed order across the bedding and along it: pyrite, then chalcopyrite, then bornite, then chalcocite, then hematite. Chalcocite and bornite zones are normally the ore. Copper-poor, pyritic ground lies on one side and barren red rock on the other (USGS, 2015).
Zoning gives vectors to follow. In sandstone-type deposits, sparse pyrite in beds that are red elsewhere can form a halo that reaches up to 10 km from ore, and galena- and sphalerite-bearing inner halos extend 1 to 2 km from ore. In the Kupferschiefer, lead-zinc zones several tens of kilometres wide separate the copper zone from barren pyritic rock. The Central African Copperbelt does not show lead-zinc halos, but cobalt forms an outer fringe 1 km or more from ore along the bedding. Bleaching of red beds can reach tens of kilometres from ore, but it can also come from unrelated events such as petroleum migration, so bleaching alone is not a vector to ore.
Sediment-hosted copper versus porphyry copper
Porphyry copper deposits form around intrusions, and the USGS ranks them first among copper sources, ahead of the sediment-hosted class. Sediment-hosted deposits form in basins instead, as thin, widespread sheets and lenses that follow the bedding. Our video below gives a short, plain overview of copper mining and why electric vehicles raise demand for the metal.
A practical difference for explorers: a porphyry has a roughly round alteration footprint that is easy to see from the air, while a sediment-hosted system is a stratigraphic target. The question is “which bed, and where does the redox boundary cross it”, not “where is the intrusion”. For a broader comparison of copper and gold systems see our guide to gold and copper deposit types, and for the wider family of ore models read types of ore deposits, with grades and tonnages.
▶ Copper mining explained: where the metal for electric vehicles starts. · 6:03
Kupferschiefer deposits of Poland and Germany
The Kupferschiefer (“copper slate”) is a thin black shale at the base of the Zechstein sequence, deposited about 258 to 260 million years ago. It is the type example of the reduced-facies subtype. Mining at Mansfeld in Germany began in 1199 (USGS, 2015). Today the main mines are in southwest Poland, where the USGS lists the Lubin-Sieroszowice-Polkowice-Rudna district as the largest single deposit of the class, with a compiled 3,612 million tonnes at 1.99% Cu and 57.5 g/t silver (figures from Oszczepalski and Speczik, 2011, reproduced in the USGS model).
The ore is not only in the shale. The USGS notes the Kupferschiefer bed itself is only 30 to 50 cm thick but averages about 8.5% Cu, while about half of all sulfides sit in the sandstone below (the Weissliegendes, about 1.5% Cu) and the carbonate above (the Werra dolomite and limestone, about 1.3% Cu). The mined orebody is 2 to 10 m thick over an area of more than 15 by 28 km. Gold, platinum and palladium occur in the red, oxidised (Rote Faule) zone, and silver is recovered with the copper.
KGHM, the operator, says the recoverable resources of its Lubin-Malomice deposit were about 318 million tonnes of ore at 1.23% Cu and 52 g/t silver on 31 December 2025, with nearly 70% of that ore in sandstone (KGHM, Lubin mine page). Its 2025 results show KGHM Polska Miedz produced 401.1 thousand tonnes of copper in concentrate and 1,321 tonnes of silver in concentrate (KGHM, Q4 2025 results presentation). The USGS estimates Polish mine output at 410 thousand tonnes of copper for 2025 (USGS, 2026).
Central African Copperbelt geology
The Central African Copperbelt runs across the Democratic Republic of the Congo and Zambia. It sits in the Neoproterozoic Katanga Supergroup, a sequence about 10 km thick made of the Roan, Nguba and Kundelungu groups, separated by two glacial deposits (Frontiers in Remote Sensing, 2026). The ore sits mainly in the Roan Group, which is mostly dolomitic and deposited in tidal and lagoon settings. Katanga rocks were folded and thrust during the Lufilian orogeny, and in the Kolwezi area the ore sits in tectonic slices called ecailles (USGS, 2015).
The USGS lists the Kolwezi Klippe mines (Kamoto, KOV, Mutoshi and others) at 1,200 million tonnes at 4.5% Cu and 0.40% Co, hosted by the Kamoto Dolomite of the Lower Roan, which is younger than 877 million years. Central African reduced-facies deposits have strike lengths of 3,000 to 5,300 m, widths of 550 to 2,000 m and ore thicknesses of 2 to 70 m (USGS, 2015). The USGS also notes surface clues: malachite, and black cobalt oxide (“cobalt caps”) made of heterogenite where cobalt-bearing rock has weathered.
Kamoa-Kakula in the DRC is a modern example of the same geology. Ivanhoe Mines reported 388,838 tonnes of copper in concentrate for 2025, within its guidance range (Ivanhoe Mines, 2025 production results). The company says it now explores for “Kamoa-Kakula-style” sedimentary-hosted copper across a Western Forelands licence package about six times the size of the Kamoa-Kakula complex (Ivanhoe Mines, Q4 and full-year 2025 results). For a ranked look at mines in the country, see the top 10 copper mines in the DRC, and for the Zambian side read about Nchanga copper mine.

▶ The Democratic Republic of the Congo’s copper wealth, part of the Central African Copperbelt. · 13:34
Cobalt, silver and gold as by-products
Cobalt is the by-product that changes the economics. The USGS puts Congo (Kinshasa) at 230,000 tonnes of cobalt in 2025, out of a world total of about 310,000 tonnes, and estimates its reserves at 6 million tonnes of cobalt (USGS, 2026). Carrollite, a copper-cobalt sulfide, occurs in some Copperbelt deposits, from the pyrite zone into the chalcocite zone (USGS, 2015).
Chart
Cobalt mine production, 2025 estimate
Tonnes of contained cobalt, selected producers
In Poland the by-products are silver, plus gold, platinum, palladium, lead, nickel, selenium and rhenium, and sulfur for acid. In Botswana the belt’s deposits typically carry 15 to 20 g/t silver at 1.2 to 1.5% Cu (Discovery Metals, 2011, cited by the USGS). Check each mine’s recovery before counting by-products in any estimate, because they are paid only if a plant recovers them.
Kalahari copper belt in Botswana and Namibia
The Kalahari copper belt (also written Kalahari Copperbelt) stretches across Botswana and Namibia (USGS, 2015). In northwest Botswana, the USGS describes structurally controlled, stratabound, zoned copper-silver deposits along a major redox boundary in a late Mesoproterozoic rift succession. Most of the ore is at the base of the marine D’Kar Formation, on the limbs and in the hinges of folds in the Pan-African Ghanzi-Chobe fold-and-thrust belt (Hall and others, USGS, 2018). The authors tie ore to basin highs that formed traps, and to later hot (250 to 300 degrees Celsius), oxidising, metal-bearing brines that moved during basin inversion. They mapped the basin highs with drillhole logs and with magnetic data processed to show changes in rock type, which is a useful reminder that geophysics can see stratigraphy under cover.
Khoemacau Zone 5 is the clearest example. The deposit has a 4.2 km strike length and averages 10 m thick. The mineralised zone sits in the D’Kar Formation, about 30 m above its contact with the footwall Ngwako Pan quartzite, inside a 4,040 km2 licence package (Mining Technology project profile). MMG reports Zone 5 Ore Reserves of 33 million tonnes at 1.7% Cu and 17 g/t silver as at 30 June 2025 (MMG, Mineral Resources and Ore Reserves Statement 2025). MMG, which completed its purchase on 22 March 2024, reported 42,120 tonnes of copper in concentrate for 2025 and guides to 48,000 to 53,000 tonnes for 2026 (MMG, December quarter 2025 production report). In the same country, Sandfire Resources reported 51,788 tonnes of contained copper in concentrate from its Motheo copper operations for the year to June 2026 (Sandfire, June 2026 quarterly report). Our page on Khoemacau copper mine covers owner, output and expansion.
The belt is hard to explore because the Kalahari sand covers the bedrock. The USGS says soil geochemical surveys have worked in Botswana even where tens of metres of sand cover the host rocks.
Redbed copper and other sandstone-hosted examples
Redbed copper deposits are small and often rich. Corocoro in Bolivia is compiled by the USGS at 7.8 million tonnes at 7.1% Cu and 106 g/t silver, a grade the USGS says probably reflects hand-sorted ore. Creta in Oklahoma, a reduced-facies example, is 5.4 million tonnes at 1.9% Cu. In the United States the famous districts are White Pine in Michigan (reduced-facies copper in the Nonesuch Shale, with silver) and Spar Lake in Montana (sandstone-type copper-silver, compiled at 80.6 million tonnes at 0.63% Cu and 46 g/t silver). The ore in these places is often visible: chalcocite in sandstone burrows weathers to bright blue chrysocolla, and green malachite stains the cross-bedding.
Other basins: Udokan, Chu-Sarysu and Angola
Udokan in Russia is the largest sandstone-type example in the USGS list of representative deposits, at 1,528 million tonnes at 1.45% Cu and 12.6 g/t silver. In Kazakhstan, Ivanhoe Mines describes the Chu-Sarysu basin as the world’s third-largest sediment-hosted copper district. The company announced a joint venture over 16,708 km2 there in February 2025, committing US$18.7 million over two years, with Soviet-era exploration archives as a data base. In Angola, the same company reports about 22,000 km2 of licences in the Moxico and Cuando Cubango provinces, with an airborne magnetic and gravity survey in 2024, 600 km2 of baseline soil sampling and 13 geophysical targets from 2025 ground surveys (Ivanhoe Mines, 2026). These are company statements about exploration programmes, not resources.
Sediment-hosted copper deposits compared
The table lists the main named deposits with the figures as published. Several are historical compilations from the USGS model; the Khoemacau line is a company reserve with its date. None is a current resource estimate for the area.
| Deposit or district | Country | Subtype or setting | Published figure | Source |
|---|---|---|---|---|
| Lubin-Sieroszowice-Polkowice-Rudna | Poland | Reduced-facies (Kupferschiefer) | 3,612 Mt at 1.99% Cu, 57.5 g/t Ag | USGS, 2015 |
| Kolwezi Klippe mines | DRC | Reduced-facies (Roan Group) | 1,200 Mt at 4.5% Cu, 0.40% Co | USGS, 2015 |
| Udokan | Russia | Sandstone | 1,528 Mt at 1.45% Cu, 12.6 g/t Ag | USGS, 2015 |
| Khoemacau Zone 5 | Botswana | Kalahari belt, D’Kar Formation | Ore Reserves 33 Mt at 1.7% Cu, 17 g/t Ag (30 June 2025) | MMG, 2025 |
| Spar Lake | USA (Montana) | Sandstone | 80.6 Mt at 0.63% Cu, 46 g/t Ag | USGS, 2015 |
| Corocoro | Bolivia | Redbed | 7.8 Mt at 7.1% Cu, 106 g/t Ag | USGS, 2015 |
| Creta | USA (Oklahoma) | Reduced-facies | 5.4 Mt at 1.9% Cu, 5.5 g/t Ag | USGS, 2015 |
Sediment hosted copper exploration: what works
The USGS says the sole aim of exploration is a discovery, and that the first-stage tools match those of resource assessment. In practice the sequence is:
- Outline a permissive tract. Draw the area where reduced host rocks lie above red beds at least 300 m thick, or within 10 km of them. Basin margins, where reduced beds onlap a basement high, are better than basin centres. Slow-subsiding shallow platforms are less favourable.
- Map beds, structure and zoning. Mapping is, in the USGS words, by far the most important step. Reconnaissance scale is enough at first: identify the major rock packages, the red-bed source, the faults and the reduced trap beds. Weathered sulfide pseudomorphs, malachite and Cu-bearing black oxides on joints are all clues.
- Use regional geophysics. Magnetic and gravity surveys are first-order tools where the target beds are covered, and seismic work is the most reliable way to see onlap and traps. Induced polarisation can detect the sulfides directly in resistive sandstone terrain, but may fail beneath carbonaceous or pyritic shale.
- Sample the surface. Copper is an excellent pathfinder in soil and stream sediment, with silver and cobalt as partners, and lead, zinc, arsenic, mercury, manganese and barium as outer-halo elements. Soil gas may help for sandstone-type systems.
- Drill-test. Drilling confirms grade, thickness and continuity. Because the ore is a thin sheet, the angle and spacing of holes matter.
The Angola programme described above follows the same logic under sand cover: airborne magnetics and gravity first, soil sampling next, then passive seismic and electromagnetic surveys to find the depth of the sand, then stratigraphic drilling. A licence that has no sedimentary basin, no red beds or no reduced host does not fit the model, however much copper is in the next country.
What satellites can map for these deposits
Satellites help most at the first two steps. The USGS notes that bleaching of red beds can be detected from Landsat colours or from ferric-oxide signals in ASTER or AVIRIS imagery, which can narrow the search for sandstone-type deposits, because only bleached former red beds can be mineralised by later ore systems. That narrows the search before anyone walks the ground. Structure matters too: a 2026 study of the Musonoi area in the DRC combined ASTER and Landsat 8 imagery with field and borehole data in a Random Forest model. Its strongest controls were lineament density (33.6%), fault proximity (31.0%) and a hydrothermal alteration index (26.3%), and the authors confirmed the result against known deposits while noting limits of spatial resolution and training data (Frontiers in Remote Sensing, 2026).
Satellites map surface and near-surface signatures; sampling and drilling confirm. Farmonaut can map faults, alteration and host-rock patterns across a licence area and deliver a satellite mineral report in 5 to 20 business days. For how the method works in general, see how satellite mineral exploration works, and to ask about a specific licence use the quote form.
▶ Remote sensing for mining explained in a few minutes. · 2:01
Estimate the size of a flat orebody
Thin, sheet-like ore makes the arithmetic simple: area times thickness times density gives tonnes. The calculator below applies that to your own numbers. As a sanity check, the USGS gives Lubin-Sieroszowice a footprint of more than 15 by 28 km and an ore thickness of 2 to 10 m. At an assumed 2.6 t/m3, a 420 km2 sheet 2 m thick holds about 2.2 billion tonnes and one 10 m thick about 10.9 billion tonnes; the compiled 3,612 million tonnes sits between those two. The default inputs describe a small hypothetical block, and the dollar line is an example gross value of that block at an example price, not a value of any deposit. The result is an exploration target, not a JORC / NI 43-101 / SAMREC resource.
Calculator
How much copper could a thin block of ore hold?
Enter your own footprint, thickness, density, grade and recovery.
- Ore tonnes (millions): 1.6
- Recovered copper (tonnes): 19,890
- Example gross value of this block (US$): $198,900,000
Example values only, not a benchmark. The default is a small hypothetical block. Footprint and thickness are inputs (USGS, 2015, gives Lubin-Sieroszowice more than 15 by 28 km and 2 to 10 m for scale); density is assumed. The price is an example, use today’s price. The US$ line is an example gross value of a hypothetical block, not a deposit value. Exploration target, not a JORC / NI 43-101 resource.
Frequently asked questions
What is a sediment-hosted copper deposit?
It is a copper deposit in sedimentary rock where copper sulfides follow the bedding. Oxidised brines carried copper from red beds and deposited it where reductants such as organic matter, pyrite or petroleum were present. The USGS says the class gives about 20 percent of the world’s copper.
What is the difference between sediment-hosted stratiform and stratabound copper?
In practice, nothing important. Both terms describe copper that stays inside certain beds. The USGS uses “stratabound”, and many papers and company reports use “stratiform”. The three subtypes (reduced-facies, sandstone and redbed) cover both.
Where are the biggest sediment-hosted copper deposits?
The USGS counts 47 deposits of the class with more than 1.056 million tonnes of contained copper, and says the Kupferschiefer of central Europe and the Central African Copperbelt hold 36 of them. Other districts include the Kalahari copper belt in Botswana and Namibia, Udokan in Russia and the Chu-Sarysu basin in Kazakhstan.
What is the Kupferschiefer?
It is a thin black shale, only 30 to 50 cm thick at the Polish mines, that forms the base of the Zechstein sequence. Together with the sandstone below and carbonate above it, it makes a 2 to 10 m orebody. KGHM mines it in southwest Poland for copper and silver.
What does Central African Copperbelt geology look like?
Ore sits in dolomitic and shaly beds of the Roan Group, part of the Neoproterozoic Katanga Supergroup in the DRC and Zambia. Folding and thrusting later cut the beds into slices, and weathering produced malachite and black cobalt oxides at surface.
What is the Kalahari copper belt?
It is a belt of copper-silver deposits in northwest Botswana and Namibia, hosted mostly at the base of the D’Kar Formation along a redox boundary and folded in the Ghanzi-Chobe belt. Khoemacau is its best-known mine, and the USGS paper on the Botswana part of the belt maps basin highs in the Ghanzi Ridge area.
What is redbed copper?
It is a subtype of sediment-hosted copper in grey, plant-rich river sandstone inside red beds. Deposits are usually small, rarely above 10 million tonnes, but can be rich, such as Corocoro in Bolivia at a compiled 7.1% Cu (probably hand-sorted ore).
What grades do these deposits have?
USGS averages outside the Copperbelt are 1.38% Cu (reduced-facies), 1.08% (sandstone) and 2.09% (redbed). Inside the Copperbelt they are 2.59% and 2.20% for reduced-facies and sandstone ores.
Why is cobalt linked to these deposits?
Cobalt travels in the same brines and forms an outer fringe or co-product phase, especially in the Copperbelt. The USGS says the great majority of identified world cobalt resources are in sediment-hosted stratiform copper deposits in the DRC and Zambia, and the DRC made about 230,000 tonnes in 2025.
How is sediment hosted copper exploration done under sand or cover?
With regional magnetic and gravity data, seismic and electromagnetic surveys to map basin structure, and soil geochemistry. The USGS reports that soil surveys worked in Botswana through tens of metres of Kalahari sand, and Ivanhoe describes a staged programme of this kind in Angola.
Can satellites find sediment-hosted copper?
They cannot see ore at depth. They can map bleached red beds, iron oxides, faults and alteration that narrow where to sample, as the DRC Musonoi study did with ASTER and Landsat data. Sampling and drilling confirm any target.
Are the figures here resources I can rely on?
No. Grades and tonnages are published compilations or company reports with their dates. They are exploration context, not a JORC, NI 43-101 or SAMREC resource, and they do not apply to other ground.
This page is for information only. It is not investment advice. Grades and tonnages are published compilations or company reports with their dates; they are exploration context, not a JORC, NI 43-101 or SAMREC resource. Check licence rules with the ministry before you apply, and get the landowner’s permission before you sample or drill.
Farmonaut mining
Screen your licence area from space
Send a boundary and get a satellite mineral report on faults, alteration and host rocks in 5 to 20 business days.
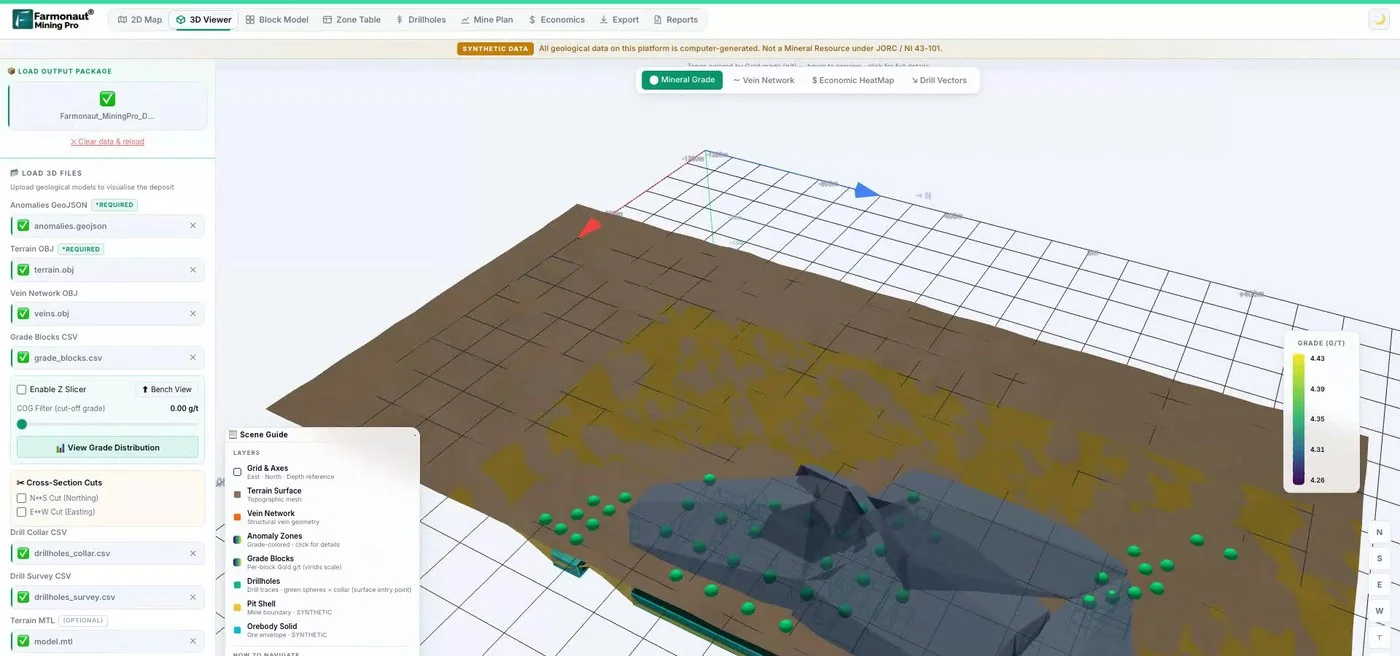
Mining Pro sample view, synthetic data
Sources
- USGS, Sediment-Hosted Stratabound Copper Deposit Model, SIR 2010-5070-M (2015): pubs.usgs.gov
- USGS, Mineral Commodity Summaries 2026: Copper: pubs.usgs.gov
- USGS, Mineral Commodity Summaries 2026: Cobalt: pubs.usgs.gov
- Hall and others, USGS, Copper-silver mineralization in the Kalahari Copperbelt, Botswana (2018): pubs.usgs.gov
- Frontiers in Remote Sensing, Geological mapping of copper deposits in the DRC with remote sensing and machine learning (2026): frontiersin.org
- Ivanhoe Mines, Q4 and full-year 2025 financial results: ivanhoemines.com
- Ivanhoe Mines, 2025 production results and 2026 guidance: ivanhoemines.com
- KGHM, Lubin mine: kghm.com
- KGHM, Q4 2025 results presentation: kghm.com
- MMG, December quarter 2025 production report: mmg.com
- Mining Technology, Khoemacau copper project, Botswana: mining-technology.com
- Sandfire Resources, June 2026 quarterly report (ASX): announcements.asx.com.au
- MMG, Mineral Resources and Ore Reserves Statement as at 30 June 2025: mmg.com
Discussion
Questions, corrections or field experience? Share them below. First-time comments are reviewed before they appear, and your email is never published.
No comments yet. Be the first to add a question or your experience.

 Ileys General Trading
 SG Gold Mining LLC
 VRV Global Pte Ltd
 Omsri International FZE
 G.I.T.T.
 Jaunita Erss Ltd
 Almosi SARL
 SRK Consulting
 Berks Gold Limited
 Mwerezi Minerals Company Limited
 Mining SARL
 SenGold Invest SAS
 Sean Mining Limited
 NTS Group (Pty) Ltd
 Mine4Africa
 Lithspo Minerals Limited
 Tintina Mining Group

 Licence holder · Nigeria · Gold + lithium










