

Copper & lithium · Country data
Global Copper Reserves by Country: USGS Data Ranked
Chile holds 180 million tonnes of the world’s 980 million tonnes of copper reserves, ahead of Australia, Peru, Congo (Kinshasa) and Russia (USGS, 2026). Lithium reserves total 37 million tonnes, led by Chile and Australia.
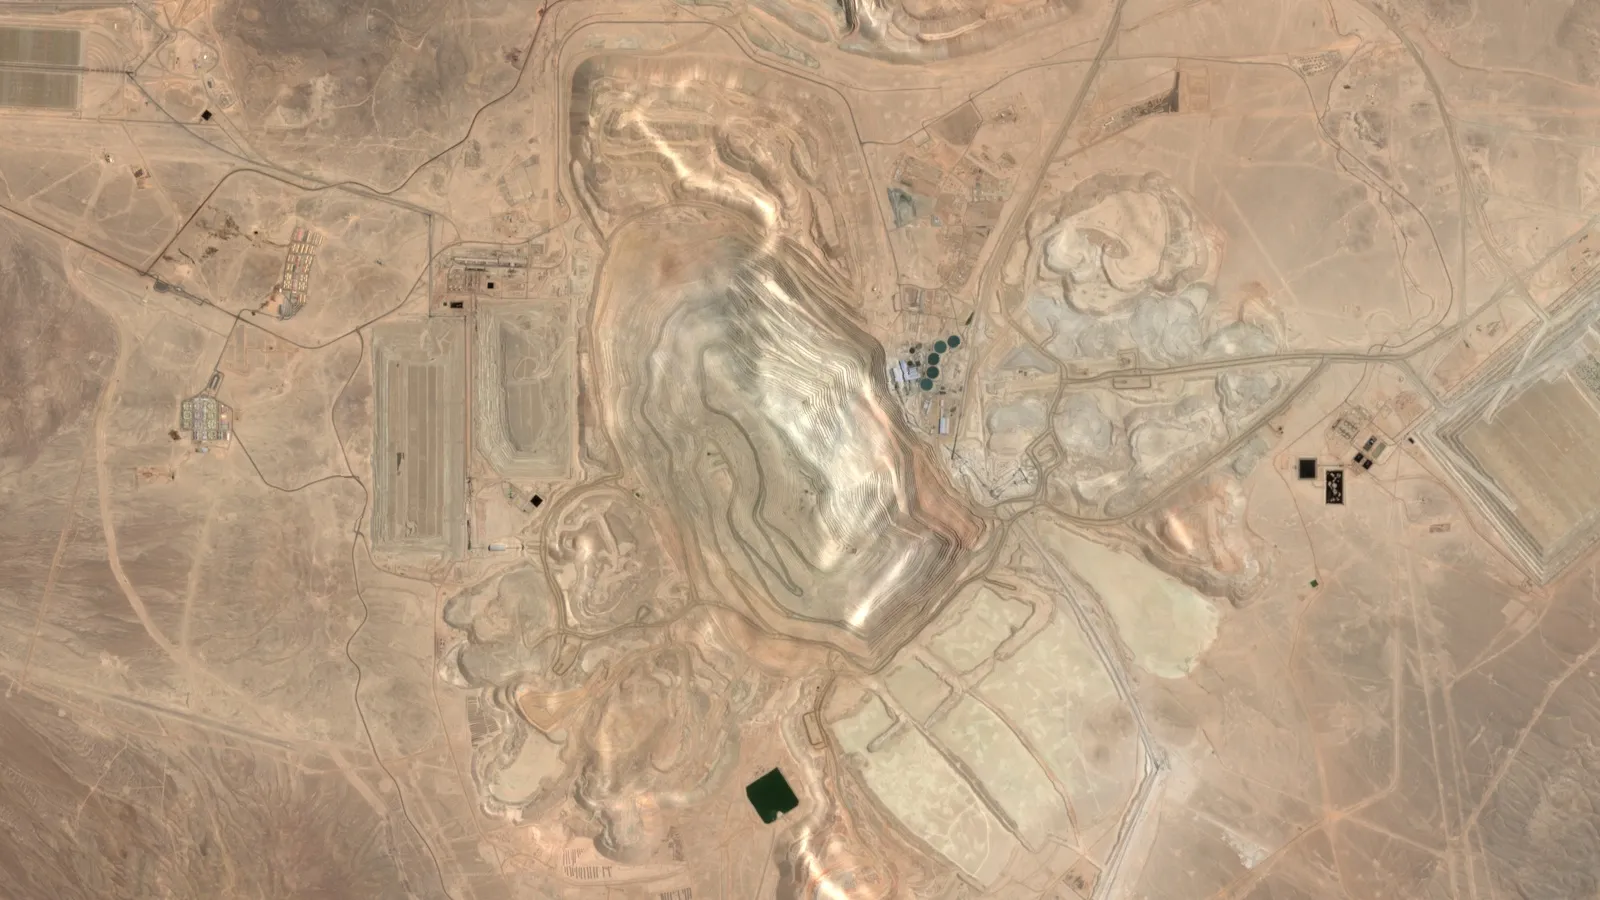
Key takeaways
- Chile leads copper reserves with 180 Mt, about 18% of the 980 Mt world total (USGS, 2026).
- Australia lists 100 Mt, but only 27 Mt is JORC-compliant or equivalent (USGS, 2026).
- At about 23 Mt of 2025 mine output, world copper reserves equal roughly 43 years of supply.
- World lithium reserves rose to 37 Mt; Chile (9.2 Mt) and Australia (8.4 Mt) lead (USGS, 2026).
- Lithium mine output outside the U.S. rose about 31% to 290,000 t in 2025 (USGS, 2026).
In this article
- Global copper reserves by country: the USGS table
- What "reserves" means and why Australia has two numbers
- How many years of copper does each country have left?
- How the copper figures changed in the latest USGS report
- Copper production by country and the price picture
- Calculate reserve life and in-ground value
- Lithium reserves and production by country
- Lithium resources: where the next supply could come from
- Copper vs lithium reserves: key differences for analysts
- How to use USGS reserve data in a project report
- Frequently asked questions
Chile holds the largest copper reserves of any country, at 180 million tonnes, or about 18% of the world total of 980 million tonnes, according to the USGS Mineral Commodity Summaries 2026. Australia (100 million tonnes), Peru (85 million), and Congo (Kinshasa) and Russia (80 million each) follow. The same USGS report puts world lithium reserves at 37 million tonnes, led by Chile and Australia.
This page gives the full USGS country table for copper, explains what a “reserve” really means, shows how many years each country’s reserves would last at today’s mining rate, and sets out the matching lithium figures. A calculator lets you test reserve life and in-ground value with your own numbers.
Global copper reserves by country: the USGS table
The table below lists every country that the U.S. Geological Survey (USGS) reports by name. Reserves are in million tonnes of contained copper (the metal itself, not the weight of ore). Mine production is the USGS estimate for 2025. The share column is each country’s part of the 980 million tonne world total.
Chart
Copper reserves by country
Million tonnes of contained copper
| Rank | Country | Reserves (Mt Cu) | Share of world | Mine output 2025e (kt Cu) |
|---|---|---|---|---|
| 1 | Chile | 180 | 18.4% | 5,300 |
| 2 | Australia | 100 (27 under JORC) | 10.2% | 730 |
| 3 | Peru | 85 | 8.7% | 2,700 |
| 4= | Congo (Kinshasa) | 80 | 8.2% | 3,200 |
| 4= | Russia | 80 | 8.2% | 1,300 |
| 6 | Mexico | 53 | 5.4% | 690 |
| 7 | United States | 47 | 4.8% | 1,000 |
| 8 | China | 41 | 4.2% | 1,800 |
| 9 | Poland | 33 | 3.4% | 410 |
| 10= | Indonesia | 21 | 2.1% | 710 |
| 10= | Zambia | 21 | 2.1% | 940 |
| 12 | Kazakhstan | 20 | 2.0% | 710 |
| 13 | Canada | 7 | 0.7% | 500 |
| – | Other countries | 210 | 21.4% | 3,000 |
| – | World (rounded) | 980 | 100% | 23,000 |
How we ranked: by the reserves column of the USGS Mineral Commodity Summaries 2026 copper chapter, published in early 2026. Shares are our arithmetic on the USGS figures. One smaller producer listed by USGS with 2.2 Mt of reserves is not shown above; the rest of the world sits in the “other countries” line.
Three points stand out. First, the top five hold about 54% of known reserves. Second, the order for reserves is not the order for output: Congo (Kinshasa) is the second-largest miner but ranks fourth on reserves, while Australia ranks second on reserves but mines less than Zambia. Third, about a fifth of reserves sit in countries the USGS does not list by name.
What “reserves” means and why Australia has two numbers
A reserve is the part of a deposit that can be mined at a profit with today’s technology and prices. A resource is wider: it includes copper that is known or expected but not yet proven to be economic. In its definitions appendix, the USGS describes reserves as the part of the reserve base that could be economically extracted at the time the estimate is made. So reserves move with prices, costs and new drilling, not only with new discoveries.
Australia shows why this matters. USGS lists 100 Mt for Australia, but a footnote says that reserves compliant with the JORC Code (the Australian reporting standard that listed companies must follow) were only 27 Mt. The larger figure comes from Geoscience Australia’s national inventory, which counts economic demonstrated resources more broadly than company reserve statements. If you compare Australia with Chile or Peru, use the same basis for both, or say which basis you used.
Other terms on this page:
- Mine production: copper content of ore and concentrate mined in a year.
- Refinery production: copper turned into cathode (99.99% pure metal) at refineries, from local or imported feed.
- Grade: the share of copper in the ore, usually in percent.
- Concentrate: ground and floated ore with a much higher copper content than the rock it came from, shipped to smelters.
Beyond reserves, the USGS global copper resource assessment estimated 1.5 billion tonnes of copper in identified resources as of 2015, plus about 3.5 billion tonnes in undiscovered deposits. Reserves are the slice that today’s mines and projects can support.
How many years of copper does each country have left?
Dividing reserves by yearly mine output gives a simple “reserve life”. It is not a forecast. Reserves grow as mines drill out ore around existing pits, and they shrink when prices fall or costs rise. Still, it shows where supply growth is most likely to come from.
Chart
Reserves vs yearly mine output
Copper reserves (Mt) against 2025 mine output (Mt)
- World: 980 Mt ÷ 23 Mt a year = about 43 years.
- Chile: 180 ÷ 5.3 = about 34 years.
- Peru: 85 ÷ 2.7 = about 31 years.
- Congo (Kinshasa): 80 ÷ 3.2 = about 25 years.
- China: 41 ÷ 1.8 = about 23 years.
- Zambia: 21 ÷ 0.94 = about 22 years.
- United States: 47 ÷ 1.0 = about 47 years.
- Mexico: 53 ÷ 0.69 = about 77 years.
- Australia: about 137 years on the 100 Mt figure, or about 37 years on the 27 Mt JORC figure.
Countries with long reserve lives but modest output, such as Mexico, Poland and Russia, have room to mine more if projects are built. Countries with short lives and high output, such as Congo (Kinshasa) and Zambia, depend on exploration to keep adding ore. That is one reason the copper belts of Central Africa attract much of the world’s early-stage drilling. For the main operations there, see our list of the top copper mines in the DRC ranked by output.
How the copper figures changed in the latest USGS report
The world total stayed at 980 Mt between the 2025 and 2026 editions, but USGS revised several countries using company, government and industry reports. Chile fell from 190 Mt to 180 Mt, Peru from 100 Mt to 85 Mt, Canada from 8.3 Mt to 7 Mt and Poland from 34 Mt to 33 Mt. The “other countries” line rose from 180 Mt to 210 Mt, which offset those cuts. The 2025 edition is the comparison point.
Chart
Copper reserve revisions between USGS editions
Million tonnes, 2025 edition vs 2026 edition
Mine output was flat at about 23 Mt in 2025. Congo (Kinshasa) rose from 2.99 Mt to 3.2 Mt and Russia from 1.02 Mt to 1.3 Mt, while Indonesia fell from 1.01 Mt to 0.71 Mt. Refining is far more concentrated: China produced an estimated 14 Mt of the world’s 29 Mt of refined copper in 2025, close to half, from local and imported concentrate.
A smaller earlier USGS edition is covered in our post on the USGS copper summary with 22 million tons of output; the figures on this page replace those older numbers.
Copper production by country and the price picture
Chile mined about 5.3 Mt in 2025, about 23% of the world total, followed by Congo (Kinshasa) at 3.2 Mt and Peru at 2.7 Mt. In North America, the USGS puts U.S. mine output at about 1.0 Mt in 2025, with Arizona supplying about 70% of it. Natural Resources Canada reports that Canadian mines produced 514,582 tonnes of copper in concentrate in 2024, with British Columbia supplying about 48%.
Prices have risen fast. USGS estimated an average London Metal Exchange (LME) cash price of 440 US cents per pound for 2025, up from 414.7 cents in 2024. On 11 November 2026 the LME copper cash settlement was US$13,875.50 per tonne (LME data via Westmetall), or roughly US$6.29 per pound. Higher prices tend to convert more resources into reserves over time, because more low-grade ore becomes worth mining.
In the United States, copper was added to the federal list of critical minerals in November 2025, according to the USGS copper chapter. For U.S. producers, see our ranking of US copper mining companies by US output, and for the global picture the largest copper mining companies ranked by output.
▶ Explains what mining brings to an economy: exports, jobs and revenue. · 5:03
Calculate reserve life and in-ground value
Use the calculator below with any country’s reserves and output from the table, or with your own project figures. It divides reserves by yearly output for reserve life and multiplies contained copper by a price you enter. In-ground value is a gross number: it ignores grade losses, recovery, mining cost, smelter charges, royalties and tax, so it is far higher than what any mine would earn.
Calculator
How long would these copper reserves last, and what are they worth in the ground?
Enter reserves and yearly output from the table, or your own project numbers.
- Gross in-ground value (US$): $2,340,000,000,000
- Yearly output value at this price (US$): $68,900,000,000
Example values only (Chile, USGS 2026), not a forecast. In-ground value is gross: before recovery, costs, smelter charges, royalties and tax. The price is an input: example, use today’s price.
Lithium reserves and production by country
The USGS puts world lithium reserves at 37 million tonnes of lithium content in its 2026 lithium chapter, up from 30 million tonnes a year earlier. Figures are lithium metal content, not lithium carbonate equivalent (LCE); one tonne of lithium is about 5.3 tonnes of LCE.
Chart
Lithium mine output by country, 2025
Thousand tonnes of lithium content (estimates)
| Country | Reserves (t Li) | Mine output 2024 (t) | Mine output 2025e (t) | Main source type |
|---|---|---|---|---|
| Chile | 9,200,000 | 48,900 | 56,000 | Salt-flat brine |
| Australia | 8,400,000 (5.1 Mt JORC) | 82,700 | 92,000 | Hard rock (spodumene) |
| China | 4,600,000 | 41,400 | 62,000 | Hard rock, brine, lepidolite |
| Argentina | 4,400,000 | 13,800 | 23,000 | Salt-flat brine |
| United States | 4,400,000 | Withheld | Withheld | Brine (Nevada) |
| Canada | 1,600,000 | 4,820 | 5,600 | Hard rock |
| Brazil | 540,000 | 10,200 | 12,000 | Hard rock |
| Zimbabwe | 500,000 | 20,000 | 28,000 | Hard rock |
| Mali | 370,000 | 770 | 9,400 | Hard rock |
| Portugal | 60,000 | 380 | 380 | Hard rock |
| World (rounded, excl. U.S. output) | 37,000,000 | 222,000 | 290,000 | – |
Spodumene is the lithium-bearing mineral in most hard-rock deposits; it is mined from pegmatites (coarse-grained granite veins) and concentrated to about 6% lithium oxide before sale. Brine producers pump salty water from beneath salt flats and evaporate or process it to lithium carbonate.
World output excluding the United States rose about 31% in 2025, from 222,000 tonnes to about 290,000 tonnes, according to USGS. Mali’s jump came from two new operations that started in 2024. USGS revised Argentina’s figures using company reports. USGS reports that U.S. production came from one continental brine operation in Nevada, with figures withheld to protect company data; see our comparison of Nevada lithium mines by reserve.
Australia remains the largest miner, mostly from Western Australia, where the lithium mines in Western Australia are listed by owner. In Canada, Natural Resources Canada reports two operating lithium mines in 2024, in Manitoba and Quebec, producing an estimated 5,983 tonnes of lithium.
Lithium resources: where the next supply could come from
Reserves are only part of the story for lithium. USGS puts measured and indicated lithium resources at about 150 million tonnes worldwide, four times the reserve total. The largest resource holders are Argentina (28 Mt), Bolivia (23 Mt), Chile (13 Mt), and Australia and China (10 Mt each). The United States reports 30 Mt across brines, claystone, geothermal brines and pegmatites.
Bolivia is the clearest gap: large resources but no reserves listed in the USGS table, because projects there have not reached the stage where economic extraction is shown. Germany (8.9 Mt) and Canada (8.1 Mt) also hold large resources compared with their reserves. For an investor or consultant, the resource-to-reserve gap is where future reserve upgrades, and the exploration work behind them, are most likely.
Prices explain the swings in project timing. USGS reports that the annual average U.S. battery-grade lithium carbonate contract price fell from US$63,700 per tonne in 2022 to US$11,800 in 2024 and about US$9,000 in 2025. Spot carbonate prices in China rose from about US$9,300 per tonne in January 2025 to about US$10,300 in November 2025.

▶ Shows how satellite data is used to screen lithium-bearing pegmatites in Nigeria. · 10:49
Copper vs lithium reserves: key differences for analysts
- Concentration. Chile and Australia together hold about 48% of lithium reserves. For copper, the top two hold about 29%.
- Reserve life. Lithium reserves of 37 Mt against about 290,000 t of 2025 output imply well over 100 years, far longer than copper’s roughly 43 years. Lithium demand is growing faster, so that gap narrows each year.
- Revisions. Lithium reserves are revised by large amounts each year as projects publish studies (U.S. reserves went from 1.8 Mt to 4.4 Mt between the 2025 and 2026 USGS editions). Copper revisions are smaller in percentage terms.
- End use. USGS estimates 88% of lithium went into batteries in 2025. Copper use is spread across building, electrical products, transport and machinery.
- Processing. China refines close to half of the world’s copper, so mine reserves alone do not show where supply risk sits.
How to use USGS reserve data in a project report
- Cite the edition and year. Write “USGS Mineral Commodity Summaries 2026” and give the reserve date. Each edition replaces the last.
- Keep units straight. Copper is in tonnes of contained copper; lithium in tonnes of lithium content, not LCE or spodumene concentrate.
- Use one basis for all countries. If you quote Australia’s JORC figure, note that other countries use their own national standards.
- Do not mix reserves and resources. A project’s resource is not a reserve until a feasibility study supports it.
- Check national sources for detail. Geoscience Australia, Natural Resources Canada and the International Copper Study Group publish more detailed country and mine data.
- Date every price. Copper and lithium prices move by double-digit percentages within a year.
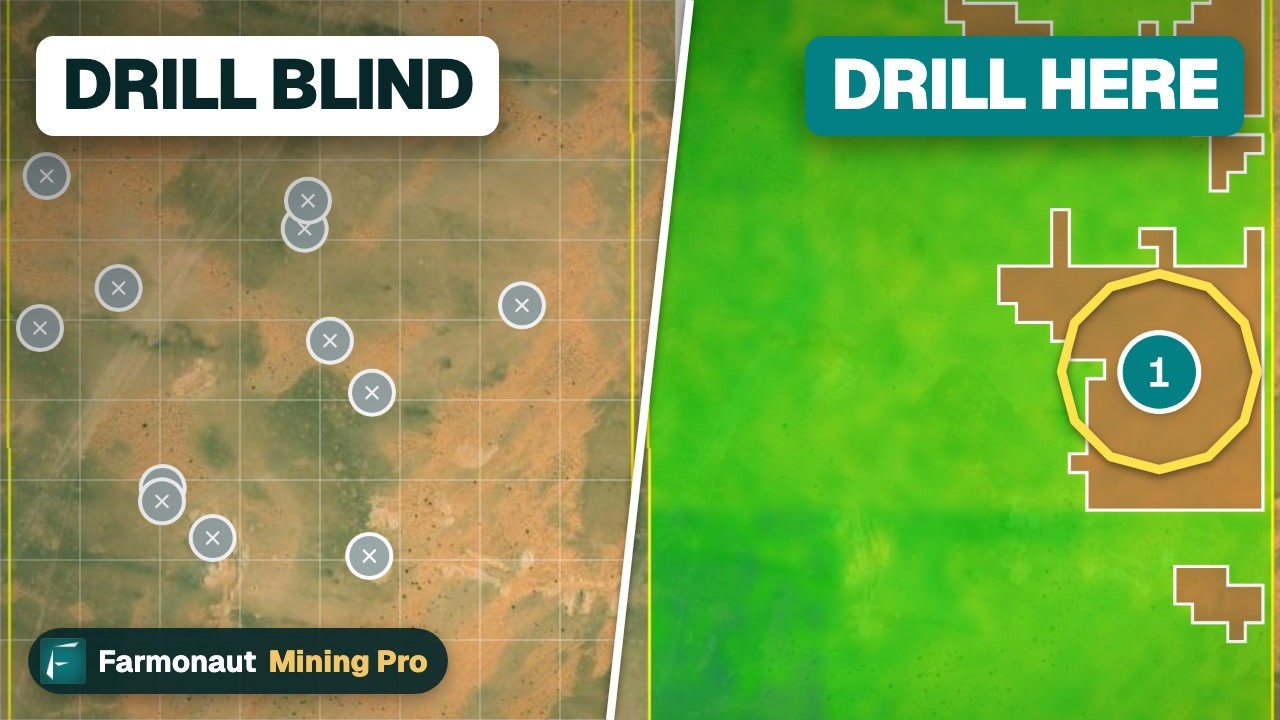
Country totals do not tell you what sits under a single licence. For a site-level first look ahead of field work and drilling, satellite data can map alteration and structure across a licence area; Farmonaut offers satellite-based mineral detection for copper and lithium targets. To discuss a specific area, use the mining query form or contact us.

▶ Looks at what AI and satellite data can and cannot do in mineral exploration. · 4:37
Frequently asked questions
Which country has the largest copper reserves?
Chile, with 180 million tonnes of copper, about 18% of the world’s 980 million tonnes, according to USGS Mineral Commodity Summaries 2026.
What are the total global copper reserves?
About 980 million tonnes of contained copper, per USGS. Identified resources are larger, at about 1.5 billion tonnes in the 2015 USGS assessment.
Which countries are in the top 5 for copper reserves?
Chile (180 Mt), Australia (100 Mt), Peru (85 Mt), and Congo (Kinshasa) and Russia (80 Mt each), per USGS 2026.
How many years of copper reserves are left?
At about 23 million tonnes of mine output a year, 980 million tonnes of reserves equal roughly 43 years. Reserves are revised as prices, costs and drilling change, so this is not a depletion date.
How much copper does the United States have?
USGS lists U.S. copper reserves of 47 million tonnes and estimated 2025 mine output of about 1.0 million tonnes, mostly from Arizona.
Why does Australia have two copper reserve figures?
USGS reports 100 Mt from Geoscience Australia’s national inventory, and notes that JORC-compliant or equivalent reserves were 27 Mt.
Which country produces the most copper?
Chile mined about 5.3 million tonnes in 2025, followed by Congo (Kinshasa) at 3.2 million and Peru at 2.7 million tonnes (USGS estimates).
Which country has the largest lithium reserves?
Chile, with 9.2 million tonnes of lithium, followed by Australia with 8.4 million tonnes, out of a world total of 37 million tonnes (USGS 2026).
Which country produces the most lithium?
Australia, with an estimated 92,000 tonnes in 2025, ahead of China (62,000 t) and Chile (56,000 t).
How much lithium did the world produce?
About 290,000 tonnes of lithium excluding U.S. output, up about 31% from 222,000 tonnes in 2024, per USGS.
Where can I download the USGS Mineral Commodity Summaries?
Each commodity chapter is a PDF on pubs.usgs.gov under the Mineral Commodity Summaries series. The copper and lithium chapters used here are linked in the sources below.
More from Farmonaut: ag inputs 2026 top agriculture farm inputs innovations, usgs mineral commodity summaries copper lithium by country.
This page is for information only. It is not investment advice.
Farmonaut mining
Map your mining site from space
Consultants can screen a copper or lithium licence area with satellite data to set exploration targets ahead of field work.
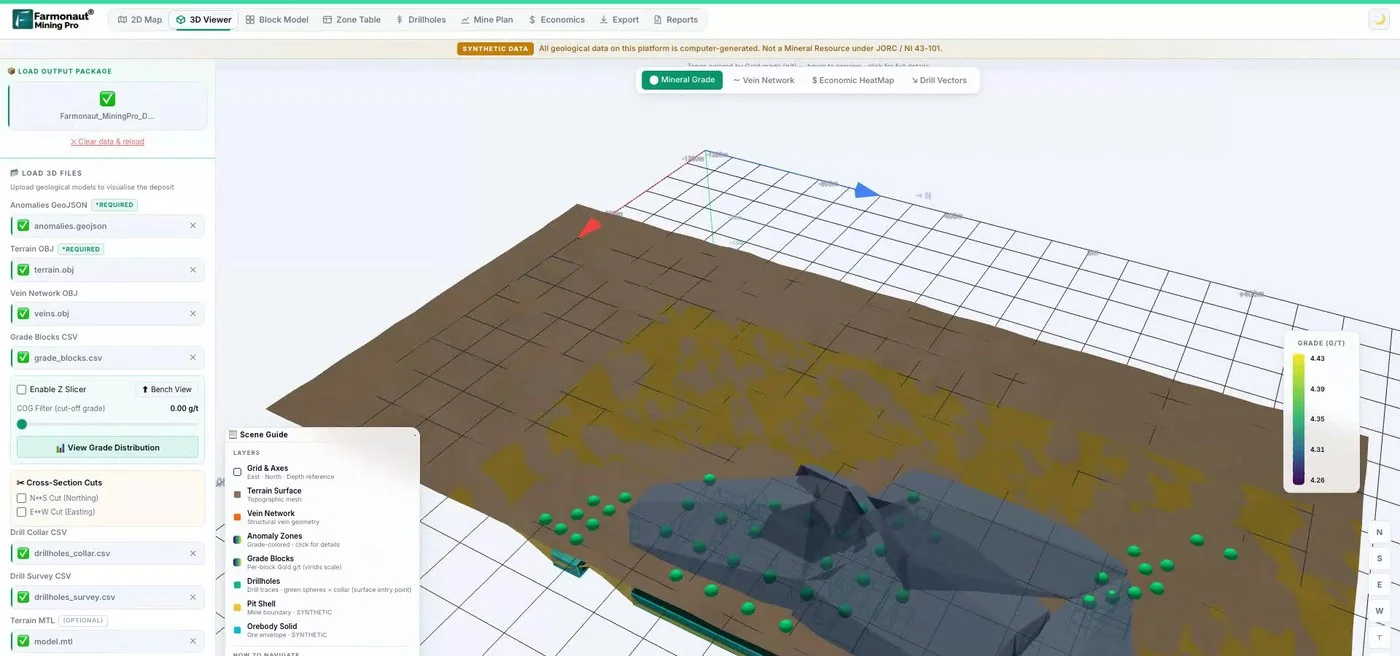
Mining Pro sample view, synthetic data
Keep reading
Sources
- USGS, Mineral Commodity Summaries 2026: Copper: pubs.usgs.gov
- USGS, Mineral Commodity Summaries 2026: Lithium: pubs.usgs.gov
- USGS, Mineral Commodity Summaries 2026: Appendixes (definitions): pubs.usgs.gov
- USGS, Mineral Commodity Summaries 2025: Copper: pubs.usgs.gov
- USGS, Mineral Commodity Summaries 2025: Lithium: pubs.usgs.gov
- USGS, Assessment of undiscovered copper resources of the world, 2015 (SIR 2018-5160): pubs.usgs.gov
- Natural Resources Canada, Copper facts: natural-resources.canada.ca
- Natural Resources Canada, Lithium facts: natural-resources.canada.ca
- Geoscience Australia, Australia’s Identified Mineral Resources: ga.gov.au
- International Copper Study Group: icsg.org
- Westmetall, LME copper cash-settlement prices (accessed 12 November 2026): westmetall.com
Discussion
Questions, corrections or field experience? Share them below. First-time comments are reviewed before they appear, and your email is never published.
No comments yet. Be the first to add a question or your experience.

 Mulopwe Metals Mining Ltd
 Tintina Mining Group
 Dalgety Minerals Pty Ltd
 Vortex Minerals Pty Ltd
 Faith At Work (Pty) Ltd
 Geotech Mining Solutions plc
 Vulcan International Limited
 Kidepo Associates
 GKY Mining
 Alkimy SARL
 Double A Trading
 GemSprout Metals Limited
 Qader Group
 Ileys General Trading
 SG Gold Mining LLC
 VRV Global Pte Ltd
 Omsri International FZE
 G.I.T.T.
 Jaunita Erss Ltd
 Almosi SARL
 SRK Consulting
 Berks Gold Limited
 Mwerezi Minerals Company Limited

 Exploration consultancy · South Africa · Gold










