

“By 2026, over 70% of precision agriculture platforms will integrate advanced AI annotation for data visualization.”
“In 2025, annotated agricultural datasets are set to increase by 150%, boosting AI-driven decision-making capabilities.”
Agricultural Data Visualization & AI Annotation: 2026 Trends
As we step into 2026, agricultural data visualization and agriculture data annotation for AI are not just buzzwords—they’re reshaping how the global agriculture sector adapts to climate volatility, rising food demand, and sustainability challenges. The intersection of visualization and AI annotation has become pivotal in enabling precision farming, empowering farmers, agronomists, and policymakers with actionable insights from vast datasets.
This comprehensive guide will help you understand how agricultural data visualization and AI annotation are enabling smarter, more sustainable farming through 2025, 2026, and beyond. We’ll explore relevant technologies, reveal trends, share tips for maximizing benefits, and show how industry leaders like Farmonaut empower agriculture with satellite-driven insights.
- Data visualization enables real-time decision-making, giving farmers and agronomists immediate access to critical crop health, soil moisture, and weather trends.
- AI-powered annotation turns raw field images, drone captures, and satellite scans into machine-learning-ready datasets—fueling the next generation of smart farming technologies!
What is Agricultural Data Visualization in 2026?
Agricultural data visualization refers to the graphical representation of enormous datasets collected from diverse sources: satellite imagery, drones, in-field sensors, weather stations, and farm machinery. By 2026, as precision farming matures, advanced visualization tools and platforms have become the default method for quickly interpreting complex information and facilitating precise interventions.
Why Visualization is Essential for Modern Farming
- ✔ Empowering Decisions: Interactive visual dashboards help farmers and stakeholders identify patterns and anomalies in soil health, moisture levels, and crop growth—enabling rapid response to issues.
- 📊 Data at Scale: Visualization simplifies big data—millions of sensor readings, satellite images, and drone captures—into actionable maps and charts for farming.
- ⚠ Risk Management: Visual scenario planning allows simulation of outcomes (e.g., drought forecasts, pest outbreaks), supporting better planting and harvesting schedules.
Core Components of Agricultural Data Visualization
- ✔ Real-time visual maps: Highlight soil moisture variability, crop health indices, and pest infestation levels.
- 📊 Integrated historical & predictive analytics: Use AI models with historical and real-time data to predict yield and optimize resource use.
- ✔ Stakeholder dashboards: Consolidate diverse information (weather, satellite, sensors) for farmers, agronomists, and policymakers.
- 📊 Supply chain visualizations: Track crop quality, forecast market yield, and visualize logistics—minimizing food waste.
For instance, a real-time soil moisture map enables targeted irrigation—optimizing water use and minimizing environmental impacts like wastage and chemical runoff.
- The global agricultural data visualization market is tipped to grow rapidly through 2026, with high adoption among agri-tech, insurance, and resource management sectors.
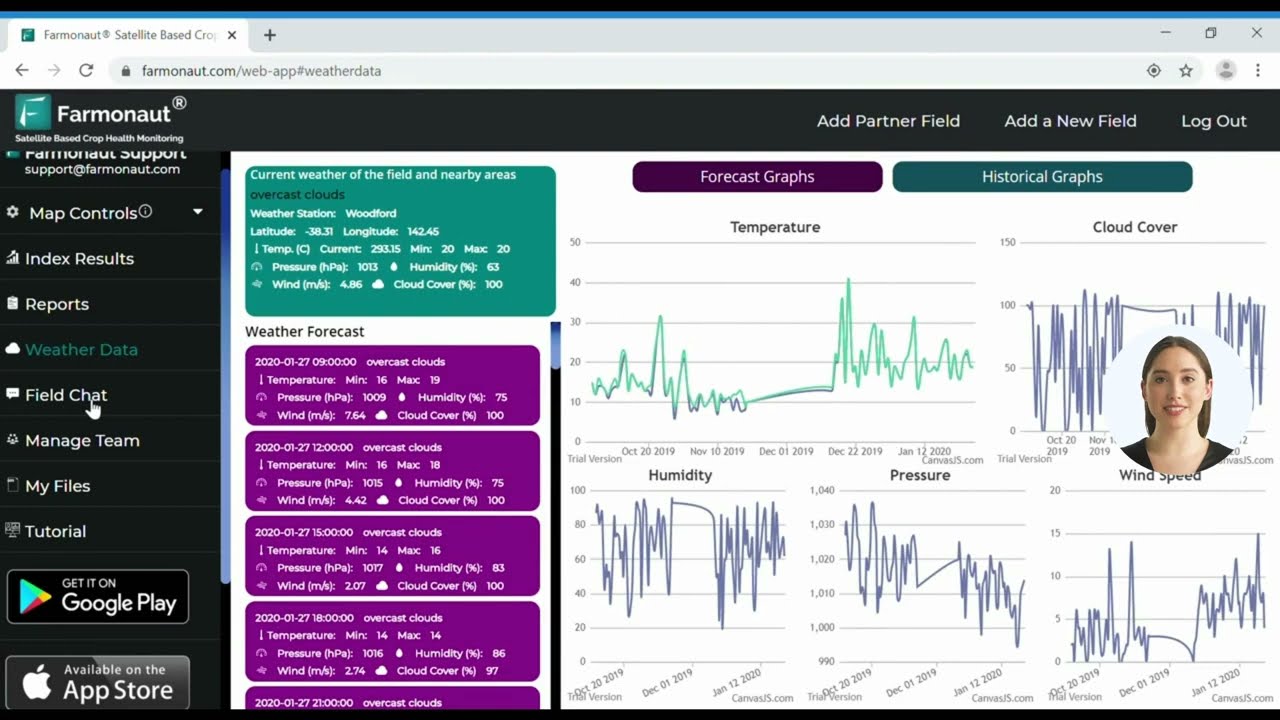
- Platforms offering satellite-based insights and robust visual interfaces—as seen in Farmonaut’s Large Scale Farm Management solutions—stand out for scalability and ROI.

How Data Visualization Empowers Sustainable Farming
Visualization tools also help track progress on carbon footprint and sustainability projects. By mapping emissions and resource usage, farms can comply with evolving regulations and market expectations for sustainable production.
In forestry, real-time maps visualize tree growth, disease detection, and harvest cycles, supporting resource management and disaster mitigation. Similarly, agriculture data visualization supports market planning by forecasting crop quality and yield for transparent supply chains.
- Use interactive dashboards with both historical and live data for more accurate predictive analytics. Cross-referencing satellite imagery with in-field sensors leads to the most reliable forecasts and yield insights.

Common Mistake:
- Failing to configure visualization platforms with geo-referenced and properly annotated datasets often leads to inaccurate maps, misguided resource allocations, or missed disease outbreaks on farms.
Agriculture Data Annotation for AI: 2026 and Beyond
Artificial Intelligence (AI), fueled by well-annotated agricultural datasets, is revolutionizing farming systems in 2025 and 2026. Data annotation—the process of labeling raw satellite imagery, drone captures, sensor logs, and farm machinery readings—is the backbone of modern, automated decision-making.
Types of Annotation in Agricultural Data
- ✔ Image labeling: Tagging leaf color, pest damage, growth stages, and soil erosion in high-resolution drone and satellite images.
- 📊 Sensor data annotation: Marking anomalies and trends in soil moisture, temperature, and weather patterns.
- ✔ Time-series annotation: Labeling sequences of events, such as the onset of a pest outbreak or a fertilizer application.
Why Meticulous Annotation is Essential?
AI models trained on granular, precisely annotated datasets become far better at tasks like identifying crop disease, assessing soil health, and predicting yield. In 2026, annotation quality directly impacts AI reliability and the agricultural sector’s capacity to scale up data-driven practices.
- ✔ Higher granularity annotation ensures AI can distinguish between similar symptoms caused by different stressors.
- ✔ Semi-automated annotation tools reduce manual labor—speeding the build of large, robust datasets.
- ✔ Annotated data feeds precise AI outputs for autonomous spraying, early warnings on disease outbreaks, and more.

Example: In 2026, autonomous field robots use AI models trained on annotated drone imagery to spot early signs of pest infestation—prompting intervention before an outbreak spirals.
- ✔ High-resolution annotation → enables detailed disease and pest identification
- ✔ Multi-modal annotation → combines imagery, sensor, and machinery data for holistic decision-making.
- ✔ Blockchain traceability in data annotation secures supply chains and enhances market trust. Read how Farmonaut’s traceability solutions can help.
- ✔ Improved AI outputs → unlocks real-time, actionable insights on-farm.



Explore the Farmonaut API for satellite data access |
See our Developer Docs!

Key Benefits of Annotated Data for AI in Agriculture
- ✔ Enabling smarter fertilizer, irrigation, and pesticide use—reducing costs and minimizing environmental impacts.
- 📊 Ensuring transparency for insurance, traceability, and compliance (learn about crop insurance verification powered by satellite data).
- ✔ Enabling real-time integrations with blockchain for trust and food traceability.
- ✔ Empowering remote, edge-based decision-making—insights available on-site or on-device instantly thanks to streamlined annotation pipelines.
- 🌱 Predictive pest and disease detection → fewer losses and rapid response
- 💧 Water savings → via data-led irrigation supported by visual AI models
- 🛡️ Improved food safety through supply chain verification
- 🧬 Personalized, field-section-level recommendations → higher yields and sustainability
Synergy: How Visualization and AI Annotation Transform Agriculture
The synergy between data visualization and annotation for AI creates a feedback loop of ever-sharpening agricultural insight. Annotated datasets make AI more accurate; AI outputs become actionable through modern visualizations.
- ✔ Disease detection models → show high-risk zones right on farm maps.
- ✔ Yield forecasts → visualize future scenarios for improved planning and risk management.
- ✔ Resource mapping → pinpoints variable soil moisture, nutrients, and health indices across fields.
Such integration enables the transition from reactive to proactive farming. Threats are predicted—and mitigated—far in advance.
Comparative Trends: Agricultural Data Visualization & AI Annotation Technologies (2024–2026)
| Year | Key Visualization Technology | AI Annotation Technique | Precision Farming Impact (Estimated Yield % Improvement) |
Adoption Rate (% of Farms Using) | Sustainability Benefit (Est. Water Savings %) |
|---|---|---|---|---|---|
| 2024 | Satellite NDVI maps & static dashboards | Manual image & sensor labeling | 8–10% | 24% | 5–7% |
| 2025 | Interactive, real-time visual dashboards—multisource integration (satellite, drones, IoT) | Semi-automated annotation with AI-assist; Large-scale image & geospatial labeling | 12–15% | 45% | 10–14% |
| 2026 | Augmented reality overlays, AI-powered scenario mapping, edge-integrated visualization platforms | Fully automated, multimodal annotation (video, multispectral, sensor logs); Blockchain-enhanced traceability | 18–24% | 70%+ | 18–22% |
“By 2026, over 70% of precision agriculture platforms will integrate advanced AI annotation for data visualization.”
“In 2025, annotated agricultural datasets are set to increase by 150%, boosting AI-driven decision-making capabilities.”

Examples: Precision Farming in Action
- ✔ Autonomous spraying: Drones analyze annotated images, identifying zones needing treatment—reducing chemical use and runoff.
- ✔ Yield mapping: AI-powered scenario mapping lets farmers simulate how weather variability might impact yields.
- ✔ Targeted irrigation: Real-time moisture data visualization ensures precise water use.
- ✔ Early disease detection: Integrated visual-annotation systems allow timely interventions, reducing crop loss.

- Farm management platforms that combine AI annotation with dynamic visualizations are prime targets for agri-tech investment in 2026.
Farmonaut: Satellite-Driven Data for Smart Agriculture
As a leading satellite-technology company, we at Farmonaut deliver next-gen agricultural data visualization and AI advisory solutions for the modern era. Our mission is to make satellite-driven insights affordable and accessible for farmers, businesses, and governments worldwide.
- ✔ Real-time satellite crop monitoring via our apps (Android, iOS, Web): See how large-scale managers benefit from our Agro Admin App.
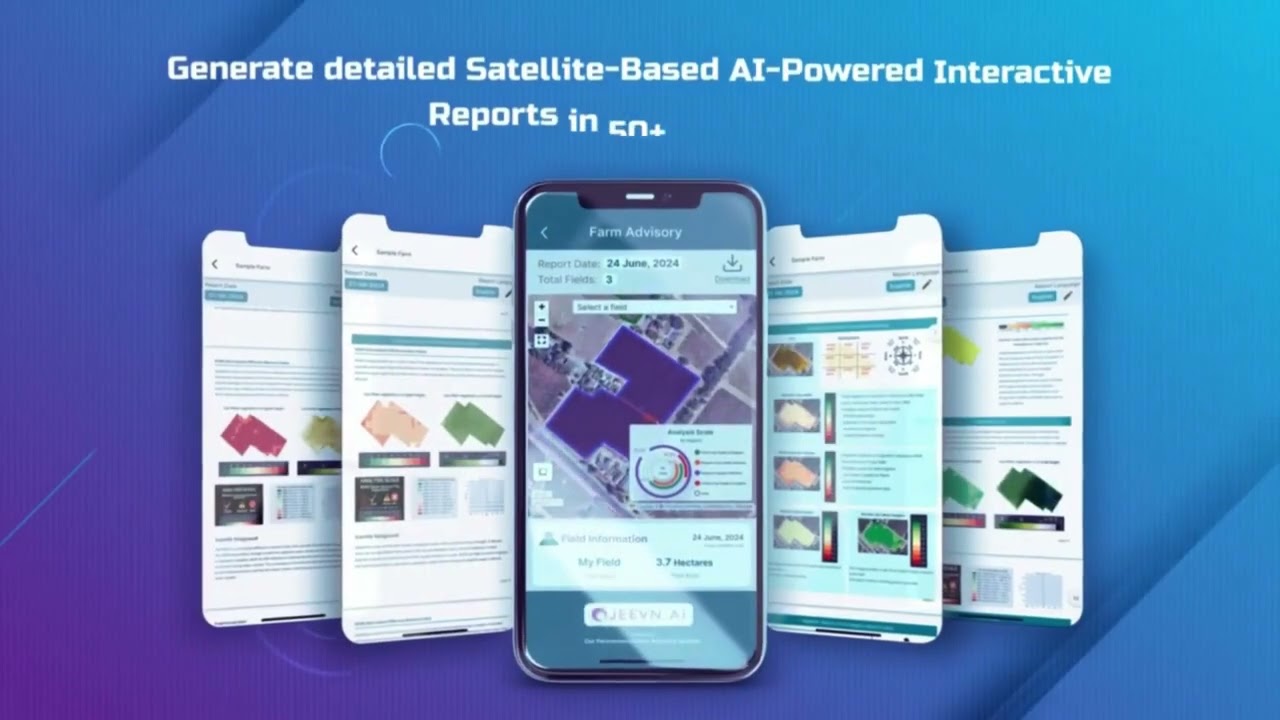
- ✔ Automated AI-powered advisory: Our Jeevn AI system delivers customized, timely recommendations (fertilizer scheduling, irrigation planning, pest risk alerts, and more).
- ✔ Blockchain-based crop traceability: Trusted solutions for food supply chains, ensuring compliance and consumer trust. Discover our traceability platform.
- ✔ Fleet and resource management: Optimize agricultural, mining, and infrastructure operations to lower overhead and maximize resource use.
- ✔ Environmental monitoring & carbon footprinting: Monitor and minimize emissions and resource waste.
Our APIs power custom integrations for agricultural software, analytics, and precision farming equipment across global markets. (Find all info at: Farmonaut Satellite API)
- Combining satellite imagery, artificial intelligence, and blockchain, Farmonaut’s solutions bridge data with actionable advice for better farm, resource, and supply chain management—enabling next-level precision & sustainability.
Challenges in Agricultural Data Visualization & Annotation
- ⚠ Data annotation bottleneck: Manual labeling is time-consuming and demands domain expertise—addressed by growing semi-automated platforms.
- ⚠ Data privacy and security concern: As digital systems capture more on-farm data, ethical use and data protection are imperative.
- ⚠ Integration hurdles: Lack of standardization in annotation protocols and visualization formats across suppliers, regions, and crops.
- ⚠ Connectivity issues: Rural and remote farms may struggle to access real-time cloud-based visualization—pushing demand for edge/ offline-ready solutions.
- Platforms enabling ethical data annotation and easy integration with supply chains attract premium clients —explore Farmonaut’s traceability and fleet management offerings for examples.
Emerging Trends Shaping 2026 and Beyond
- 🎯 Augmented reality (AR) farm overlays: Field workers get AI-generated insights layered directly onto their real-world view through smart devices.
- 🌐 Edge computing for agriculture: Data processing moves nearer to the field—supporting instant AI visualization even in remote zones.
- 🔎 Dynamic data annotation: Faster semi-automated and video annotation approaches, harnessing AI to help humans.
- 🔐 Blockchain-secured data sharing and annotation: Boosting trust within traceability systems for international food supply chains.
- 🚀 Universal, cross-platform visualization standards: Ensuring interoperability across devices, crops, and nations.
Visual List: 2026’s Key Drivers for Adoption
- 👨🌾 Demand for actionable, field-precise advice on every farm
- 📈 ROI pressure—new tools must prove cost savings
- 🔬 Biotechnology & genetics → require massive, annotated training data
- 📦 Food retailers & processors demand traceable, data-backed produce
Farmonaut Subscriptions: Affordable, Scalable Satellite-Driven Insights
Conclusion
Agricultural data visualization and AI-driven annotation are foundational pillars for smart, sustainable agriculture in 2026. With precision farming now mainstream, these technologies are not only enhancing productivity, sustainability, and data-driven planning but are reshaping entire food systems.
Leading platforms like Farmonaut make satellite analytics, AI-powered advisory, traceability, and fleet management affordable and accessible to all—from small landowners to global-scale agribusinesses. By leveraging the best of data, visualization, and annotation, the sector is ready to meet the challenges of climate change, resource scarcity, and global food demand.
With continued evolution in visualization platforms, data annotation techniques, and integrated AI systems, the future of farming promises greater precision, resilience, and impact than ever before.
FAQs: Agricultural Data Visualization & AI Annotation for 2026
- Q1: What is agricultural data visualization and why is it crucial in 2026?
- Agricultural data visualization is the process of translating large, diverse datasets (from satellites, drones, sensors, etc.) into user-friendly maps, dashboards, and charts. It’s crucial for rapid decision-making, supporting precision farming, sustainability efforts, and risk management as climate change and food demand intensify.
- Q2: How does agriculture data annotation for AI work?
- AI annotation involves labeling raw data (images, sensor readings, satellite scans) to train AI models. These models then automate complex tasks—like crop disease detection or irrigation scheduling—helping farmers and agronomists make smarter decisions faster.
- Q3: What are the top benefits of using annotated datasets in agriculture?
-
- Automated, accurate crop monitoring and yield prediction
- Real-time intervention against pests, disease, and environmental threats
- Reduced waste through targeted resource use (water, fertilizer, pesticides)
- Enhanced traceability and supply chain transparency
- Compliance and market access for data-driven, sustainable production
- Q4: How are data visualization and annotation technologies expected to evolve post-2026?
- We’ll see wider integration of augmented reality (AR) on farms, universal annotation standards across nations, and widespread blockchain-backed data traceability. Automated, continuous annotation (including video and sensor streams) will feed AI models for next-level insights, while visualization shifts to immersive, field-level platforms.
- Q5: How does Farmonaut support agricultural data visualization and AI annotation?
- We at Farmonaut deliver real-time, AI-driven satellite analytics, interactive dashboards, and advisory systems via our web/mobile apps and APIs. Our solutions bring affordable, actionable insights to all agricultural stakeholders and support traceability, resource management, and environmental monitoring.

 Byju’s
 Kubota
 FFBS
FFBS Jontra
 Kalustyan
 Tucor
Tucor Geno
Geno Hayleys Agriculture
 Linx Agritech
 Adinet
 Save Your Soils
 Grandstream Algérie
 XOS Realty
 Geospatial Lab Africa
