

Agriculture IoT Devices: What Actually Works on US Farms
Reviewed September 2026 against USDA NASS/AFPC technology adoption surveys and IMARC Group/Market Research Future market sizing.
Try it: Enter values above to calculate. →
Agriculture IoT devices are internet-connected sensors, controllers, and monitoring units — soil probes, irrigation controllers, weather stations, livestock trackers — that feed field data into a dashboard or app so a grower can act on it remotely. In the United States, the agricultural IoT market was valued at $2,940.97 million in 2025 and is projected to reach $8,340 million by 2035, a 10.9% compound annual growth rate, according to Market Research Future. That is the scale of what is actually being deployed. Below is what the devices do, what they cost, what they return, and how adoption breaks down by region — plus a note on “agriculture workholding devices,” a related but distinct term this article also covers.
Table of Contents
- US Agriculture IoT Market Size and Growth
- How Can IoT Help in Agriculture: The Mechanisms
- Comparison Table: Agriculture IoT Device Categories
- Adoption Rates by US Region
- Agriculture Workholding Devices: What the Term Means
- Cost and ROI Calculator for IoT Sensor Deployment
- Implementation: What to Check Before You Buy
- Satellite Data as a Complement to Ground IoT
- Frequently Asked Questions
- Where This Is Headed
- Try it: Enter values above to calculate.
US Agriculture IoT Market Size and Growth
Two market research firms track this space with different scopes, and both are useful. IMARC Group sizes the US precision farming software market specifically at $1,315.4 million in 2025, growing at 8.7% CAGR to a projected $2,357.8 million by 2030. Market Research Future sizes the broader US agricultural IoT hardware-and-software market at $2,940.97 million in 2025, projecting 10.9% CAGR to $8,340 million by 2035. The gap between the two figures reflects scope — software platforms versus the full IoT device-and-connectivity stack — not disagreement. If you’re evaluating vendors, ask which of these two markets they’re quoting from; a “market leader” claim measured against a $1.3 billion software category means something different than one measured against a $2.9 billion device category.
Both firms publish quarterly or annual updates. For a current figure, check IMARC Group’s US precision farming software market page directly, or Market Research Future’s US IoT agriculture market report, rather than relying on a number that will be a year or more old by the time you read this.
US precision farming software: $1,315.4M (2025) → $2,357.8M (2030 projected), 8.7% CAGR — IMARC Group.
US agricultural IoT (devices + software): $2,940.97M (2025) → $8,340M (2035 projected), 10.9% CAGR — Market Research Future.

Watch: a walkthrough of how sensor networks, connectivity, and dashboard software combine into a working precision-agriculture stack.
How Can IoT Help in Agriculture: The Mechanisms
“How can IoT help in agriculture” has a specific, evidence-backed answer with four mechanisms, each tied to a measured outcome rather than a general claim.
1. Irrigation Timing
Smart irrigation systems that combine soil-moisture sensors with automated valve controllers have shown a 25% increase in crop productivity in 2024–2025 industry research. Separately, optimized soil-moisture management has been shown to cut water consumption by 10–30%, per a Sensoterra/USDA analysis of North American operations. The mechanism is straightforward: instead of irrigating on a fixed calendar, the controller opens a valve when a probe reads below a set moisture threshold and closes it once the root zone is recharged, so water is applied to actual plant demand rather than a schedule.
2. Yield Gains From Precision Technologies Generally
Academic research covering the 2024–2025 period found precision agriculture technologies — spanning variable-rate application, GPS-guided equipment, and sensor-driven decision support — can lift yields by up to 30% in the highest-performing deployments, per a study published in the Springer journal cited below. That is a ceiling figure from favorable conditions, not a typical result; treat it as the upper bound of what’s been documented rather than an expected outcome for any given farm.
3. Soil Sensors and Weather Monitoring in Row Crops
A Midwest US industry case study found corn yield increases of 15% attributable specifically to IoT soil sensors combined with weather monitoring — a narrower, more specific claim than the general precision-agriculture figure above, and one worth citing separately because it isolates the sensor-plus-weather-data combination rather than bundling in equipment automation.
4. Cost Per Sensor and Payback Period
A multi-parameter soil sensor node averages $70 per unit in 2025 industry pricing data. Over a five-year deployment, US farm operations research found IoT sensor deployment returns 180–320% ROI — meaning a sensor network that costs $70 per node can return $1.80–$3.20 for every dollar spent by year five, once water savings, yield gains, and labor reduction are counted together.
Match the sensor to the mechanism you’re paying for. A soil-moisture probe pays back through water savings; a weather station plus soil sensor pays back through the yield gain documented in row-crop case studies. Buying a bundle without knowing which mechanism you’re targeting is how ROI projections miss.
Comparison Table: Agriculture IoT Device Categories
Market reports aggregate “agricultural IoT” as one category, but US farms deploy several distinct device types with different cost profiles and functions. This breakdown is not itemized in the published market-sizing reports — the gap is real and noted here rather than papered over — but the categories below reflect what’s actually sold and installed, drawing on the per-node pricing and mechanism data above.
| Device Category | Primary Function | Typical Cost Basis | Documented Impact | Connectivity Need |
|---|---|---|---|---|
| Soil moisture / multi-parameter sensor | Root-zone moisture, temperature, salinity readings | ~$70 per node (2025 pricing) | 10–30% water use reduction when paired with irrigation control | Cellular or LoRaWAN gateway |
| Automated irrigation controller | Valve/pivot control triggered by moisture threshold | Varies by field size and valve count | 25% crop productivity increase (smart irrigation systems) | Cellular or Wi-Fi |
| Weather station (field-level) | Temperature, humidity, rainfall, wind at field scale | Varies by sensor package | Contributes to the 15% Midwest corn yield gain when combined with soil sensors | Cellular data plan |
| GPS-guided equipment / variable-rate controllers | Automated seeding, spraying, fertilizing at variable rates | Typically equipment-integrated, not sold standalone | Contributes to the up-to-30% precision-ag yield ceiling | GPS + cellular for data logging |
For sensor and mounting hardware that secures these devices to center-pivot arms, equipment frames, or field posts — the physical fixtures rather than the electronics — see the agriculture IoT device workholding modules page, which covers that mounting-hardware category specifically.
Adoption Rates by US Region
Adoption is uneven, and the unevenness is itself the useful data point. USDA NASS’s most recent Technology Use Survey, released August 2025 and analyzed by the Agricultural and Food Policy Center at Texas A&M (AFPC/TAMU), found 74% of Nebraska farms carry a cellular data plan — the basic connectivity prerequisite for any IoT device. But precision agriculture technology adoption in Southern US states sits at only 12–22%, and nationally, precision agriculture technology adoption fell 19% between 2023 and 2025.
That decline matters more than any single adoption-rate snapshot: it means the market-size growth documented above (8.7–10.9% CAGR) is not being driven by broad-based farmer adoption climbing steadily. It’s consistent with consolidation — fewer, larger operations investing more per farm — or with early adopters expanding their existing systems while the median farm holds back. The next USDA NASS Technology Use Survey is expected in August 2027; state-by-state breakdowns are published at the USDA NASS Agricultural Surveys section under “Technology Use,” and the Southern-states detail specifically is at the AFPC/TAMU technology adoption survey page. Check both before citing an adoption number as current — a 19% two-year decline is exactly the kind of trend that can reverse or accelerate by the next survey cycle.
A 74% cellular connectivity rate in Nebraska means the infrastructure prerequisite is largely solved there. A 12–22% adoption rate in the South means the bottleneck for most Southern farms isn’t connectivity — it’s the device and software layer on top of it. Diagnose which constraint applies to your operation before assuming the fix is “more sensors.”
Agriculture Workholding Devices: What the Term Means
Searches for “agriculture workholding devices” and “agriculture industry workholding devices” bring readers here from a narrower, more mechanical angle than general IoT adoption. In manufacturing, a workholding device is any clamp, vise, fixture, or mount that holds a workpiece steady during a machining or processing operation. Applied to agriculture, the term covers the physical clamps, grippers, and mounting fixtures that hold produce, seedlings, or sensor hardware in place during automated harvesting, sorting, and processing — and, increasingly, the fixtures that mount IoT sensors themselves to equipment and field infrastructure.
This is a narrow, largely mechanical-engineering category, and it is not itemized separately in USDA NASS technology surveys or in either of the market-sizing reports cited above — those reports track precision-agriculture software and IoT device categories as a whole, not the sub-category of mounting hardware. If you’re evaluating a specific workholding product line — a modular clamp system, a sensor-mounting plate, an automated gripper for a sorting line — the closest published detail on that specific category is on Farmonaut’s own agriculture IoT device workholding modules page, which walks through device types, use cases, and implementation considerations for that hardware layer specifically.
The connection to the broader IoT market above is direct: workholding fixtures are what let a sensor survive vibration, weather, and repeated equipment cycles in the field. A $70 soil-moisture node is only as reliable as the mount holding it in place through a growing season of wind, dust, and machinery passes — so the mounting hardware, while a small line item, determines whether the sensor data above actually gets collected consistently.




Watch: how sensor mounting and field automation come together on working farm equipment.
Cost and ROI Calculator for IoT Sensor Deployment
Use the figures above — $70 per sensor node and 180–320% five-year ROI — to model your own deployment size below. Enter your field count, sensor cost, and the low or high end of the documented ROI range to see a five-year return estimate.
Enter values above to calculate.
Assumptions: uses the 180–320% five-year ROI range from US farm operations research on IoT sensor deployment and the $70/node 2025 average pricing figure cited above. Excludes financing costs, subscription/software fees beyond the one-time gateway cost, and site-specific factors like crop type, field terrain, or existing connectivity infrastructure. Treat the output as a planning estimate, not a guarantee.
Implementation: What to Check Before You Buy
Three checks, in order, before committing budget to an IoT deployment.
1. Connectivity First
Before buying sensors, confirm cellular or Wi-Fi coverage across the actual field footprint, not just the farmstead. The 74% Nebraska cellular-plan figure above is a state average; a specific field can sit in a dead zone even where the county average looks solid. A sensor with no signal path is a $70 paperweight.
2. Match the Device to the Documented Mechanism
Don't buy a bundled "smart farm" package without knowing which of the four mechanisms above it targets. A soil-moisture-plus-irrigation-controller pair is the combination behind the 25% productivity and 10–30% water-savings figures. A weather station alone, without a paired soil sensor, isn't the combination that produced the 15% Midwest corn yield case study.
3. Budget for the Full Five-Year Window, Not Year One
The 180–320% ROI figure is a five-year cumulative return, not a first-year payback. If your budgeting model assumes the sensor network pays for itself in season one, it will look like a bad investment even when it's performing exactly as documented.
If your IoT deployment includes equipment-mounted sensors — variable-rate controllers, GPS units — track their maintenance alongside vehicle service schedules using Farmonaut's Fleet Management tools, so a failed sensor mount gets caught at the same service interval as the equipment it's bolted to.

See it running: a walkthrough of field monitoring, sensor data, and dashboard integration in one system.
Satellite Data as a Complement to Ground IoT
Ground-based IoT sensors measure a point — wherever the probe or station physically sits. Satellite monitoring measures the whole field, which is why the two are complementary rather than competing approaches. Farmonaut's satellite tools extend the picture that ground sensors start:
- 🌐 Satellite-based field monitoring: NDVI and soil moisture visualization across the full field extent, catching variation between where your ground sensors happen to be placed.
- 🤖 JEEVN AI Advisory: Combines satellite and IoT sensor data into planting, irrigation, and harvest-timing recommendations.
- 🔗 Blockchain Traceability: Logs sensor and handling data into a verifiable chain-of-custody record — see the product traceability page.
- 🚜 Fleet & Resource Management: Unifies vehicle and IoT device oversight — see fleet management.
- 🌳 Carbon and sustainability tracking: See carbon footprinting tools.

Large-scale operators: pair IoT ground-truth data with satellite oversight via the large-scale farm management solution to manage sensor networks across thousands of acres without a proportional increase in field visits.
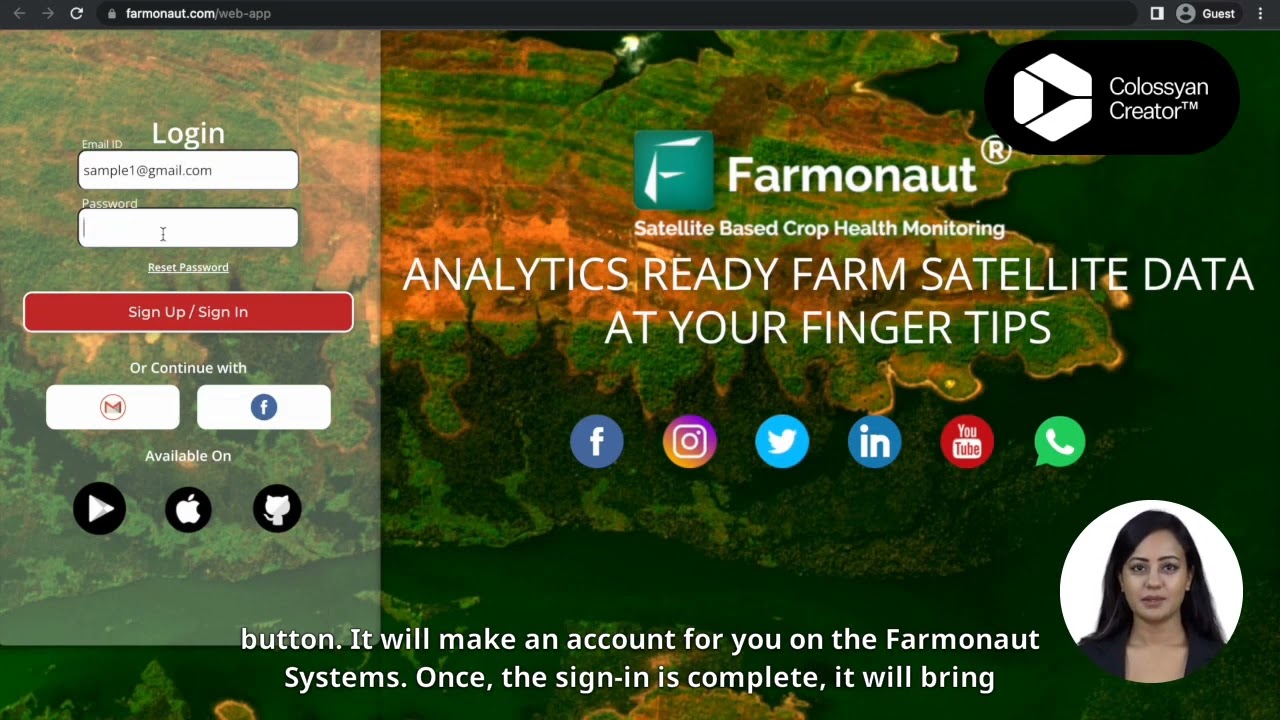
Developers: the Farmonaut API and API developer docs let you pull satellite weather and field data into the same dashboard as your IoT sensor feeds, rather than running two disconnected systems.

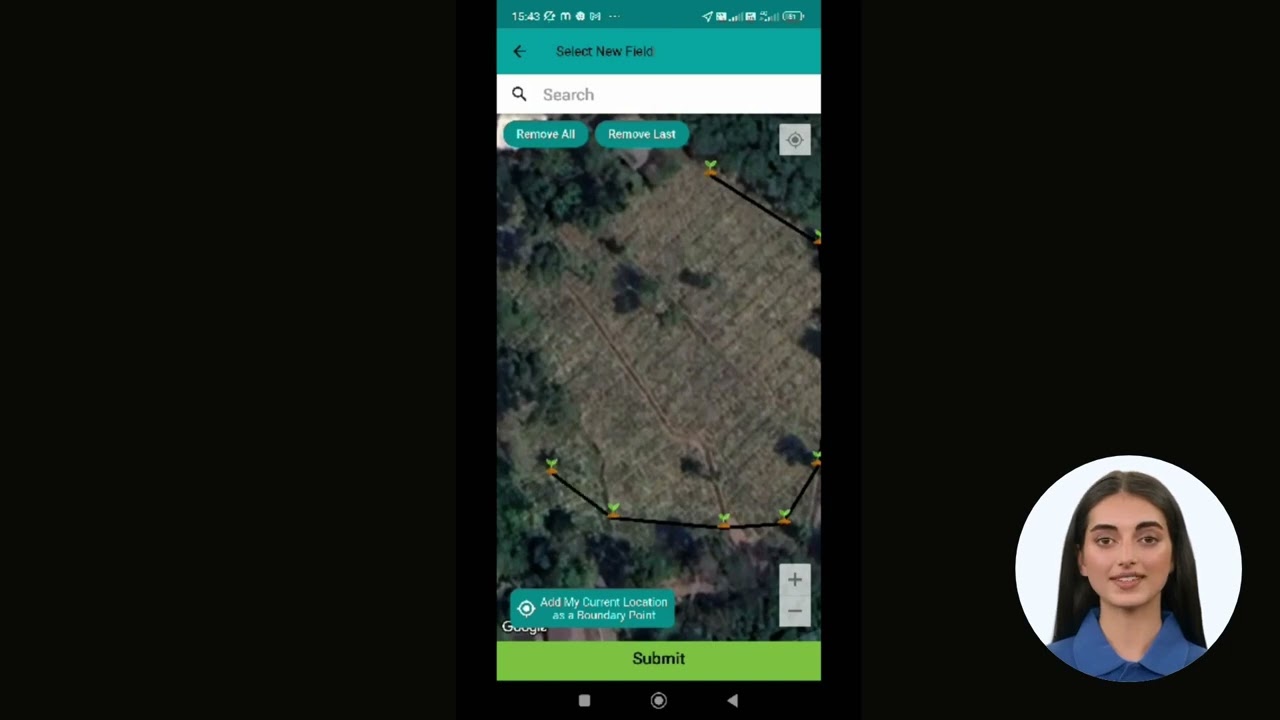
Mobile-first operations: map sensor locations and field boundaries from a phone via the Farmonaut app, keeping the physical device layer and the digital dashboard in sync.

Did you know? Satellite-based alerts can flag a field-wide anomaly — drought stress, pest pressure — days before a sparse ground-sensor network would catch it, simply because the sensors aren't physically present at the point of onset.
Frequently Asked Questions
1. What are agriculture IoT devices?
Internet-connected hardware — soil sensors, irrigation controllers, weather stations, GPS-guided equipment — that collect field data and transmit it to a dashboard or app for remote monitoring and automated response. The US market for these devices was valued at $2,940.97 million in 2025, per Market Research Future.
2. How can IoT help in agriculture specifically?
Four documented mechanisms: smart irrigation systems tied to soil-moisture sensors lift crop productivity by 25%; precision agriculture technologies broadly can lift yields up to 30% in top-performing deployments; IoT soil sensors combined with weather monitoring produced a 15% corn yield increase in a Midwest US case study; and optimized soil-moisture management cuts water consumption 10–30%.
3. What do agriculture workholding devices mean, and are they the same as IoT sensors?
No — workholding devices are the physical clamps, mounts, and fixtures that hold produce or sensor hardware in place during processing or field deployment, not the sensors themselves. See the dedicated workholding modules page for that hardware category specifically.
4. What does a basic IoT sensor deployment cost?
A multi-parameter soil sensor node averages $70 per unit in 2025 industry pricing data. Full deployment cost also depends on gateway/connectivity hardware and any software subscription, which aren't itemized in the aggregate market reports — request an itemized quote from your vendor rather than assuming a flat per-acre cost.
5. What's the actual return on investment?
US farm operations research documents 180–320% ROI over a five-year deployment window, once water savings, yield gains, and labor reduction are factored together. That's a five-year cumulative figure, not a first-season payback.
6. Why is adoption still low in some US regions?
USDA NASS/AFPC data shows precision agriculture adoption in Southern US states at just 12–22%, against a national adoption trend that fell 19% between 2023 and 2025. Connectivity isn't the main bottleneck in high-cellular-coverage states like Nebraska (74% of farms with a data plan); the gap is more likely device cost, integration complexity, or unclear ROI at the farm level.
Where This Is Headed
The US agricultural IoT market is on a growth trajectory — from $2,940.97 million in 2025 toward a projected $8,340 million by 2035, per Market Research Future — but that growth is not evenly distributed across farms. National precision-agriculture adoption fell 19% between 2023 and 2025 even as market value climbed, which points to concentration: fewer farms deploying more hardware, rather than broad uptake. The durable way to evaluate any specific IoT purchase is the same three-step check used throughout this piece — confirm connectivity for your actual field footprint, match the device to a documented mechanism (irrigation-linked moisture sensing, or sensor-plus-weather-data combinations) rather than a bundled marketing package, and budget against the five-year ROI window rather than a single season.
For the workholding and mounting-hardware side of this equation specifically, the agriculture IoT device workholding modules page covers device types and implementation details for that category. For the broader satellite-plus-IoT stack, explore Farmonaut's apps and API.
Evaluating a deployment?
Run your numbers through the calculator above, check current adoption data at USDA NASS and AFPC/TAMU before you buy, and pair ground sensors with satellite field monitoring for coverage a point sensor can't provide alone.
Discussion
Questions, corrections or field experience? Share them below. First-time comments are reviewed before they appear, and your email is never published.
No comments yet. Be the first to add a question or your experience.

 MapMyCrop
 Cresol
 Atur Kuliner
 MDCV UK
 Zerella Group
 Etech Consulting Madagascar
 Vestlandsforsking
 Agritein
 Delicio
 WB Dev
 Sama Premium
 Prochecker
 Tres Valles
 LACOS Geoinformation
 Magrifly
 LatConnect 60
 Blickwinkel
 Agricultural Credit Policy Council
 Marei Nursery
 eKGIS
eKGIS Mostas Tech
 Exploration consultancy · South Africa · Gold
 Licence holder · Niger · Gold
 Licence holder · Nigeria · Gold + lithium










