

Reviewed September 2026 against USDA Economic Research Service, RBC Thought Leadership, and IMARC Group.
Try it: Run your own numbers →
Global AI greenhouse climate control market: $1.2 billion in 2025 (HTF Market Intelligence). US agriculture emitted 663.6 million metric tonnes of greenhouse gases in 2022 — 10.5% of total US emissions (USDA ERS).
Introduction: What AI Greenhouse Monitoring Actually Does
An AI greenhouse uses networked sensors, machine learning, and automated controls to hold temperature, humidity, CO2, and moisture inside tight bands without constant manual adjustment. AI greenhouse monitoring is the sensing-and-analytics layer that makes this possible: cameras and sensors feed data to software that flags stress, predicts pest pressure, and triggers climate or irrigation changes before a human would notice the problem. The payoff growers care about is not the AI itself — it’s fewer wasted inputs, steadier yield, and a lower energy bill on the heating and cooling side.
This matters more in North America than the “smart farming” hype suggests. US agriculture produced 663.6 million metric tonnes of greenhouse gas emissions in 2022, 10.5% of the country’s total, according to the USDA Economic Research Service. Canada’s greenhouse sector alone spent $406 million on energy in 2023 (RBC Thought Leadership) — heating and cooling protected structures is one of the largest controllable cost and emissions line items a greenhouse operator has. AI-driven climate control is aimed directly at that line item.



AI Greenhouse Market Size: The Real Numbers
Before the how-it-works detail, the scale: the global AI greenhouse climate control market was valued at $1.2 billion in 2025, per HTF Market Intelligence. The broader smart greenhouse category (which includes AI plus non-AI automation) was valued at $2.2 billion in 2025 and is projected to reach $4.3 billion by 2034, according to IMARC Group — that is a forecast for the 2025–2034 period, not a guaranteed outcome, so treat it as directional rather than a number to plan a single year’s budget around.
In Canada specifically, greenhouse growers produced a farm gate value of $2.5 billion in 2023, exported $1.4 billion of fresh produce, and grew roughly 800,000 tonnes of tomatoes, cucumbers, peppers, lettuce, and strawberries — all per RBC Thought Leadership‘s 2023 data. On the adoption side, 19.2% of Canadian businesses reported using AI for production or service delivery as of Q3 2026, per Statistics Canada — that figure covers all business sectors, not greenhouses specifically, so it’s a ceiling indicator for how fast AI tools are spreading through the economy this technology sits in, not a greenhouse-specific adoption rate.
Gap in the published data: no source we found breaks out what share of North American greenhouse operations specifically run AI monitoring today. If you need that number for a business case, the practical route is a direct survey of your regional greenhouse growers’ association (in Canada, provincial associations tracked under the Canadian greenhouse census; in the US, check state greenhouse/nursery associations) rather than a national aggregate, since adoption is uneven by crop type and operation size.

AI Greenhouse: How the Systems Work
An AI greenhouse combines controlled environment agriculture (CEA) with machine learning to tailor growing conditions to each crop stage. Sensors track temperature, humidity, CO2 concentration, light intensity, and soil or substrate moisture continuously; software compares live readings against the ideal range for that crop and growth stage, then adjusts vents, heaters, chillers, irrigation valves, and supplemental lighting automatically.
The Core Components
- Networked sensors and IoT devices reporting temperature, humidity, CO2, and moisture in real time.
- Machine learning models that learn the optimal range for each crop stage — germination, vegetative growth, flowering, fruiting — and flag deviations.
- Computer vision cameras that scan for early signs of pest activity or disease on leaf surfaces, before visible spread.
- Automated actuators tied to climate control, irrigation, and nutrient dosing systems that respond to the model’s output without a human in the loop for routine adjustments.
- Cloud analytics platforms that log historical data so growers can compare this season’s climate curve to prior seasons.
The multiple cropping angle matters for the emissions math too: a controlled environment can support two to three harvests per year on the same footprint, which reduces the pressure to bring new land into production — one of the few emissions levers that isn’t about energy at all.

AI Smart Automation in Controlled Environment Farming
Break the automation down by function and the emissions/cost link becomes clearer:
- Climate control: software holds temperature, humidity, CO2, and air quality inside crop-specific bands, since small fluctuations affect growth rate and yield consistency.
- Precision irrigation: soil and substrate moisture sensors drive watering schedules so crops get water on a need basis, not a fixed timer.
- Nutrient dosing: algorithms track plant nutrient status and dose fertilizer accordingly, cutting the over-application that drives nitrous oxide emissions and runoff.
- Pest and disease detection: camera-based pattern recognition catches outbreaks early, often allowing a non-chemical response first — trapping, biological control, localized treatment — before broad-spectrum pesticide use.
- Continuous analytics: season-over-season data comparison gives growers a factual basis for adjusting practice, rather than relying on memory or guesswork.

Two results of this automation are directly measurable for a grower’s own operation: chemical input volume (compare season-over-season pesticide/fungicide purchase records) and energy draw (compare utility bills against degree-days for the same period). Neither figure is published as a universal average because both depend on crop, structure design, and local climate — but both are numbers you already have in your own records and can trend over time.
Advanced AC for Greenhouse Climate Control
Horticultural AC differs from standard commercial air conditioning in a few specific ways. AI-enhanced systems hold temperature within tight bands — for example, roughly 22–28°C for tomatoes — because that crop’s yield and fruit set are sensitive to swings outside that range. They also modulate humidity and CO2 based on live sensor feedback rather than a fixed schedule, and the better-designed systems run only when the model’s data actually calls for a cycle, rather than on a timer.
Where the Energy Savings Actually Come From
- Renewable integration: solar or biogas power for heating/cooling cycles reduces the fossil-fuel share of the energy bill directly — this is the same $406 million Canadian greenhouse energy cost figure (RBC, 2023) that AI-driven scheduling and renewable sourcing both attack from different angles.
- Demand-based cycling: heating and cooling triggered by sensor thresholds instead of a timer avoids running equipment when the greenhouse doesn’t need it.
- Variable refrigerant flow (VRF) units and improved insulation reduce the total heating/cooling load the system has to meet in the first place.
- Low-GWP refrigerants in newer AC units cut the direct climate impact of refrigerant leakage, independent of energy source.

What isn’t published: a greenhouse-specific figure isolating AI climate control’s energy savings from general HVAC automation’s savings. Published data covers general commercial building HVAC AI, not greenhouse structures specifically — greenhouses have different heat-loss profiles (more glazing, less insulation) so applying a building figure to a greenhouse would overstate or understate the real number. Until a greenhouse-specific study exists, the reliable method is a before/after comparison of your own utility bills, normalized against heating/cooling degree-days for the same period, run over at least one full season.

Rooftop Greenhouses and AI Monitoring
Rooftop and urban greenhouses are a specific subset of controlled environment agriculture, built on building rooftops to shorten the distance between production and consumption in dense cities. The green roof and rooftop greenhouse category is growing at 36% annually in North America over the 2025–2029 window, according to Technavio — that’s a forecast growth rate for a five-year window, not a single-year snapshot, and it covers green roofs broadly, not rooftop greenhouses in isolation.
The AI monitoring layer works the same way on a rooftop structure as on a ground-level greenhouse: sensors and automated climate control, sized to the smaller footprint typical of rooftop installations. Rooftop sites carry two structural differences worth knowing before you plan one: wind exposure is higher (affecting heat loss and structural load calculations), and rooftop weight limits constrain how much substrate, water storage, and equipment the structure can carry — both are engineering questions for a structural assessment, not something AI climate control changes.
What isn’t published: no source in our research separates US rooftop/urban greenhouse production volume or emissions figures from field agriculture nationally. If you’re evaluating a rooftop project, your city’s building department or a regional urban agriculture association is the more useful source for permitting and structural precedent than a national aggregate, since rooftop rules are set locally.
Cutting Agriculture Greenhouse Gas Emissions
US agriculture emitted 663.6 million metric tonnes of greenhouse gases in 2022, 10.5% of the country’s total emissions, according to the USDA Economic Research Service. Greenhouse operations are one slice of that total, and AI-driven controls attack it through several specific mechanisms:
- Reduced fertilizer over-application: nutrient dosing tied to actual plant uptake, rather than a flat schedule, lowers nitrous oxide emissions and runoff.
- Reduced energy waste: demand-based climate cycling avoids heating or cooling when sensors show no need.
- Fewer chemical treatments: earlier pest/disease detection via camera-based recognition allows targeted, non-chemical first response.
- Renewable energy sourcing: solar or biogas-powered HVAC cuts the fossil fuel share of the $406 million Canadian greenhouse energy bill (RBC, 2023) and its US equivalent.
- Higher yield per footprint: more harvests per year on the same land reduces pressure to convert new land to agricultural use.
- Shorter supply chains: greenhouses sited near urban centers cut transport-related emissions compared to shipping produce long distances.
Gap in the published data: no source breaks the Canadian greenhouse sector’s emissions into the natural gas versus grid electricity share. That split matters because AI climate control saves energy on both fuel types but the emissions-per-dollar-saved differs sharply depending on your local electricity grid mix — check your provincial or state utility’s published emissions factor to convert your own energy savings into a CO2 figure specific to your site.

Comparison Table: AI Greenhouse, AC, and Traditional Farming
| System Type | Typical Setup | Climate Control Basis | Primary Emissions Lever | Data You Can Verify Yourself |
|---|---|---|---|---|
| Traditional Greenhouse | Manual vents, fixed timers | Scheduled, not sensor-driven | None systematic | Utility bills only |
| AI-Powered Greenhouse | Sensors + ML climate/irrigation control | Sensor-triggered, crop-stage aware | Reduced fertilizer/water waste | Utility bills + input purchase records, season over season |
| AI + Advanced AC System | AI control + VRF/renewable-integrated AC | Sensor-triggered + demand-based cycling | Energy + refrigerant GWP + input waste | Utility bills normalized to degree-days, refrigerant type on equipment spec sheet |
Use the rightmost column to build your own before/after case: none of these figures require a third-party study — they come from records you already hold.
Calculator: Greenhouse Climate-Control Energy Savings
Estimate the annual energy-cost impact of switching a greenhouse zone to demand-based AI climate control, using your own energy bill and structure size as inputs.
Run your own numbers
Assumptions: savings rate options are drawn from the operational ranges discussed in this article (demand-based cycling through combined AI+AC systems), not a guarantee for any specific site. Excludes installation labor, financing costs, crop-specific yield changes, and maintenance. Enter your own utility bill and quoted system cost for a site-specific estimate.
Farmonaut’s Role: Satellite Data for Greenhouse Operators
Satellite-based monitoring complements in-greenhouse AI sensors by tracking conditions outside the structure — regional weather risk, water availability, and surrounding field health — that affect a greenhouse operation’s broader supply chain and sourcing decisions.
- Satellite-based monitoring: real-time insight into vegetation indices (NDVI), soil health, and climate stress for any agricultural area, including land supplying or surrounding a greenhouse operation.
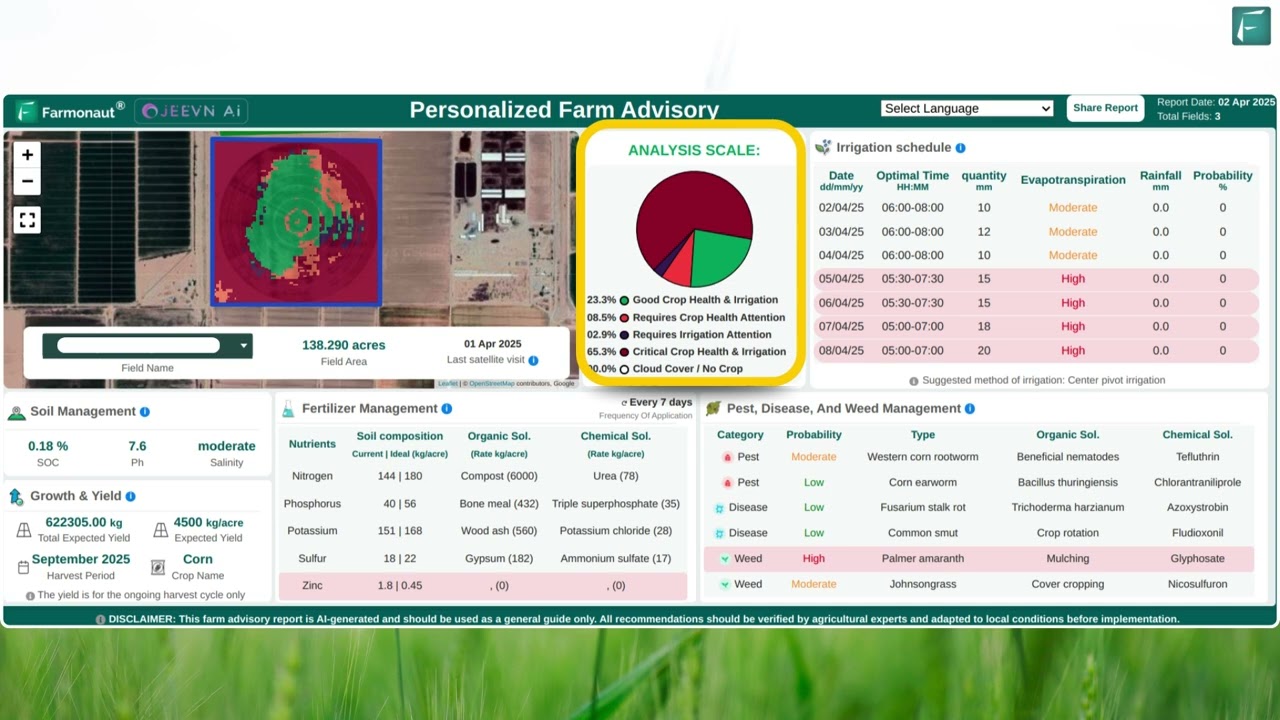
- AI-driven advisory: Farmonaut’s Jeevn AI combines satellite and on-ground data into specific irrigation, nutrient, and pest recommendations.
- Blockchain traceability: crop-to-market transparency for verifying food origin and handling.
- Fleet and resource management: logistics coordination for operators running multiple greenhouse sites or delivery routes.
- Environmental impact tracking: ongoing carbon footprint monitoring at the farm or crop level.
Advanced farm management and AI-advisory tools with Farmonaut’s Large Scale Farm Management platform.
Get crop, plantation, and forest health advisories from Farmonaut for efficient land and resource stewardship.
Farmonaut Subscription Plans
Watch: AI and Precision Farming
Two more looks at AI-integrated greenhouses and precision farming in practice:


FAQ
What is an AI greenhouse?
A controlled-environment structure that uses sensors, machine learning, and automated controls to manage climate, irrigation, nutrient delivery, and pest detection with minimal manual intervention.
What does AI greenhouse monitoring track, specifically?
Temperature, humidity, CO2 concentration, light intensity, soil or substrate moisture, and — via camera-based computer vision — early visual signs of pest or disease activity on the crop.
How big is the AI greenhouse market?
The global AI greenhouse climate control market was valued at $1.2 billion in 2025 (HTF Market Intelligence). The broader smart greenhouse market, $2.2 billion in 2025, is projected to reach $4.3 billion by 2034 (IMARC Group) — check both sources directly for updated figures, since market-size reports are republished annually.
Does an AI greenhouse reduce agriculture greenhouse gas emissions?
It attacks specific emissions sources: over-fertilization (via precision dosing), energy waste (via demand-based climate cycling), and chemical treatment volume (via early pest detection). US agriculture emitted 663.6 million metric tonnes of GHGs in 2022, 10.5% of the national total (USDA ERS) — no published figure isolates the greenhouse sub-sector’s share or an AI-specific reduction percentage; the reliable method is a season-over-season comparison of your own energy and input records.
Are rooftop greenhouses a good fit for AI monitoring?
The same sensor and automation approach applies at rooftop scale. Green roofs and rooftop greenhouses are growing at 36% annually in North America over 2025–2029 (Technavio), reflecting rising urban-agriculture interest — but rooftop sites carry structural load limits and higher wind exposure that a ground-level greenhouse doesn’t, so a structural engineering assessment should precede any equipment purchase.
How do Farmonaut’s tools fit into greenhouse operations?
Farmonaut provides satellite imagery, AI advisory (Jeevn AI), and blockchain traceability as a complement to in-greenhouse sensor systems — useful for operators managing land or supply chains beyond the greenhouse structure itself.
What’s the typical payback period for an AI monitoring system?
Not published as a general figure — it depends on your energy cost baseline, system price, and achieved savings rate. Use the calculator above with your own utility bill and quoted equipment cost to get a site-specific estimate.







Conclusion
AI greenhouse monitoring is a real, quantifiable market — $1.2 billion globally in 2025 for climate control specifically, per HTF Market Intelligence — built on a straightforward mechanism: sensors plus machine learning replacing fixed schedules with demand-based control. The emissions and cost case rests on real numbers too: US agriculture’s 663.6 million tonnes of GHG emissions in 2022 (USDA ERS) and Canada’s $406 million greenhouse energy bill in 2023 (RBC) are the baselines any efficiency claim has to be measured against.
What isn’t yet published — North American AI adoption rates specific to greenhouses, isolated AI-vs-general-HVAC energy savings, and a standard payback period — are gaps worth naming rather than papering over. The durable approach for any operator: track your own energy bills against degree-days, your own input purchases season over season, and check the cited sources directly for updated figures, since market and emissions data are republished on regular cycles (Statistics Canada Table 32-10-0011 annually in Q2; IMARC/HTF market forecasts expected Q4 2026).

 BayWa
BayWa Azure Clouds
 MCSOD
MCSOD Marei Nursery
 eKGIS
eKGIS Mostas Tech
 Native Seeds
 Andex
Andex FCF India
 Unifrutti Gulf
 Deluxe Conseil
 TVS Electronics
 WICO
WICO Chimera Innovation
 SkyHarvest
