

Advantages of Precision Agriculture: Data on Yield, Cost, Water
Reviewed September 2026 against USDA Economic Research Service, USDA Agricultural Research Service, and Eurostat data.
Try it: Run your own numbers →
The single biggest advantage of precision agriculture is measurable: US farms using guidance autosteering, variable-rate inputs, and satellite crop monitoring see roughly a 5% annual gain in crop production, an 8% cut in fertilizer use, and 147 million gallons of fuel saved nationally each year, according to the USDA Agricultural Research Service and the Association of Equipment Manufacturers (AEM). Disadvantages exist too — upfront technology cost and a learning curve are the main ones cited in adoption surveys — but on the numbers below, the advantages outweigh them for most farm sizes already using guidance systems.
This article works through what “precision agriculture” actually buys a farm, in dollars, gallons, and tons, rather than in adjectives. It covers row-crop and horticultural operations, including citrus, and closes with a calculator you can run against your own acreage.
Table of Contents
- Advantages of Precision Agriculture, Ranked by Evidence
- How Many US Farms Actually Use It
- Yield per Hectare: What Precision Data Changes
- Precision Horticulture: Citrus as a Case Study
- Advantages and Disadvantages of Sustainable Agriculture
- How EU Adoption Compares
- The Technology Stack Behind These Numbers
- Calculator: Your Farm’s Precision Agriculture Savings
- FAQ
- Try it: Run your own numbers
Advantages of Precision Agriculture, Ranked by Evidence
Most lists of “precision agriculture advantages” are generic — better decisions, less waste, higher yield. Here is what the USDA and AEM data actually attributes to precision agriculture adoption, ranked by how well-documented the number is:
| Advantage | Documented Figure | Period | Source |
|---|---|---|---|
| Crop production increase | 5% annual increase attributable to precision ag | 2024-2025 | AEM / USDA |
| Corn yield growth contribution | 1.4% compound annual growth rate | 18-year period | AEM / USDA |
| Fertilizer use reduction | 8% reduction | 2024-2025 | USDA/ARS |
| Fuel savings, nationwide | 147 million gallons/year | 2024-2025 | USDA/ARS |
| Land spared from cultivation | 11.4 million acres | 2023 and later | AEM / USDA |
| Added revenue, 1,000-acre farm at 5% yield gain | $66,000/year | Current AEM estimate | AEM / USDA |
Read the full breakdown in AEM’s business case for precision agriculture, which is the source for the yield, revenue, and land-sparing figures above, and in USDA ARS’s summary of precision agriculture’s evolution and benefits, which documents the fertilizer and fuel figures. Both are worth reading directly because these percentages get rounded differently across secondary sources — go to the primary numbers before you plan a budget around them.
The disadvantages that show up consistently in adoption research are cost of entry (guidance hardware, subscription-based imagery, connectivity in low-signal fields) and the operator learning curve on midsize and small farms, which is part of why adoption still trails on smaller operations even though the technology itself is not new. Farmonaut’s own tools — farm data analytics delivered through a subscription rather than owned hardware, and satellite imagery rather than farm-mounted sensors — are aimed specifically at lowering that entry cost, since the imagery itself requires no on-farm equipment purchase.
How Many US Farms Actually Use It
27% of US farms had adopted at least one precision agriculture practice as of the 2023 measurement, per the USDA Economic Research Service chart of note on precision agriculture adoption. That headline number understates how concentrated adoption is by farm size: 70% of large-scale farms used guidance autosteering systems in 2023, against 52% of midsize farms. Autosteering is the easiest precision practice to observe from equipment sales data, which is why USDA/NASS tracks it closely, but it is also usually the first precision technology a farm buys — satellite crop monitoring, variable-rate application, and soil-sensor networks tend to follow once autosteering is in place.
The US precision farming market was valued at $4.37 billion in 2025. That figure moves every year as adoption climbs and new categories (drone-based application, AI advisory layers) get counted, so treat it as a snapshot rather than a ceiling — the ERS chart of note above is updated periodically and is the right place to check the current figure rather than this article a year from now.
To get a fresher adoption number than the one printed here: USDA NASS QuickStats publishes a “Precision Ag” category at quickstats.nass.usda.gov, refreshed annually each September following harvest survey closure. That is the durable method — bookmark the query, not the number.
Yield per Hectare: What Precision Data Changes
“Yield per hectare” is the metric precision agriculture is built to move, and it is worth being precise about how it moves. The AEM/USDA analysis attributes a 1.4% compound annual growth rate in US corn yield over an 18-year period specifically to precision agriculture technologies — not to seed genetics, not to weather, isolated as the technology’s contribution. Compounded, a 1.4% CAGR is the difference between a yield curve that plateaus and one that keeps climbing after other gains (breeding, weather) flatten out.
The mechanism is straightforward: satellite-based NDVI monitoring and soil sensors flag under-performing zones inside a field before harvest, so nitrogen, water, and pest control get applied where the crop can use them instead of uniformly across the whole parcel. That is also what drives the 8% fertilizer reduction figure above — the reduction comes from not over-applying to zones that didn’t need it, not from cutting total nutrient supply to the crop.
On a per-hectare basis for a specific field, US growers should convert the national figures using their own baseline yield and acreage — a 5% production increase on a 200-bushel/acre corn field is a very different absolute number than the same percentage on a 140-bushel/acre field. The calculator further down this page does that conversion for you.
Precision Horticulture: Citrus as a Case Study
Precision horticulture — precision agriculture’s application to fruit, nut, and vine crops rather than row crops — is a smaller adoption category, and the USDA data available at the time of writing does not break out yields specifically attributable to precision technology for citrus the way it does for corn. What is published: US citrus utilized production came to 5.24 million tons in the 2023-24 season, valued at $2.98 billion, per USDA NASS’s citrus summary.
That is the production baseline against which any precision-horticulture gain has to be measured, and it is also the gap worth naming plainly: a direct comparison of precision-managed versus conventionally managed citrus yield on comparable acreage is not published in the sources reviewed for this article. If that comparison matters to your operation, the method to get it is to run your own paired-block trial — one block under variable-rate irrigation and canopy-level NDVI monitoring, one under your existing practice, same rootstock and planting year — for at least one full production cycle, since citrus bearing cycles run multi-year and a single season will not isolate the effect from normal year-to-year variation.
USDA NASS releases preliminary citrus forecasts monthly from July through April each season, with final estimates issued after harvest closes; the current season’s numbers are at NASS’s Florida citrus publications page. What precision tools do apply directly to citrus operations regardless of the yield-comparison gap: satellite-based canopy health monitoring for early detection of stress or disease across large groves, and irrigation scheduling tied to soil moisture and weather data rather than a fixed calendar — both covered in Farmonaut’s farm data analytics platform, and both mechanically identical to what drives the row-crop fertilizer and yield figures above.
Advantages and Disadvantages of Sustainable Agriculture
Precision agriculture and sustainable agriculture overlap but are not the same thing — precision agriculture is a set of measurement and application technologies; sustainable agriculture is a set of practices (crop rotation, reduced tillage, cover cropping, input minimization) that precision tools can support but don’t guarantee on their own. Here is the honest tradeoff, using the figures already established above:
| Advantages | Disadvantages |
|---|---|
| 8% lower fertilizer use nationally when paired with precision application (USDA/ARS) | Upfront cost of guidance/sensor hardware and imagery subscriptions is the most-cited adoption barrier |
| 147 million gallons/year in fuel savings from optimized field passes (USDA/ARS) | Requires reliable connectivity and a learning curve, which slows adoption on smaller/midsize farms (52% vs. 70% guidance-system use, USDA/NASS) |
| 11.4 million acres of US farmland spared from cultivation while maintaining output (AEM/USDA) | Yield and revenue gains take multiple seasons to compound — the 1.4% CAGR figure is measured over 18 years, not one |
| Reduced input costs compound with yield gains — AEM estimates $66,000 in added annual revenue on a 1,000-acre farm from a 5% yield increase | Data quality depends on consistent monitoring; a single season of imagery is not enough to establish a reliable baseline for a specific field |
The land-sparing figure deserves its own note: 11.4 million acres kept out of cultivation while total output held steady is a sustainability result in the strict sense — it means the same national production came from a smaller land footprint, which is the core claim behind precision agriculture’s environmental case, distinct from the input-reduction numbers above it.
How EU Adoption Compares
For readers benchmarking against Europe: 18% of EU farms reported using precision farming technologies in 2023, against 43% of EU farms with internet access — a gap that itself explains part of the adoption ceiling, since satellite-fed and cloud-based precision tools need connectivity to function. Denmark led national adoption at 40% of farms, well above the EU-wide figure, per Eurostat’s release on EU farm digitalization.
Set against the US figures above (27% overall adoption, 70% of large farms on guidance systems), the EU’s 18% overall rate is lower, but the connectivity gap suggests infrastructure — not farmer willingness — is the larger constraint in the EU dataset. Eurostat updates this release periodically as part of its farm structure survey series; check the URL above directly for the current wave rather than assuming 2023 figures still hold.
The Technology Stack Behind These Numbers
The adoption and savings figures above are produced by a specific stack of tools working together, not by any single device. Farmonaut’s platform covers each layer:
Satellite-Based Crop Health Monitoring
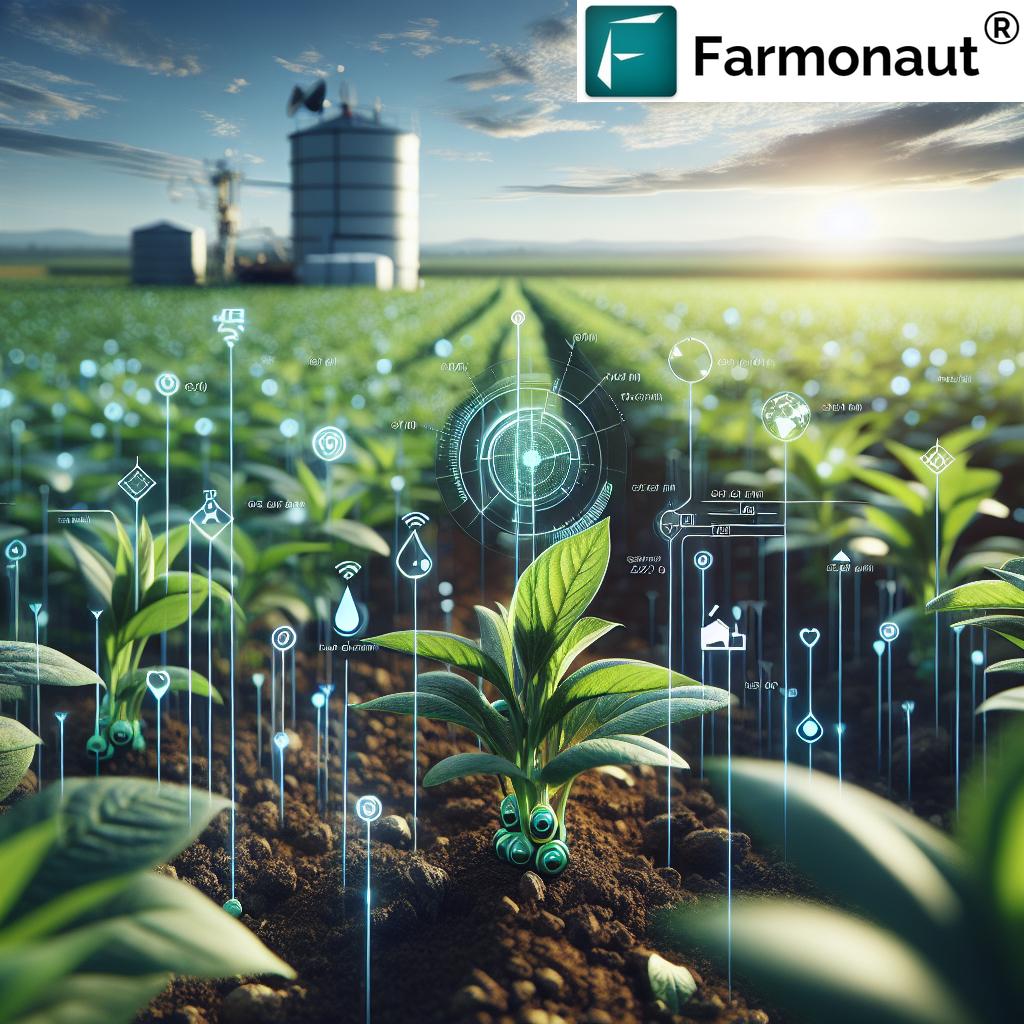
Multispectral satellite imagery tracks NDVI (vegetation health), soil moisture, crop stress indicators, and growth patterns without requiring on-farm sensor hardware. This is the layer that lets a grower catch an under-performing zone before it shows up in yield at harvest — the same mechanism behind the 1.4% corn-yield CAGR figure above.

AI-Driven Advisory Systems
Farmonaut’s Jeevn AI Advisory System combines satellite data, weather forecasts, and field history into pest and disease prediction, planting and harvest timing, and fertilizer and irrigation recommendations. This is the software layer that converts raw imagery into an action a farmer can take the same day.
Smart Irrigation Systems
Soil moisture data plus weather forecasting drives irrigation timing rather than a fixed calendar — the same approach discussed for citrus groves above, extended to any irrigated crop.
Soil Health Management
Nutrient level and soil composition data inform fertilizer application, crop rotation, and pH management — the direct input to the 8% fertilizer reduction figure cited earlier in this article.
Agricultural Drone Integration
Drones complement satellite data with high-resolution, on-demand imagery for detailed crop scouting, targeted spraying, and rapid storm-damage assessment — useful where satellite revisit frequency (every 3-5 days on most Farmonaut subscription tiers) isn’t tight enough for a fast-moving pest or disease event.
Hyperspectral Imaging
Beyond standard multispectral NDVI, hyperspectral satellite imagery resolves finer detail in crop and soil condition than standard multispectral bands, and is an active area of development for both crop-stress detection and soil composition mapping.
Digital Farming Tools and Farm Data Analytics
Interactive field mapping, a crop health dashboard, weather forecasting, task management, and reporting tools sit on top of the satellite and AI layers, covered in more depth in Farmonaut’s farm data analytics guide and digital farming tools overview. These are the tools referenced in the sustainable-agriculture practices covered in Farmonaut’s sustainable agriculture solutions article, and they apply across crop types including the cash and tree crops covered separately on the site.
Access the platform directly:



Developers integrating this data directly can use the API at https://sat.farmonaut.com/api, documented at https://farmonaut.com/farmonaut-satellite-weather-api-developer-docs/.
Calculator: Your Farm’s Precision Agriculture Savings
This tool applies the USDA/ARS and AEM figures above — 5% yield increase, 8% fertilizer reduction, 147 million gallons of fuel saved across an estimated 90 million guidance-equipped US acres (implying roughly 1.6 gallons/acre/year) — to your own acreage, crop price, and input costs, so you can see the dollar range rather than the national percentage.
Run your own numbers
Assumptions: applies the national average percentages from USDA/ARS and AEM/USDA (5% yield gain, 8% fertilizer reduction, ~1.6 gallons/acre/year fuel savings derived from ARS’s 147-million-gallon national total) directly to your inputs. It does not include equipment, subscription, or connectivity costs, and does not adjust for crop type, region, or existing precision-technology adoption already in place on your farm — those will change the real payback period.
FAQ
- Q: What is the single biggest advantage of precision agriculture?
A: By the USDA/ARS and AEM figures above, it’s the combination of a 5% annual production increase with an 8% fertilizer reduction — meaning the yield gain doesn’t come from spending more on inputs, it comes from applying the inputs a field already gets more precisely. - Q: What is precision horticulture, and how does it differ from precision agriculture generally?
A: Precision horticulture applies the same satellite monitoring, variable-rate input, and data-analytics tools to fruit, nut, and vine crops rather than row crops. The mechanics are the same; the crop cycles are longer (citrus bears over multiple years), so trial results take longer to confirm. - Q: What are the main disadvantages of precision agriculture?
A: Upfront cost of guidance and sensor equipment, connectivity requirements for cloud-based tools, and an operator learning curve — reflected in the adoption gap between large farms (70% on guidance systems) and midsize farms (52%) reported by USDA/NASS for 2023. - Q: How is “yield per hectare” affected by precision agriculture specifically?
A: The clearest documented figure is a 1.4% compound annual growth rate in US corn yield attributable to precision agriculture over an 18-year period (AEM/USDA) — isolated from other yield drivers like genetics and weather. - Q: How often is satellite crop data updated on Farmonaut’s platform?
A: Every 3-5 days for most locations and subscription tiers, supplemented by drone imagery where faster turnaround is needed. - Q: Can these tools be used for all crop types, including citrus and other tree crops?
A: Yes — satellite monitoring, irrigation scheduling, and the AI advisory system apply across grains, vegetables, and tree and cash crops, though a direct precision-vs-conventional yield comparison specific to citrus is not currently published and would need a farm-level trial, as covered above.
Frequently Requested: Subscription and Data Access
Farmonaut’s subscription tiers are listed below; API access for developers is at the links in the technology stack section above.
Watch: Precision Agriculture in Practice
The advantages of precision agriculture, on the numbers available, are concrete and specific to farm size and crop type rather than universal: large US farms are already near-saturated on guidance systems (70% adoption), midsize farms are catching up (52%), and the dollar value of adoption scales directly with acreage and current input spend — which is what the calculator above is for. Where a comparable figure doesn’t yet exist, as with citrus-specific precision yield data, the honest answer is to run the trial rather than accept a rounded estimate.

 Krishify
 TVS Electronics
 BW Pipelines
 WICO
WICO Gen Chayat
 Chimera Innovation
 SkyHarvest
 Polaris Digitech
 Teledarbas
 Wild Oak Farm
 SFX
SFX BACF Africa
 Doodlakine
 Exurbia Geospatial
 FieldZero
