

Reviewed August 2026 against USDA NASS, USDA ERS and NIST Handbook 130.
Try it: Scale ticket net-value calculator →
Crop Management Software: Pricing, Ticketing and Fit

Crop management software does four separate jobs — agronomic monitoring, field records, work orders, and ticketing — and almost no single product does all four well. The word “ticketing” alone means three unrelated things in agriculture: scale tickets for grain and produce loads, work-order tickets for crews and equipment, and admission tickets for farm attractions. Buying the wrong one is the most common and most expensive mistake in this category, so this page separates the three, explains what actually happened to Granular, and gives you arithmetic you can run against your own acres and loads.
The four jobs, and who already does them
Before comparing vendors, decide which of these you are actually buying:
- Agronomic monitoring — satellite or drone imagery, vegetation indices, soil moisture, weather.
- Field records and compliance — as-applied inputs, chemical logs, crop plans, audit trails.
- Work orders and dispatch — assigning tasks to operators, tracking completion, machinery hours.
- Ticketing and settlement — weights, moisture, loads, hauling, and what the buyer owes you.
Adoption of the underlying hardware is already high on larger US operations, which is why software gaps show up as record-keeping problems rather than data problems. USDA’s Economic Research Service reported that in 2023, guidance autosteering was used by 52% of midsize farms and 70% of large-scale crop-producing farms, while yield monitors, yield maps and soil maps were used on 68% of large-scale crop farms (USDA ERS, America’s Farms and Ranches at a Glance, December 2024). ERS report EIB-248 puts automated guidance at well over 50% of planted acreage across corn, cotton, rice, sorghum, soybeans and winter wheat, while mapping and variable-rate technologies reach only 5–25% of planted acreage for winter wheat, cotton, sorghum and rice (McFadden, Njuki and Griffin, USDA ERS, 22 February 2023).
What happened to Granular, and what “Granular farm management software” means now
If you searched for Granular, here is the state of that product line. Granular Inc. was acquired by DuPont Pioneer and became part of Corteva Agriscience. On 24 February 2020, Corteva launched Granular Insights as a free field-level profitability and imagery tool, describing it as “the only free tool connected to the leading Farm Management suite” and claiming it could remove roughly three weeks of annual data entry by pulling from John Deere Operations Center and other manufacturers (Corteva Agriscience press release, 24 February 2020).
Since then the portfolio has been split: Granular Business, the enterprise cost-accounting product, was divested to Traction Ag, and Granular Agronomy was discontinued. Granular Insights continued under Corteva. Because the line has been reorganised more than once, verify the live product status on Corteva’s own site before you shortlist it — a review-aggregator listing is not evidence a product is still sold.
Granular software pricing: the honest answer
Corteva has never published a public rate card for Granular Business, and per-acre figures circulating on software-comparison sites are not sourced to the vendor. Rather than repeat them, use this method to get a number you can trust:
- Ask every vendor to quote as $ per acre per year, all modules included, on your exact acreage.
- Ask separately for the annual minimum. Enterprise ag platforms commonly enforce one, and it dominates the effective per-acre cost below a few thousand acres.
- Ask what is metered — seats, fields, tickets, API calls, imagery refreshes.
- Divide the three-year total by your acres. That is your real price.
| Pricing model | How it is quoted | Where it breaks | Normalise it by |
|---|---|---|---|
| Per acre / year | Rate × enrolled acres | Rented ground churns; you pay for acres you lost | Asking for mid-term acre adjustment |
| Per seat / month | Rate × named users | Seasonal crews need 20 logins for 6 weeks | Requesting seasonal or read-only seats |
| Platform fee + modules | Base + per-module add-ons | Ticketing is almost always an add-on | Pricing the bundle you will use in year two |
| Per ticket / per load | Cents per weighed load | Harvest concentrates most loads into a few weeks | Quoting on peak-week volume, not average |
| Free tier + paid tiers | Free core, paid analytics | Export and API sit behind the paywall | Confirming data export is in the free tier |
The per-acre model is under pressure from consolidation. The 2022 Census of Agriculture counted 1.9 million US farms, down 7% from 2017, on 880 million acres, with average farm size up 5% to 463 acres; 105,384 farms with sales of $1 million or more made up 6% of farms but sold more than three-quarters of all agricultural products (USDA NASS, 13 February 2024).
Fewer, larger operations means the buyer of crop management software is increasingly an operation running its own logistics — which is where ticketing stops being optional. Market context for those inputs sits in our guide to agricultural commodities and the breakdown of agricultural products and residues.
Three different products are called “agriculture ticketing software”
| Type | Core record | Typical buyer | Regulatory anchor | Must integrate with |
|---|---|---|---|---|
| Scale / load ticketing (farm ticket software) | Gross, tare, net weight; moisture; grade | Grain, sugar beet, potato, forage haulers; elevators | State weighmaster law, modelled on NIST Handbook 130 §III.B | Weighbridge indicator, moisture tester, accounting, settlement |
| Work-order ticketing (agriculture ticket software) | Task, field, operator, status, hours | Row-crop managers, custom applicators, orchards | Pesticide application records (state lead agency) | Field boundaries, machinery telematics, payroll |
| Admission ticketing (farm attraction software) | Timed entry, wristband, capacity | Corn mazes, pumpkin patches, u-pick, agritourism | Sales tax, liability waivers, occupancy limits | Payments, POS, email/SMS, gate scanning |
Scale ticketing: what a ticket must legally contain
US weighing law is state law, but nearly every state’s version tracks the model statutes published by the National Conference on Weights and Measures. The Uniform Weighmaster Law is Section III.B of NIST Handbook 130, Uniform Laws and Regulations in the Areas of Legal Metrology and Fuel Quality; the edition adopted by the 109th NCWM is the 2026 edition (NIST Office of Weights and Measures). Handbook 130 is republished after each annual conference, so check that page for the edition your state has adopted before you accept a vendor’s claim of compliance.
That is the durable spine: any scale ticketing system you buy must produce a record your state weights-and-measures official would accept — identifiable vehicle, gross, tare, net, date, and the weighmaster’s certification — and must retain it. A digital ticket that cannot be reproduced on demand is worse than a carbon-copy pad.
Grain ticket printing for farms: what the set-up needs
A farm that weighs its own grain loads needs four pieces to print a usable scale ticket:
- A truck or platform scale with a digital weight indicator. If tickets will be used to settle with a buyer, the scale and indicator should be legal-for-trade. In the US that normally means the device model holds a National Type Evaluation Program (NTEP) certificate showing it meets NIST Handbook 44 (NCWM), and your state inspects the installed scale.
- A data link from the indicator to a PC or tablet, usually serial, USB or Ethernet, so weights are captured, not retyped.
- Ticketing software that stores vehicle tares, records gross, tare and net weight with date and time, attaches moisture and test weight from the grain tester, numbers each ticket in sequence and keeps an unalterable copy.
- A ticket printer, often a multi-part impact printer, so the driver, farm and buyer each keep a copy.
When comparing grain farm ticketing software, test it on a real harvest-day load. Check that it applies the right shrink for your crop’s base moisture, that it exports tickets to your accounting or settlement system, and that a reprinted ticket shows it is a copy. Ask whether the vendor has sold the product to elevators or commercial haulers; that usually means its tickets have already passed a state inspection.
The arithmetic your ticket software must get right
Net weight is only the start. Grain is bought on a standard moisture and a standard test weight: corn at 56 lb per bushel and 15.5% moisture, soybeans at 60 lb per bushel and 13% (Ohio State University Extension fact sheet AGF-503, revised 26 December 2018). Wet grain is converted with the shrink formula (100 − wet%) ÷ (100 − dry%). AGF-503’s worked example: 6,000 lb of soybeans at 18% moisture becomes 5,640 lb at the 13% standard, a factor of 0.94.
Applied to a real corn load — an 80,000 lb gross semi with a 30,000 lb tare, delivered at 19.0% moisture against a 15.5% base — the ticket resolves like this:
Two thousand three hundred pounds vanished between the scale and the settlement sheet on a single load. Run your own numbers here.
Scale ticket net-value calculator
Work-order ticketing, and why labour cost drives it
Work-order ticketing is the least glamorous module and the easiest to justify. USDA ERS forecasts farm sector production expenses of $492.8 billion in 2026, up from $471.6 billion in 2025, with cash labour expenses at $44.3 billion, about level with 2025; net farm income is forecast at $158.4 billion, down 2.6%. That forecast was published 3 September 2026 and is revised several times a year (USDA ERS) (USDA ERS Farm Sector Income Forecast) — check that page for the revision current when you read this. When labour is a major expense line, a ticket that records who did what, on which field, for how long, is a cost-control instrument.
Farm attraction software: admission ticketing
Agritourism is a real revenue line, not a hobby. US farms and ranches earned $1.26 billion from agritourism and recreational services in 2022, up 12.4% from 2017 in inflation-adjusted terms. About 57% of US counties reported some agritourism income, with a median county total of $161,000; the 50 highest-earning counties, spread across 23 states with eight in Texas, accounted for $352 million — roughly 28% of the national total (USDA ERS chart of note, 5 December 2024).
If that is your revenue line, buy timed-entry admission software with capacity caps and gate scanning. Do not buy a crop management platform and expect it to sell wristbands.
Agriculture scale ticketing automation: what to automate first
A durable sequence that does not change when vendors do:
- Capture the weight electronically at the indicator. If a human retypes a number, you have automated nothing.
- Store tares per vehicle so weigh-out applies them without a clerk.
- Bind moisture and test weight to the ticket ID at the point of sampling.
- Push tickets to inventory and accounting the same day, not at month end.
- Reconcile field-level yield against delivered bushels — this is where satellite acreage and yield estimates earn their keep.
- Verify retention and reproducibility against your state’s weighmaster requirements before harvest, not during it.
Where Farmonaut sits in this stack
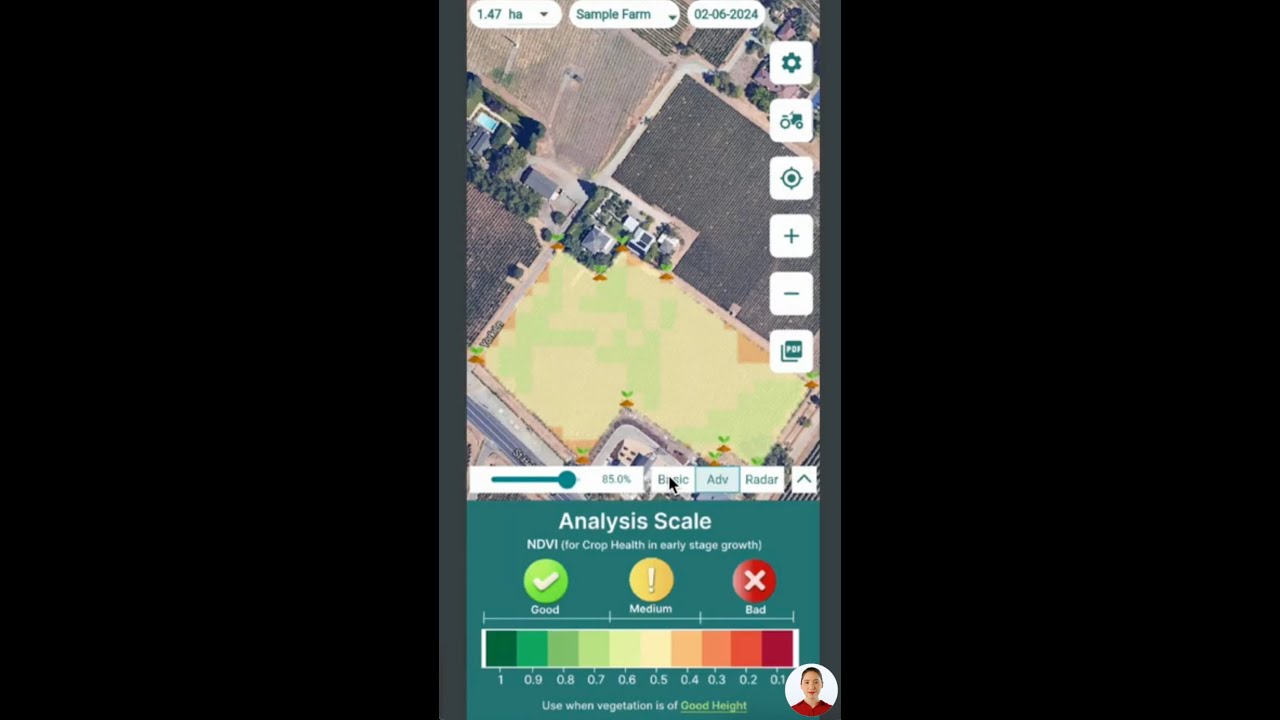
Farmonaut supplies the agronomic layer that step 5 depends on: satellite crop health via NDVI and related indices, soil moisture, weather forecasting, and AI advisory, delivered per field on a subscription rather than a per-hardware basis. It is not a weighbridge system and does not print weighmaster certificates. It is what tells you whether the 851.6 bushels on that ticket match what the field should have produced.

For teams building their own ticketing or ERP layer, the imagery and weather data are available programmatically — see the satellite and weather API and the API developer documentation for endpoints and field-registration formats. Related depth: land cover classification for acreage verification, soil conservation practices, soil carbon sequestration, precision farming outcomes, and broader agricultural technology trends.




How to refresh every figure on this page
- Farm technology and connectivity: USDA NASS Technology Use (Farm Computer Usage and Ownership) is biennial, with the report released 1 August 2025 — see the NASS publication series for the next edition.
- Precision ag adoption: USDA ERS America’s Farms and Ranches at a Glance, published annually.
- Expenses and income: USDA ERS Farm Sector Income Forecast, revised through the year.
- Structure of farms: Census of Agriculture, every five years; the 2022 edition was released 13 February 2024.
- Weighing law: NIST Handbook 130, republished after each NCWM annual meeting.
Frequently asked questions
Is crop management software the same as farm management software?
No. Crop management software centres on agronomy — imagery, scouting, inputs, crop plans. Farm management software adds accounting, inventory, payroll and settlement. Granular Business sat on the farm-management side; Granular Insights sat on the crop-management side.
Can one platform handle both scale tickets and admission tickets?
In practice, no. They share a word, not a data model. A scale ticket is a legal weight record governed by state weighmaster law; an admission ticket is a timed-entry payment record.
What does Granular cost per acre?
Corteva does not publish a rate card, and per-acre numbers on comparison sites are not vendor-sourced. Request a written quote on your acreage, ask for the annual minimum, and divide the three-year total by your acres.
Does a digital scale ticket satisfy state regulators?
It depends on your state’s adoption of the Uniform Weighmaster Law in NIST Handbook 130 §III.B. Confirm with your state weights-and-measures office that the format and retention period your vendor produces are acceptable before harvest.


The short version
Name the job before you name the vendor. If your problem is knowing what the crop is doing, buy monitoring. If it is knowing what your crews did, buy work orders. If it is knowing what left the farm and what you were paid for it, buy scale ticketing and check it against the weighmaster law your state adopted. If it is knowing how many people walked through the gate on a Saturday in October, buy admission software. Then hold every quote to the same test: three-year total, divided by acres or loads, with the minimum disclosed.

 UCAL Fuel Systems
 Kubota
 FFBS
FFBS Jontra
 Kalustyan
 Tucor
Tucor Geno
Geno Hayleys Agriculture
 Linx Agritech
 Adinet
 Save Your Soils
 Grandstream Algérie
 XOS Realty
 Geospatial Lab Africa
 Agro La Gándara
