

Reviewed August 2026 against USDA NASS Census of Horticultural Specialties, the USDA NRCS/Soil Health Institute collaborative study, and Springer Nature’s peer-reviewed Precision IPM in Horticulture research.
Try it: Run your own numbers →
Crop Management Solutions: Pest, Soil & CEA Data Guide
Crop management solutions that actually move the needle combine three things: satellite-based monitoring for real-time field data, precision pest management that cuts chemical use by 40-70 percent, and soil-input systems tuned to documented yield responses. This article walks through what the published US data says about each, where the gaps in that data are, and how Farmonaut’s tools apply to crop production solutions for horticulture, greenhouse, and coastal operations.
The US horticulture sector generated $18.3 billion in total sales across floriculture, nursery, and specialty crops in 2024, spread across 23,060 operations, according to the USDA NASS Census of Horticultural Specialties released February 26, 2026 (USDA NASS). That census — conducted every five years, with the next edition due in 2029 — is the only comprehensive federal count of this industry, and it’s the backbone of the figures below.
Table of Contents
- The Coastal and Horticulture Production Challenge
- Precision Pest Management: What the Data Shows
- Soil Balancing and Nutrient Management
- Horticulture Management Software: The Farmonaut Stack
- Greenhouse and CEA Automation, Lighting, and Quality Control
- Comparison: Traditional vs. Precision Crop Management
- Soil Health & IPM Input Savings Calculator
- Getting Started with Farmonaut
- FAQs
- Try it: Run your own numbers
The Coastal and Horticulture Production Challenge
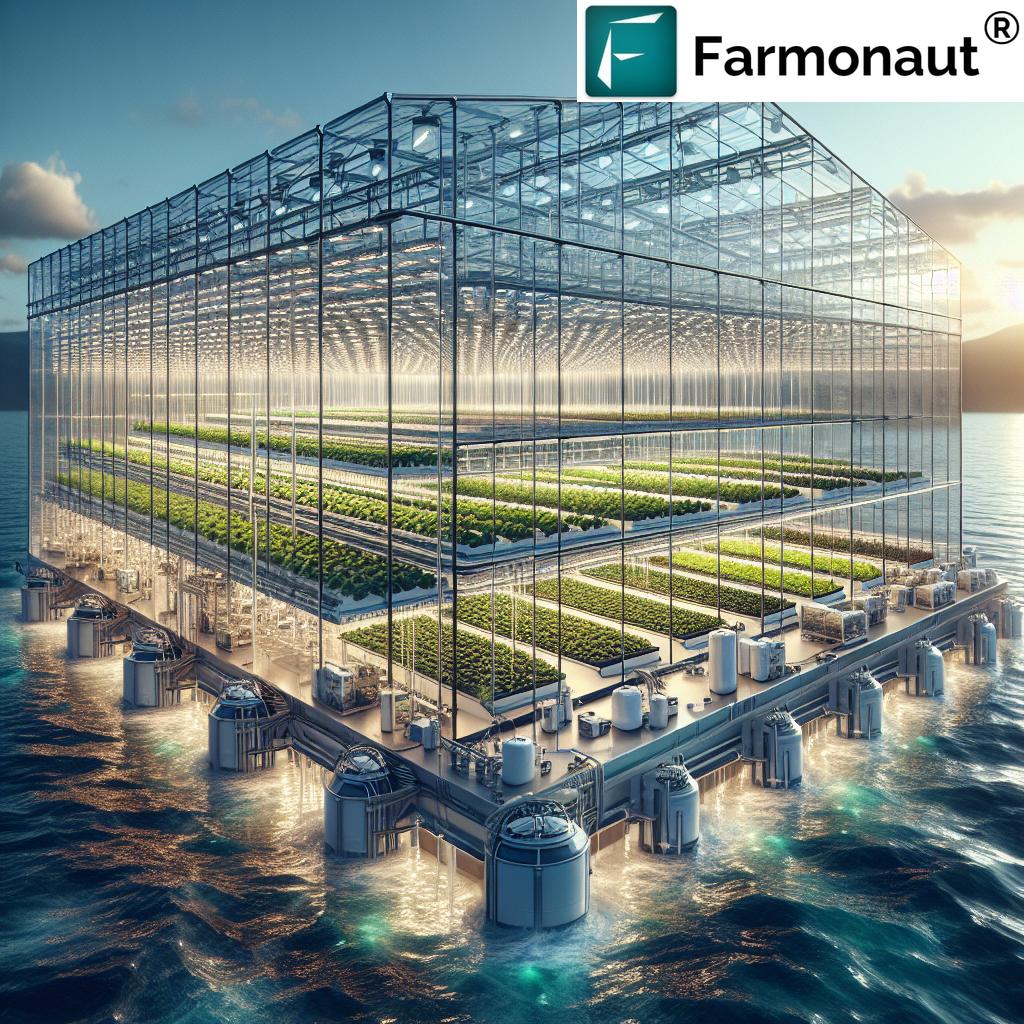
Coastal production zones and general horticultural operations share a common set of constraints: saline or marginal soils, unpredictable weather, limited freshwater, and — for coastal growers specifically — vulnerability to sea-level rise and erosion. These conditions make blanket fertilizer and pesticide schedules inefficient at best and environmentally damaging at worst, particularly where nutrient runoff reaches sensitive marine or wetland ecosystems.
At Farmonaut, we built our controlled environment agriculture (CEA) tools and satellite monitoring stack around a simple premise: growers need field-specific data, not regional averages, to make input decisions that hold up under these constraints.
Satellite-Based Crop Health Monitoring
Our satellite imaging platform tracks vegetation health (NDVI), soil moisture, and canopy stress in near-real time. For coastal and marginal-soil operations, this data flags:
- Early salt stress signatures in crop canopies
- Irrigation scheduling gaps that waste freshwater
- Drainage or salinity patches within a field
- Whether soil remediation efforts are actually working, plot by plot
Jeevn AI Advisory Layer
Jeevn AI combines satellite data with weather forecasts and soil inputs to generate per-field recommendations: planting windows, salt-tolerant variety fit, precision fertilizer timing, and integrated pest management (IPM) triggers. The advisory layer is what turns raw satellite data into an action a grower can take that week, not a dashboard they have to interpret themselves.
Precision Pest Management: What the Data Shows
Precision pest management is the practice of triggering pesticide applications from field-specific scouting and sensor data instead of calendar schedules. Peer-reviewed synthesis published by Springer Nature on Precision IPM in Horticulture puts the effect at a 40-70 percent reduction in pesticide use alongside a 10-35 percent yield enhancement in horticultural crops where IPM has been adopted as the current practice standard (Springer Nature, Precision IPM in Horticulture).
That’s a wide range because it spans crop types, pest pressure, and how tightly the IPM program is run — but both bounds are documented, not estimated. What the published literature does NOT yet quantify is what share of US horticultural operations have actually adopted precision pest management software specifically, as opposed to IPM practices broadly. That adoption-rate figure isn’t published anywhere we could verify; if you need it for a specific state or crop, the NASS QuickStats custom query tool (linked in the refresh section below) is the place to check for newly released adoption-practice tables, and your state’s Cooperative Extension IPM program will usually have the most current regional adoption survey.
How Precision Fertilizer and Pest Systems Work Together
Our precision fertilizer system pairs real-time soil nutrient monitoring with GPS-guided application and AI-optimized formulations, so nutrient load and pest-trigger data inform each other — over-fertilized crops are frequently more pest-susceptible, so treating both as one input-management problem rather than two separate systems is where the yield and cost gains compound. This is the same logic behind Integrated Pest Management strategies for coastal and salt-affected environments: mitigating soil salinity through precision fertilizer application reduces the plant stress that invites secondary pest and disease pressure in the first place.
Soil Balancing and Nutrient Management
Soil health management systems — cover cropping, reduced tillage, precision nutrient timing — produced measurable yield gains in a multi-state USDA NRCS and Soil Health Institute collaborative study covering 30 US farms between 2020 and 2025: 42 percent of corn farms and 32 percent of soybean farms in the study reported yield increases from soil health management systems (Soil Health Institute / USDA NRCS).
That study covers row crops rather than horticultural specialty crops directly, but the mechanism — matching nutrient inputs to real soil-test data instead of flat-rate application — is the same one our precision fertilizer system applies to greenhouse and coastal horticulture. Labor is the other constraint worth naming here: labor costs account for 36 percent of total horticultural operation expenses nationally as of the 2024 Census (USDA NASS, cited above), which is exactly the cost line that automated soil monitoring and variable-rate application are designed to reduce — fewer manual soil tests, fewer blanket applications to walk back.
Horticulture Management Software: The Farmonaut Stack
Horticulture management software needs to do three things a spreadsheet or a generic farm-management app can’t: pull satellite imagery at the field level, translate it into an advisory a non-agronomist can act on, and hold a traceable record of what was applied, when, and why. Our stack covers this through:
- Satellite monitoring for NDVI, soil moisture, and stress detection
- Jeevn AI for planting, fertilizer, and pest advisories
- Blockchain-based traceability recording every step from planting through harvest and distribution
- API access for operations that want to pull this data into their own systems
The traceability layer matters for a different reason than compliance alone: it’s what lets a mid-size operation document input reductions to a buyer or certifier without manual recordkeeping. For growers running vertical farming operations in urban or coastal markets, that same record also supports the shorter, more auditable supply chains those formats depend on.
Greenhouse and CEA Automation, Lighting, and Quality Control
Controlled environment agriculture in the US has grown from 2,994 operations counted in the 2019 USDA NASS Census to a market valued at $32.3 billion in 2024, per market research synthesized by Verified Market Reports (USDA ERS, CEA production data). Protected-crop sales — food crops grown under greenhouses and shade structures — reached $1.01 billion in 2024 per the same NASS Census cited above.
Automated systems are projected to cut labor costs in US greenhouse operations by 40 percent, according to market research on the greenhouse automation sector — a meaningful number against the 36 percent labor share of total horticultural expenses cited above. That’s a forecast figure, not an audited result, so treat it as directional for your own operation’s labor-cost baseline rather than a guaranteed cut.
Agricultural Lighting for Indoor and Greenhouse Cultivation
Our agricultural lighting systems adjust spectrum and intensity by crop type and growth stage, integrating with the AI advisory layer so light schedules respond to the same data driving irrigation and fertilizer decisions. This is core to greenhouse horticulture technology aimed at optimal crop production — light, water, and nutrients managed as one coordinated system rather than three separate schedules.

Hydroponic Growing Media and Automated Quality Control
For coastal operations where soil quality is a limiting factor, we’ve developed hydroponic growing media with salt-resistant, pH-stable materials and enhanced water retention. Automated quality control in horticulture — sensor-triggered flagging of nutrient deficiency, pest pressure, or irrigation faults before they show up as visible crop damage — is the layer that makes hydroponic and greenhouse systems consistent at scale rather than dependent on manual daily walk-throughs. We should note directly: published, horticulture-specific damage-cost figures for greenhouse pest and disease losses (roses, peppers, tomatoes) are sparse in the current literature, so where you need a damage-cost baseline for your own crop and region, your state Extension plant-disease clinic or a regional grower association’s loss survey is the more current and locally accurate source than any single published figure.
Greenhouse Technology and Water Management Innovations
Our greenhouse technology portfolio adds saltwater-resistant construction materials, climate control tuned to coastal weather variability, and integrated desalination for sustainable water management. Robotic harvesting and automated, salinity-aware irrigation round out the automation layer — routine tasks handled by sensors and actuators so growers spend their time on the decisions that actually require judgment: variety selection, market timing, capital allocation.
“The expanding US market for controlled environment agriculture is driving strategic positioning of new distribution centers.”
Comparison: Traditional vs. Precision Crop Management
| Function | Traditional Approach | Precision Crop Management Solution | Documented Effect |
|---|---|---|---|
| Pest control | Calendar-based spraying | Sensor/scouting-triggered IPM | 40-70% less pesticide use, 10-35% yield gain (Springer Nature) |
| Soil nutrient management | Flat-rate fertilizer application | Soil-test-driven, variable-rate application | 42% of corn farms, 32% of soybean farms report yield gains (USDA NRCS/SHI) |
| Greenhouse labor | Manual monitoring and adjustment | Automated climate and irrigation control | Up to 40% projected labor-cost reduction (market forecast) |
| Lighting | Fixed-spectrum greenhouse lighting | AI-adjusted spectrum/intensity by growth stage | Enables year-round production regardless of season |
| Traceability | Paper-based records | Blockchain-based tracking | Auditable farm-to-consumer record |
The Future of Coastal and Horticultural Crop Production
The trends worth watching aren’t tied to a single season: vertical farming adapted for coastal urban markets, renewable power (tidal, wind) feeding CEA facilities, continued breeding of salt-tolerant varieties, and AI-driven predictive crop management replacing reactive scouting. None of these are speculative — they’re extensions of the $32.3 billion CEA market and the automation economics already documented above; the open question for any given operation is adoption timing, not whether the shift happens.

Soil Health & IPM Input Savings Calculator
Enter your operation’s current fertilizer and pesticide spend to see the documented reduction ranges applied to your own numbers — the ranges themselves come from the USDA NRCS/Soil Health Institute study and the Springer Nature IPM review cited above, not from a generic industry average.
Run your own numbers
Assumptions: pesticide savings apply the 40-70% reduction range documented for IPM adoption in horticultural crops (Springer Nature); it does not model your specific pest pressure, crop mix, or regional pricing. Yield-increase percentages are the share of study farms reporting gains, not a guaranteed yield lift for any single operation. This tool excludes labor, equipment, and transition costs.
Getting Started with Farmonaut
Farmonaut’s tools scale from a single coastal plot to a multi-site horticultural operation:
- Web App: Full toolset via browser.
- Android App: Field monitoring on the go.
- iOS App: Same feature set for iPhone.
- API Access: For integrating our data into your own systems.
- API Developer Docs: Full integration documentation.





Subscription Options
Flexible plans covering the full toolset described above:

Frequently Asked Questions
- What is the actual scale of the US horticulture market these solutions serve?
$18.3 billion in total sales across 23,060 operations in 2024, per the USDA NASS Census of Horticultural Specialties released February 26, 2026. The next Census is due in 2029; check USDA NASS or run a custom query on NASS QuickStats for updated figures by state or crop.
- How much can precision pest management actually reduce pesticide use?
40-70 percent, with a 10-35 percent yield enhancement, per peer-reviewed synthesis in Precision IPM in Horticulture (Springer Nature). The exact figure for a given operation depends on crop type and existing pest pressure — no single published number applies to every farm.
- Is there a published adoption rate for precision pest management software in the US?
Not that we could verify. The literature documents effectiveness, not adoption share. Your state Cooperative Extension IPM program or a NASS QuickStats custom query is the best path to a current regional figure.
- What labor savings can greenhouse automation realistically deliver?
Market research projects up to a 40 percent reduction in labor costs for automated US greenhouse operations. That’s a forecast, not an audited outcome — worth testing against your own labor-cost baseline, given labor already runs 36 percent of total horticultural operation expenses nationally (USDA NASS, 2024).
- Do Farmonaut’s tools work for small-scale coastal or horticultural operations, not just large farms?
Yes. Pricing and interfaces are built to scale down to single-plot operations as well as up to multi-site horticultural businesses.
Crop management solutions that hold up under scrutiny are the ones built on published, sourced figures — not averages that sound plausible. The USDA NASS Census, the NRCS/Soil Health Institute study, and the Springer Nature IPM review each get refreshed on their own schedule; when they do, the numbers in this article should be re-checked against the current release rather than assumed to hold indefinitely.

 NWNS
NWNS Hydenmet
 Dirks Bros Farms
 Red August Group
 Farm Inc
 WeMe Global
 Agrotoken
 Blue BearX
 Insignito
 Croptimum
 DnCubed
 Field Capacity
 Indosistim Teknologi
 Liquify Digital
 CU Foods
 BeyondTech Global
 Rouge VC
