

Reviewed August 2026 against USDA’s Economic Research Service (ERS) and NASS chart data, and NASA Earthdata’s NDVI reference.
A crop monitoring system is any combination of sensors, imagery, and software that tells a farm operator what a field or herd is doing right now instead of what it did last week. The category splits into four working layers: UAV/aerial monitoring (drones or satellites carrying multispectral cameras), NDVI-based vegetation indices (the math that turns those images into a health score), yield monitoring (on-combine sensors that map harvest output), and soil moisture monitoring (in-ground or remote sensors tracking water at depth). Adoption of these layers in the United States is uneven — 60% of corn and soybean producers used yield monitoring in 2023, but under 10% of soybean acres used aerial imagery as recently as 2018 — which is exactly why a buyer needs the categories kept separate rather than sold as one bundle.
This guide breaks down what each system actually measures, what US farms report paying in adoption terms, where the published data stops, and how to check whether a given county fits the exception rather than the rule. It also covers cattle monitoring and carbon/traceability tools that increasingly sit on the same dashboard as crop sensors, since large-scale operations rarely buy these layers one at a time.
USDA’s Economic Research Service reports that 68% of large-scale US crop farms used yield monitoring and mapping in 2023, versus 13% of small crop farms — a 5x adoption gap driven mostly by hardware cost per acre farmed. Source: USDA ERS Chart of Note 110550.
Table of Contents
- What Counts as a “Crop Monitoring System”
- NDVI Crop Monitoring: What the Index Actually Measures
- UAV Crop Monitoring: Drones vs. Satellite
- Wireless Crop Monitoring Systems: How the Network Layer Works
- Yield Monitoring Systems: Adoption, Hardware, Output
- Soil Moisture Monitoring Devices: Sensors vs. Remote Sensing
- Comparison Table: Which System Solves Which Problem
- Calculator: Wireless Sensor Network Cost vs. Satellite Monitoring
- Cattle Monitoring: The Adjacent Layer
- How Farmonaut Fits In
- Frequently Asked Questions
- Conclusion
- Jump to the calculator

What Counts as a “Crop Monitoring System”
The term gets used loosely, so it helps to separate what’s actually being sold. A crop monitoring system has three parts: a sensor (satellite, drone camera, in-ground probe, or on-combine yield sensor), a way to move that data off the field (cellular, LoRaWAN, satellite uplink, or a USB stick pulled at end of day), and software that turns raw readings into a map or an alert. Vendors bundle these differently — a wireless soil moisture network is a sensor-plus-network product with a thin dashboard; a satellite NDVI platform is a data-plus-software product with no farm hardware at all. Knowing which piece you’re buying determines the real cost driver: hardware systems scale with acres and sensor count, satellite systems scale with subscription tier and update frequency.
US market sizing reflects this split. The country’s agricultural drone market — hardware plus flight software — was valued at $506.3 million in 2024 and is projected to grow at a 23.5% CAGR from 2025 through 2030, according to Market Research Future’s 2024 report. Separately, yield monitoring holds a 24.3% share of the broader North America precision agriculture market as of 2024, per Market Data Forecast. These are different pools of spending, not the same number described two ways — a useful check whenever an article or salesperson quotes “the precision ag market” as a single figure.
NDVI Crop Monitoring: What the Index Actually Measures
NDVI — Normalized Difference Vegetation Index — is a ratio calculated from how much red light a plant canopy absorbs versus how much near-infrared light it reflects. Healthy, chlorophyll-dense canopy absorbs red and reflects near-infrared strongly, pushing the index toward 1.0; bare soil, water, or stressed/dying tissue pushes it toward 0 or negative. NASA’s Earthdata program maintains the reference definition and free public data sources (Landsat and MODIS) that most commercial NDVI tools build on top of — see NASA Earthdata’s NDVI overview for the underlying math and open datasets, which is also the fastest way to sanity-check a vendor’s NDVI map against a free source.
NDVI cameras — the dedicated sensor hardware, distinct from software-only satellite NDVI — are their own product category. The global market for NDVI cameras used in agriculture was sized at $412 million in 2024 and is forecast to reach $1.24 billion by 2033, a 12.6% CAGR over 2024–2033, according to Market Intelo’s 2024 NDVI camera market report. Within that market, multispectral cameras (capturing several distinct wavelength bands rather than one) held 55% share in 2024, versus single-band NDVI sensors — evidence that buyers are paying up for cameras that can separate, say, nitrogen stress from water stress rather than flagging “something is wrong” without saying what.
The practical read for a US grower: NDVI itself is free and public (NASA/USGS Landsat, 30m resolution, revisited roughly every 16 days; MODIS, coarser but daily). What you pay a vendor for is faster revisit, higher resolution, cloud-gap filling, and a dashboard that turns pixels into a field-zone map without you downloading raw satellite tiles yourself. If a subscription’s main selling point is “we compute NDVI,” ask what resolution and revisit cadence you’re actually buying above the free baseline.
Pull NDVI just before critical growth stages — pre-flowering, flowering, and grain fill for row crops — since stress detected at those windows is still actionable before yield loss locks in.
UAV Crop Monitoring: Drones vs. Satellite
UAV crop monitoring uses drones carrying multispectral or hyperspectral cameras to fly fields at far lower altitude than satellites, trading coverage area for resolution — a drone can resolve individual plant rows; a satellite pixel at 10-30m resolution averages dozens of plants together. That resolution gap is why drones remain a minority tool even where NDVI adoption is common: as of 2016, only about 7% of US corn acres used aerial imagery for crop monitoring, rising to 9.8% of soybean acres by 2018, per USDA ERS Chart of Note 107207. Those are the most recent USDA-published figures for this specific metric; ERS updates precision-ag adoption charts on the Census of Agriculture’s 5-year cycle (next full census 2029) with annual refreshes via NASS QuickStats in the interim, so a grower checking current uptake should query quickstats.nass.usda.gov directly rather than rely on a 2016-2018 baseline indefinitely.
The US agricultural drone market’s 23.5% projected CAGR through 2030 suggests that gap is closing, but there’s no published USDA figure yet confirming a higher adoption rate than the 2016-2018 chart shows — a case where the honest answer is “check quickstats.nass.usda.gov for your state and crop” rather than a number this article can update itself.

Core Features of UAV Crop Monitoring
- 🌐 Remote sensing hardware: multispectral or hyperspectral cameras mounted on fixed-wing or rotor drones
- 🔎 Early stress detection: pest, weed, and nutrient-deficiency zones flagged before visible symptoms spread field-wide
- 🗺️ Prescription maps: variable-rate spray, seed, or fertilizer maps generated from flight data
- ⏱️ Coverage rate: hundreds of acres surveyed per flight, versus days for manual walk-and-scout inspection
- 🔄 Software integration: flight data syncing into farm management platforms for zone-level record keeping

For operations that need to prove what a drone or satellite recorded to a buyer or auditor, Farmonaut’s Blockchain-Based Traceability solutions pair remote monitoring records with tamper-proof logs of crop origin, input use, and health status across the supply chain.
Wireless Crop Monitoring Systems: How the Network Layer Works
“Wireless crop monitoring system” describes the network layer, not the sensor itself — it’s the transport that gets a soil probe’s or weather station’s reading off the field without a wired trench run. Three architectures dominate US deployments: cellular (each node has its own SIM, no local gateway needed, but a recurring per-node data plan), LoRaWAN (a single gateway covers a multi-mile radius, low per-node cost, but requires the grower to own and maintain that gateway), and satellite uplink (works with zero cell coverage, highest per-node cost, used mainly on remote rangeland). The choice is a coverage-versus-cost tradeoff specific to the farm’s terrain and existing connectivity, not a universal “best” option — a 40-acre irrigated block near a rural cell tower and a 4,000-acre unfenced rangeland parcel will rationally choose opposite architectures.
No USDA or NASS breakdown of wireless-network adoption specifically (as opposed to sensor adoption generally) is published at state or regional level — this is a genuine data gap, not an oversight in this article. A grower evaluating a wireless system for their own operation should request the vendor’s per-node data cost and gateway range in writing, run it through the calculator below, and compare against the fully-loaded cost of a wired or satellite-only alternative for their specific acreage and field layout, since no published national average would apply cleanly to an individual farm’s connectivity situation anyway.
Yield Monitoring Systems: Adoption, Hardware, Output
Yield monitors are sensors mounted on the combine’s grain flow path that measure harvested mass, moisture content, and GPS position continuously as the machine moves — the output is a spatial map showing exactly which parts of a field produced more or less grain per acre. This is the most mature and most-adopted layer of the four covered here. USDA’s National Agricultural Statistics Service found that 60% of US corn and soybean producers used yield monitoring in 2023, and that adoption splits sharply by farm size: 68% of large-scale crop farms used yield monitoring and mapping that year, against just 13% of small crop farms, per USDA ERS Chart of Note 110550. Yield monitoring also accounts for 24.3% of the North America precision agriculture market by category share as of 2024, per Market Data Forecast — the largest single category share among precision-ag segments that report, evidence that this is the layer with the clearest proven payback in US row-crop operations.
The 5x adoption gap between large and small farms tracks hardware economics: yield monitor kits are priced closer to a fixed cost per combine than a cost per acre, so the per-acre cost falls as acreage rises — which is precisely why small farms lag despite the technology being decades old at this point. If you farm under roughly 500 acres, run the fixed hardware cost against your specific acreage before assuming the 68%-adoption large-farm case applies to you.
Need documentation for crop loan or insurance claims? Farmonaut’s Satellite-Based Verification provides yield and health records usable for financing and claims support alongside on-combine data.
Typical Yield Monitor Components
- 🔎 Grain flow sensor: mass-flow or optical sensor in the clean grain elevator
- 📍 GNSS receiver: geo-tags every yield reading to sub-meter or better accuracy
- 💧 Moisture sensor: corrects raw yield to a standard moisture basis for accurate comparison
- 📱 Data logger/display: in-cab record with export to farm management software
Soil Moisture Monitoring Devices: Sensors vs. Remote Sensing
Soil moisture devices split into two designs: in-ground probes (capacitance or tension-based sensors buried at one or more depths, wired or wireless back to a logger) and remote sensing (satellite or modeled estimates of surface and root-zone moisture, no field hardware). In-ground probes give a precise reading at one point; remote sensing gives a lower-resolution estimate across an entire field or region with zero installed hardware. Most operations that report real value use both — probes to calibrate and validate what the remote model is estimating for that specific soil type and field.
There is no US-specific adoption rate for soil moisture sensors published by USDA broken down by state or crop, unlike the yield-monitor figures above — that data gap is real and worth naming rather than filling with an estimate. A global figure exists in industry reporting (roughly 500,000 hectares of claimed 2024 deployment) but it isn’t a US-only, USDA-sourced number and shouldn’t be presented as one. Similarly, no standardized USDA benchmark exists yet for water savings or yield response specifically attributable to soil moisture monitoring in US corn or soybeans; peer-reviewed studies in this space report yield effects generally under 2% in maize and soybean trials, but that figure comes from academic literature, not a USDA survey, and shouldn’t be quoted as an official statistic. The honest guidance for a US grower: run a field-scale comparison on your own soil type for one season — probe a monitored zone against an unmonitored control — since the published range is too broad and too study-specific to substitute for your own field’s number.

Pair soil moisture management with the Farmonaut Carbon Footprinting Tool to track irrigation-linked emissions alongside water-use data — increasingly relevant as buyers and lenders ask for combined water and carbon reporting.
ROI payback period for wireless crop monitoring systems on US farms has no standardized USDA or NASS figure — it depends on crop, farm size, and current input prices. Build your own payback estimate with the calculator below using your actual acreage and sensor cost quotes.
Comparison Table: Which System Solves Which Problem
| System | What It Measures | US Adoption Figure | Hardware on the Field? | Best Fit |
|---|---|---|---|---|
| NDVI / satellite monitoring | Vegetation health index from red/near-infrared reflectance | N/A (public data via NASA/USGS; commercial adoption not separately tracked by USDA) | No — software/subscription only | Whole-field health trend, low cost per acre at scale |
| UAV / drone monitoring | High-resolution multispectral imagery per flight | 7% of corn acres (2016), 9.8% of soybean acres (2018) — USDA ERS 107207 | Yes — drone + camera + pilot/operator time | Plant-level scouting on high-value acres |
| Yield monitoring | Harvested mass, moisture, GPS position per pass | 60% of corn/soy producers; 68% large farms vs. 13% small farms (2023) — USDA ERS 110550 | Yes — on-combine sensor kit | Row-crop operations wanting field-zone ROI data |
| Soil moisture monitoring | Water content at one or more soil depths | Not separately published by USDA at US state/crop level | Yes (probes) or no (remote sensing) | Irrigated acreage facing water-cost or scarcity pressure |
Calculator: Wireless Sensor Network Cost vs. Satellite Monitoring
Since no published national ROI figure exists for wireless crop monitoring systems, use your own quotes and acreage to see where the wireless-hardware cost per acre crosses over against a satellite-subscription alternative.
Assumptions: hardware costs are one-time; data plan and satellite subscription costs recur annually; excludes installation labor, sensor replacement/calibration drift, and gateway hardware for LoRaWAN setups. Enter your own vendor quotes for an accurate comparison — no default value here is a published industry average.
Check USDA NASS QuickStats each spring for updated yield-monitor, GPS-guidance, and variable-rate adoption figures by state and crop — this is the durable method behind every adoption number in this article, and it will still work after the specific figures above age out.
Cattle Monitoring: The Adjacent Layer
Operations running mixed crop-livestock enterprises increasingly put cattle monitoring on the same dashboard as crop sensors. Wearable sensors — collars or ear tags — track vital signs, grazing patterns, activity levels, and reproductive status continuously, flagging illness or optimal breeding windows earlier than visual inspection would catch them.
- ✔ Real-time health alerts: fever or inactivity signals flagged before visible symptoms appear
- 📊 Fertility timing: heat-cycle detection supports optimal insemination scheduling
- 🧑💻 Remote herd oversight: software dashboards accessible without a physical herd walk

Buying cattle-monitoring hardware and then not reviewing the alerts daily. The sensor data has no value if nobody acts on the fever or heat-cycle flag it generates.
For operations running equipment fleets alongside herd management, Farmonaut's Fleet & Resource Management tools track tractor and machinery deployment from the same dashboard.
How Farmonaut Fits In
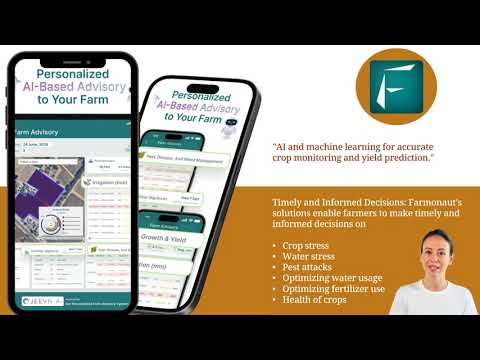
Farmonaut's core product is the software-and-satellite layer described in the NDVI section above: multispectral satellite imagery processed into field-health, soil-moisture, and yield-prediction outputs without requiring the farm to install in-field hardware. This positions it as the lower-fixed-cost option in the comparison table — no combine sensor kit, no wireless node network to install or replace — trading some resolution and revisit-frequency precision (inherent to satellite versus drone or in-ground sensing) for near-zero field hardware.
- 🚀 Satellite-based monitoring: NDVI vegetation health, soil moisture estimates, and risk flags for crop and mining land use
- 🤖 JEEVN AI advisory: recommendations generated from live crop and weather data (see the JEEVN AI tutorial)
- 🔗 Blockchain traceability: supply-chain-level accountability records
- 🚜 Fleet and resource tracking: equipment location and utilization
- 🌍 Carbon footprinting: emissions reporting alongside irrigation and input data
The platform runs on Android, iOS, web app, and API. For enterprise operations, Farmonaut's Agro Admin App centralizes multi-field management under one account.

Businesses integrating monitoring data into their own systems can use Farmonaut's API platform, with setup details in the developer docs.




Subscription Options
Plans include web app, mobile app, and API access with configurable satellite data update frequency.
Trace product journeys from field to buyer with Farmonaut's Blockchain Traceability platform.
Any monitoring system — satellite, drone, wireless sensor, or wearable — only pays off if someone reviews the data and acts on it. Alerts left unread produce the hardware cost without the benefit.
Frequently Asked Questions
-
What's the difference between NDVI monitoring and UAV crop monitoring?
NDVI is a vegetation-health index calculated from red/near-infrared reflectance — it can come from a satellite, a drone, or a handheld sensor. UAV crop monitoring is a specific delivery method (drone-mounted cameras) that can compute NDVI along with other indices at much higher resolution than satellite imagery, at the cost of covering far less ground per flight.
-
How many US farms actually use yield monitoring?
60% of US corn and soybean producers used yield monitoring in 2023, per USDA NASS data cited in USDA ERS Chart 110550. That splits to 68% for large-scale farms and 13% for small farms — check quickstats.nass.usda.gov for the latest state-level figures.
-
Are wireless crop monitoring systems worth the cost for a small farm?
No standardized USDA ROI figure exists for this. It depends on node count, data plan cost, and acreage — use the calculator above with your own vendor quotes rather than a published average, since none applies cleanly across farm sizes.
-
What do soil moisture monitoring devices actually measure?
In-ground probes measure volumetric water content at one or more soil depths via capacitance or tension sensing. Remote-sensing alternatives estimate surface and root-zone moisture from satellite data without field hardware, at lower spatial precision.
-
Does UAV crop monitoring replace satellite/NDVI monitoring?
No — they serve different resolutions. Satellite NDVI is suited to whole-field or whole-farm trend tracking at low per-acre cost; UAV imagery is suited to plant-level scouting on specific problem zones a satellite pixel can't resolve.
-
Is Farmonaut's platform hardware-based?
No. Farmonaut's core product uses satellite imagery and software, not field-installed sensors. Wireless soil-moisture networks and on-combine yield monitors described in this article are separate, hardware-based product categories from different vendors.
-
Where can I check current adoption or market figures instead of relying on this article's numbers?
USDA NASS QuickStats (quickstats.nass.usda.gov) for adoption by state and crop, refreshed annually. USDA ERS Charts of Note refresh on the 5-year Census of Agriculture cycle with interim annual updates. Market-size and CAGR figures from firms like Market Data Forecast and Market Research Future are typically revised on a quarterly-to-annual cycle — check the publisher's site directly for the latest release.
Conclusion
The four systems covered here solve different problems and shouldn't be bought as one undifferentiated "crop monitoring" purchase: NDVI/satellite for low-cost, whole-field trend tracking; UAV for plant-level resolution on specific acres; yield monitors for the best-documented, highest-adoption ROI case in US row crops (68% of large farms, per USDA ERS); and soil moisture devices for water-cost control where USDA hasn't yet published a national adoption benchmark. The durable approach is not to trust any single year's adoption or market-size figure indefinitely, but to re-check USDA NASS QuickStats each spring, watch USDA ERS Charts of Note for the next Census of Agriculture refresh in 2029, and run your own field-scale comparison — using the calculator above for the wireless-versus-satellite cost tradeoff — before committing budget to any one layer.
Explore Farmonaut's satellite and AI-powered monitoring tools to see the software-only layer of this stack in action on your own fields.

 Godrej Agrovet
 Hayleys Agriculture
 Linx Agritech
 Adinet
 Save Your Soils
 GalaxEye Space
 Grandstream Algérie
 XOS Realty
 Geospatial Lab Africa
 Agro La Gándara
 HIPSAC
 ZOL Zimbabwe
 Juligerm
 AdBio
AdBio MISE Maroc
 NWNS
NWNS Red August Group
 Farm Inc
 WeMe Global
 Agrotoken
 Blue BearX
 Insignito
 DnCubed
 Indosistim Teknologi
 Liquify Digital
 CU Foods
 BeyondTech Global
 Rouge VC
 AgroRisk
 Oath Inc
 Esri North East Africa
 MDCV UK
 Etech Consulting Madagascar
 Vestlandsforsking
 WB Dev
 Sama Premium
 Tres Valles
 Blickwinkel
 Agricultural Credit Policy Council
 eKGIS
eKGIS Mostas Tech
 Andex
Andex Deluxe Conseil
 WICO
WICO Chimera Innovation
 SkyHarvest
 Teledarbas
 Exurbia Geospatial
 FieldZero
