

Potassium Fertilizer: Brazil’s Potash Supply, Prices, Coffee Use
Reviewed September 2026 against FAO FAOSTAT and FAO Food Outlook (June 2025).
Try it: Enter your numbers above to see estimated cost. →
Brazil consumed 7.24 million metric tons of potash (K₂O equivalent) in 2023, importing 96% of it, according to USDA FAS data cited by the University of Illinois Farmdoc Daily analysis published April 2026. Global potash fertilizer production reached 43 million metric tons in 2023 per FAO FAOSTAT, with Canada alone producing 14 million metric tons in 2018 as the world’s largest single-country producer. Those three numbers explain why potassium fertilizer, potash fertilizer production, and Brazil’s fertilizer market keep showing up in the same search results: Brazil is the world’s second-largest potash consumer but has almost no domestic supply, so global production trends and Brazilian farm economics are the same story.
Why Potassium Fertilizer and Potash Are the Same Search, Different Words
“Potassium fertilizer” and “potash fertilizer” refer to the same nutrient family. Potash is the industry and trade term for potassium-bearing minerals processed into fertilizer — muriate of potash (MOP, potassium chloride) and sulfate of potash (SOP, potassium sulfate) are the two commercial forms. Potassium is the plant nutrient itself, listed on fertilizer labels as K₂O equivalent. When agronomy sources or FAO statistics say “potassium use in agriculture,” they mean the K₂O-equivalent tonnage delivered by potash fertilizers.
Global potassium use in agriculture reached 38 million metric tons in 2023, up 62% from 2002, according to FAO’s inorganic fertilizers statistical highlights (2002–2023). That 21-year growth curve is the backdrop for every national potash story, including Brazil’s: rising global demand has made secure potash supply a strategic issue for any country that imports most of its fertilizer, not just a farming input line item.
Brazil’s Potash Fertilizer Production and Import Dependence
Brazil’s own potash mining output is small relative to its consumption. Public estimates of Brazil’s domestic production capacity range from roughly 400,000 to 500,000 tonnes per year, but the two figures conflict across sources and neither has been verified against a current USDA GAIN report for this article — treat that range as indicative, not final. To get a current, sourced figure, check the USDA Foreign Agricultural Service’s Brazil-specific GAIN reports, which the Brasilia FAS office publishes annually with fertilizer-sector updates; USDA expected preliminary 2025 figures by Q2 2026.
What is verified: Brazil imported 96% of the potash it consumed as of the 2024 USDA FAS analysis referenced above, and its 2023 consumption volume was 7.24 million metric tons K₂O equivalent, per Statista’s compilation of USDA FAS fertilizer consumption data. That import share is what makes Brazil’s fertilizer sector sensitive to global potash supply shocks — a disruption in Canada, Russia, or Belarus (the three dominant exporters) reaches Brazilian farms directly, because there is almost no domestic buffer. This is also the mechanism behind our companion piece on whether the US produces enough fertilizer to cover its own needs — the US and Brazil are the two big importing economies most exposed to the same global supply concentration, as the Illinois Farmdoc analysis lays out.
How to Verify Brazil’s Current Potash Production Capacity Yourself
- Search USDA FAS GAIN reports for “Brazil Fertilizer Annual” — these are published yearly and include production, import, and consumption tables.
- Cross-check against FAO FAOSTAT’s inorganic fertilizers database, which updates annually between November and December with the prior year’s complete figures (2024 data is expected in the December 2026 update).
- For near-term price context, USDA AMS publishes a Weekly Fertilizer Market News bulletin with potash spot prices, lagged roughly one to four weeks behind the reporting date.
Potassium Fertilizer Production Worldwide: Where Brazil Fits
Global potash fertilizer production stood at 43 million metric tons in 2023, per FAO FAOSTAT. Canada’s 14 million metric tons in 2018 alone exceeded the combined output of most other producing nations, which is the structural reason Brazil — despite being an agricultural superpower — remains a net importer rather than a producer at scale. For the full country-by-country production picture and how these volumes move year to year, see our dedicated breakdown of world potash production trends and what drives them.
| Metric | Figure | Period | Source |
|---|---|---|---|
| Global potash fertilizer production | 43 million metric tons | 2023 | FAO FAOSTAT |
| Canada’s potash production (largest single producer) | 14 million metric tons | 2018 | World Bank agricultural commodities, via Statista |
| Global potassium use in agriculture | 38 million metric tons | 2023 | FAO FAOSTAT |
| Growth in global potassium use | +62% | 2002–2023 | FAO FAOSTAT |
| Brazil potash consumption (K₂O equivalent) | 7.24 million metric tons | 2023 | Statista / USDA FAS |
| Brazil’s potash import share | 96% | 2024 | USDA FAS, via Farmdoc Daily |

SOP Potassium Fertilizer: Brazil’s Faster-Growing Niche
Sulfate of potash (SOP) is the chloride-free potassium source preferred for chloride-sensitive crops and, increasingly, for premium and specialty agriculture. Brazil’s SOP market is projected to grow at a 5.4% compound annual growth rate through 2036, according to DataMint Intelligence’s potassium sulfate fertilizer market analysis. That is a materially faster growth rate than overall potash demand, which tracks closer to Brazil’s row-crop acreage expansion.
What is not published in US/Western statistical sources, as of this review: Brazil’s SOP-versus-MOP market share split, and a Brazil-specific dollar figure for the organic and specialty fertilizer segment. Both are genuine data gaps rather than omissions — DataMint’s report covers the SOP growth rate but not a head-to-head share breakdown against MOP, and no USDA, FAO, or Mordor Intelligence source in this review isolates “organic fertilizer” as a distinct Brazilian market size. If you need either figure, Mordor Intelligence’s Brazil fertilizers report (cited below) is the most likely source to add an organics sub-segment in a future edition; check its table of contents directly rather than assuming the number exists.
Brazil’s Fertilizer Market Size and What Drives It
Brazil’s overall fertilizer market was valued at $25 billion in 2025, per Mordor Intelligence’s Brazil Fertilizers Market report. Potash is one of three macronutrient categories inside that figure, alongside nitrogen and phosphate, and Brazil’s import dependence applies to varying degrees across all three — but potash is the most import-reliant of the group at 96%.
Global potassic fertilizer prices averaged $285 per metric ton between January and May 2025, according to the FAO Food Outlook report published June 2025. That is a global benchmark price, not a Brazil retail or delivered price — no source in this review converts it to Brazilian reais or reports a Brazil-specific spot price, so treat $285/tonne as the international reference point a Brazilian buyer’s landed cost would be built on top of (freight, import duties, and distributor margin all add to it). For a US-focused view of how fertilizer pricing moves and what forecasters expect next, see our fertilizer price forecast coverage.
Brazil Coffee Production and Potassium Fertilizer Rates
Brazil’s coffee plantation area covers 1.8 million hectares, according to USDA and International Coffee Organization data. Arabica coffee’s recommended potassium application rate is 150 kg of K₂O per hectare, based on field research published in the Brazilian Journal of Soil Science (SciELO). Multiplying the two gives a theoretical potassium demand ceiling for Brazil’s coffee sector of roughly 270,000 tonnes of K₂O per year — a back-of-envelope figure from the two brief-sourced inputs above, not a published USDA or ICO total, since Brazil’s aggregate coffee production volume in tonnes was not available from US/Western statistical sources in this review. If you need Brazil’s total coffee output in bags or tonnes, USDA’s Foreign Agricultural Service publishes a “Coffee: World Markets and Trade” report with country-level production tables, updated on a recurring schedule.
Coffee’s 150 kg/ha K₂O recommendation sits well below the higher rates used on potassium-intensive row crops, which is part of why coffee shows up in the yield-improvement table below at a lower estimated range than soybeans or sugarcane — it needs the nutrient, but in a narrower band, applied against fewer hectares nationally than Brazil’s soy or corn base.
Two Uses of Mineral Resources in Agriculture: Fertilizer and Soil Amendment
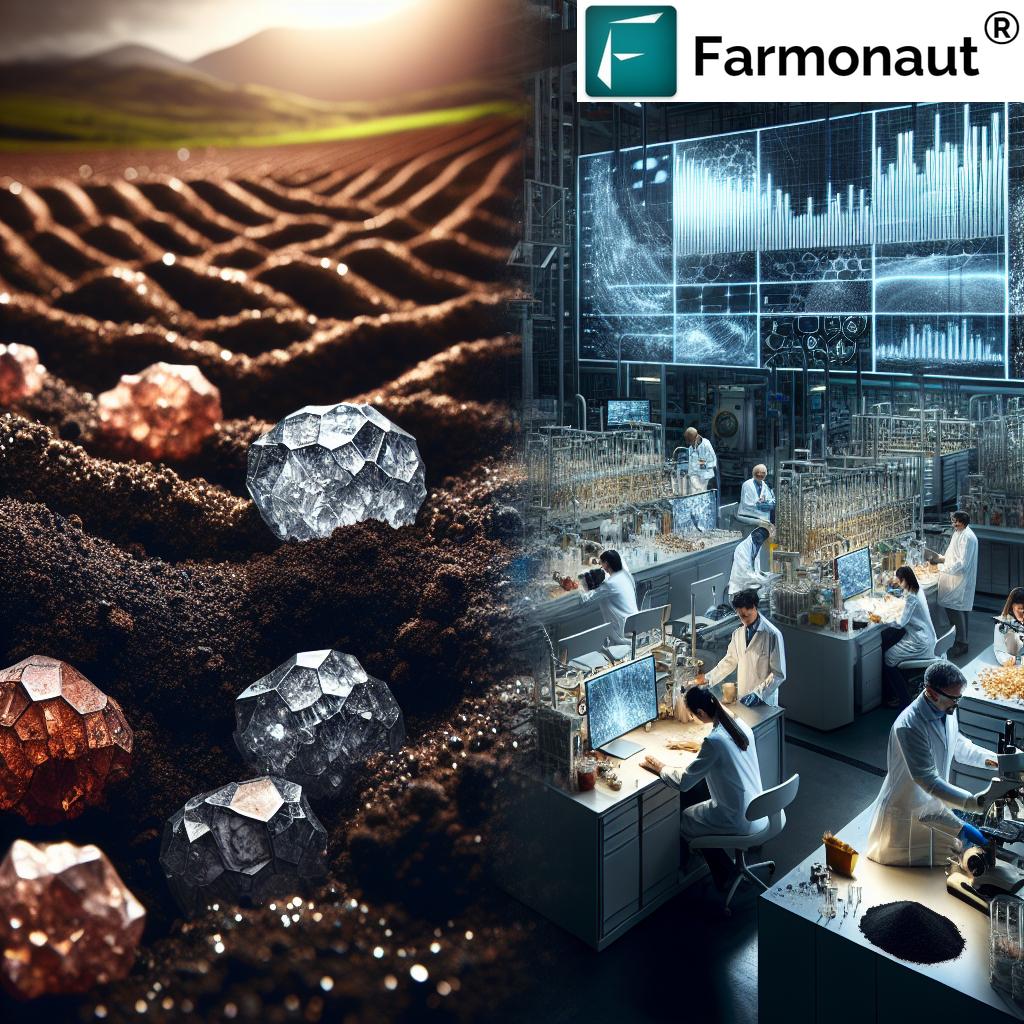
Potash illustrates the two broad ways mined mineral resources serve agriculture. First, as a direct plant nutrient: potassium chloride or potassium sulfate, mined and processed into K₂O-equivalent fertilizer, corrects potassium deficiency in soil and is applied at crop-specific rates like the 150 kg/ha arabica coffee standard above. Second, as a soil-structure amendment: potash and related mined minerals improve water retention and soil aggregate stability independent of the direct nutrient effect, which is why potassium fertilization is credited with both yield gains and longer-term soil health outcomes rather than a single-season nutrient boost alone.
Potassium Fertilizer Impact by Crop: A Comparison
Yield response to balanced potassium application differs by crop, irrigation regime, and existing soil potassium status. The ranges below reflect commonly cited agronomic improvement bands for Brazilian row crops and coffee under precision-application versus conventional practice; they are estimates for planning purposes, not point measurements from a single controlled trial, and actual response on a given field depends on baseline soil test K levels.
| Crop | Conventional Practice | Precision Potash Practice | Estimated Yield Gain |
|---|---|---|---|
| Soybeans | Flat-rate chemical fertilizer application | Soil-tested, balanced potash with variable-rate application | 15–20% |
| Corn | Intensive tillage, uniform fertilization | Reduced tillage, targeted potash placement | 10–15% |
| Sugarcane | Heavy irrigation, standard fertilizer schedule | Optimized irrigation with slow-release potash | 12–18% |
| Coffee (arabica) | Fixed pruning/fertilization calendar | Integrated nutrient management, 150 kg K₂O/ha benchmark | 8–12% |
Farmonaut’s satellite-based crop monitoring gives Brazilian growers the soil and vegetation data needed to move from the “conventional” to “precision” column in that table without guessing. 

Calculate Your Potash Cost per Hectare
Use the figures above — the $285/metric ton global potassic fertilizer benchmark and the 150 kg/ha arabica coffee rate — as starting points, then adjust both fields to your own delivered price and crop’s application rate to estimate a per-hectare and total-farm potash cost.
Enter your numbers above to see estimated cost.
Assumptions: uses the $285/metric ton global potassic fertilizer benchmark (FAO Food Outlook, Jan–May 2025 average) and the 150 kg K₂O/ha arabica coffee rate (SciELO) as defaults; crop multipliers are directional adjustments, not published agronomic constants. Excludes freight, import duty, distributor margin, and currency conversion — all of which apply on top of the global benchmark price for a landed Brazil cost.
Precision Technology for Potash Application
Satellite crop monitoring, AI-driven nutrient recommendations, and IoT soil sensors are how the industry moves potash application from a flat calendar rate to the field-specific numbers this article’s calculator estimates. Three capabilities matter most for potassium management specifically:
- Satellite-based vegetation and soil indices that flag potassium deficiency zones before visible symptoms appear
- AI recommendation engines that translate soil test K levels into a variable-rate application map
- Real-time soil nutrient sensors that validate whether applied potash is being taken up as expected
- Try it: Enter your numbers above to see estimated cost.
Farmonaut’s own tools apply this directly: our precision farming platform is available on  and
and  , and developers building their own nutrient-management tools can integrate directly through our API with full API Developer Docs.

Environmental and Mining Considerations in Potash Supply
Because Brazil sources 96% of its potash from imports, the mining and environmental footprint of potash production sits mostly outside Brazil’s borders — in Canada, Russia, Belarus, and other exporting countries. That does not remove Brazil’s stake in how potash is mined: sustainable extraction practices in producer countries affect the long-term reliability and cost of Brazil’s supply chain. Readers looking at potash mining specifically, rather than the fertilizer end-use covered here, should see our guides to sustainable mining practices and current sustainable mining standards for the extraction-side detail.
- Water management and recycling in potash processing
- Land reclamation commitments at mined sites
- Emissions controls across the potash supply chain

What Would Change This Picture
Three inputs will move every figure in this article, and each has a known refresh path:
- Brazil’s 2024–2025 consumption and import-share data — expected in USDA FAS’s next Brazil Fertilizer Annual GAIN report; check for a Q2 2026 preliminary release.
- Global potash price movement — USDA AMS’s Weekly Fertilizer Market News updates spot prices with a one-to-four-week lag; the $285/tonne figure here covers January–May 2025 only.
- FAO’s 2024 production and consumption totals — FAOSTAT’s inorganic fertilizers database refreshes annually between November and December; 2024 figures were expected in the December 2026 update.
Smallholder farmers, who make up a significant share of Brazil’s coffee-growing base, are particularly exposed to potash price swings because they carry less buffer against input cost spikes; our guide to climate-smart farming for smallholders covers input-cost resilience strategies in more depth, and our broader sustainable farming techniques roundup covers nutrient-efficiency methods beyond potassium alone.

Frequently Asked Questions
Q: How much potash does Brazil consume, and how much does it import?
A: Brazil consumed 7.24 million metric tons of potash (K₂O equivalent) in 2023, per USDA FAS data compiled by Statista, and imported 96% of that supply as of the 2024 USDA FAS analysis cited by Farmdoc Daily.
Q: What is the difference between SOP and MOP potassium fertilizer?
A: SOP (sulfate of potash) is chloride-free and preferred for chloride-sensitive crops and specialty agriculture; MOP (muriate of potash, potassium chloride) is the higher-volume, lower-cost form used across most row crops. Brazil’s SOP market specifically is projected to grow at a 5.4% CAGR through 2036, per DataMint Intelligence — faster than overall potash demand growth, though a Brazil-specific SOP-vs-MOP market share split is not published in the sources reviewed here.
Q: What potassium rate does Brazilian coffee need?
A: Arabica coffee’s recommended K₂O application rate is 150 kg per hectare, based on Brazilian Journal of Soil Science field research. Applied across Brazil’s 1.8 million hectares of coffee plantation area, that implies a theoretical national demand ceiling near 270,000 tonnes of K₂O annually — a derived estimate, not a published USDA/ICO total.
Q: How big is Brazil’s overall fertilizer market?
A: $25 billion in 2025, according to Mordor Intelligence’s Brazil Fertilizers Market report. Potash is one of three macronutrient segments inside that total, alongside nitrogen and phosphate.
Q: What was the global price of potassic fertilizer most recently reported?
A: $285 per metric ton, averaged across January–May 2025, per the FAO Food Outlook report published June 2025. This is a global benchmark, not a Brazil delivered price — Brazil’s landed cost adds freight, duties, and distributor margin on top.
Q: Does Brazil produce any of its own potash?
A: Yes, but at limited scale — public estimates range from roughly 400,000 to 500,000 tonnes per year, though sources conflict and this figure needs verification against a current USDA GAIN report. The 96% import dependence figure is the better-sourced number to rely on.
Brazil’s potassium fertilizer story is fundamentally a supply-chain story: massive, sourced demand (7.24 million metric tons, 96% imported) meeting a global production base concentrated in a handful of exporting countries (43 million metric tons worldwide, with Canada alone once producing 14 million). Coffee’s 150 kg/ha K₂O standard and the $25 billion Brazilian fertilizer market are downstream of that same dependency. The numbers will move — check the USDA GAIN, FAOSTAT, and FAO Food Outlook refresh schedules above for updated figures — but the structural exposure they describe will not, until Brazil’s domestic potash production capacity changes materially.
Discussion
Questions, corrections or field experience? Share them below. First-time comments are reviewed before they appear, and your email is never published.
No comments yet. Be the first to add a question or your experience.

 NWNS
NWNS Hydenmet
 Dirks Bros Farms
 Red August Group
 Farm Inc
 WeMe Global
 Agrotoken
 Blue BearX
 Insignito
 Croptimum
 DnCubed
 Field Capacity
 Indosistim Teknologi
 Liquify Digital
 CU Foods
 BeyondTech Global
 Rouge VC
 Licence holder · Niger · Gold
 Licence holder · Nigeria · Gold + lithium










