

Reviewed September 2026 against USDA NASS Florida Statistics and USDA SARE state fact sheets.
Try it: Run your own numbers →
Agriculture Grants Florida: Land, Jobs & Sustainable Growth
Florida has 44,400 farms and ranches working 9.7 million acres, generating $9.24 billion in cash receipts in 2023, per USDA NASS. Agriculture grants in Florida run through federal programs like USDA SARE (Florida’s total: $11,424,587 across 236 projects since 1988) and FSA beginning-farmer loans (up to $600,000, 5% down, 40-year terms), not through a dedicated “free land” giveaway — no such program exists at the state or federal level. This page maps the real grant sources, the land-access routes, and where agriculture jobs Florida-wide are actually posted.



Table of Contents
- Florida’s Agricultural Landscape by the Numbers
- Free Land Grants in Florida: What Actually Exists
- USDA Land Grants and Beginning Farmer Loans
- Florida Farm Grants: SARE, EQIP, and State Cost-Share
- Comparative Table: Grants, Land, and Loan Terms
- Accessing Florida Agricultural Land
- Sustainable Land Investments in Florida
- Agriculture Jobs in Florida — and in Europe
- Beginning Farmer Loan Calculator
- Farm Management & Monitoring with Farmonaut
- Tips for Securing Agriculture Grants in Florida
- FAQ: Florida Agriculture Grants & Land
- Conclusion
- Try it: Run your own numbers
Florida’s Agricultural Landscape by the Numbers
USDA NASS’s Florida 2024 Statistical Bulletin counts 44,400 farms and ranches working 9.7 million acres of land statewide. That acreage supports citrus groves, cattle pasture, row crops, and specialty operations that together produced $9.24 billion in cash receipts in 2023 — the most recent year NASS has finalized for the state (USDA NASS Florida Statistics). Within that total, berries, spring potatoes, vegetables, and watermelons alone were valued at $3 billion in 2024.
These are the figures that matter to anyone searching for agriculture grants Florida, florida farm grants, or usda land grants: the state’s farm economy is large and diversified, but grant funding into it is modest and program-specific, not a blanket cash program. The rest of this page separates what is real — SARE research grants, FSA loans, EQIP cost-share — from what is not: there is no dedicated “free land” grant program for Florida, federal or state.

Free Land Grants in Florida: What Actually Exists
Searches for free land grants in florida are common, and the honest answer is that no dedicated program handing out free farmland exists at the federal or Florida state level. What exists instead are three adjacent mechanisms, and confusing them with a “free land” giveaway is the single most common mistake in this search:
- Land leasing — public agricultural land made available to qualified operators through competitive bidding, not a grant.
- Conservation easements — landowners are paid (via appraisal-based valuation) to restrict future development rights, while retaining ownership and farming use. This is compensation for a restriction, not free land.
- Low-down-payment federal loans — USDA FSA’s direct farm ownership loan requires as little as 5% down, financing the rest over up to 40 years (USDA Farm Service Agency, 2025). That is the closest federal mechanism to “affordable land access” for a beginning farmer, and it is a loan you repay, not a grant.
If a website or listing describes itself as a “free land grant” program specific to Florida, that claim does not match anything published by USDA, FSA, or FDACS as of this review. The safest verification path is to check directly with your county FSA office or FDACS Grant Opportunities before acting on any third-party claim.
USDA Land Grants and Beginning Farmer Loans
The query usda land grants most often resolves, in practice, to USDA’s direct farm ownership loan program for beginning farmers and ranchers. As of the USDA Farm Service Agency’s 2025 fact sheet, the terms are:
- Maximum loan amount: $600,000
- Minimum down payment: 5% of purchase price
- Maximum repayment term: 40 years
This program is administered county-by-county, and FSA updates loan limits annually as fiscal-year budgets are set — typically released in the October–November window. If you are reading this more than a year after the review date above, confirm the current maximum and interest rate at Farmers.gov Loan Programs or your local FSA office before budgeting against the $600,000 figure, since it is a policy number Congress and USDA can revise.
Separately, USDA’s Natural Resources Conservation Service runs the Environmental Quality Incentives Program (EQIP), a cost-share grant (not a loan) for conservation practices — irrigation efficiency, soil health, nutrient management — on land already in production. EQIP funding caps and Florida’s specific annual allocation are not published as a fixed snapshot figure; the amount available changes by fiscal year and by NRCS state office decision, so the correct method is to contact your local NRCS office or check USDA FSA Florida State Programs for the current cycle rather than relying on a prior year’s cap.

Florida Farm Grants: SARE, EQIP, and State Cost-Share
For florida farm grants specifically, the most transparent, trackable federal source is USDA’s Sustainable Agriculture Research and Education (SARE) program. Florida’s SARE fact sheet shows $11,424,587 in cumulative grant funding across 236 funded projects between 1988 and the program’s most recent reporting update (USDA SARE Florida State Fact Sheet). These are competitive research and education grants — farmer-rancher grants, professional development grants, and graduate student research grants — awarded to individual applicants and institutions, not a lump payment to the state.
Alongside SARE, the Florida Department of Agriculture and Consumer Services (FDACS) runs a Best Management Practices cost-share program that offsets a share of the cost of adopting nutrient and water-conservation practices; the exact reimbursement percentage and annual budget are set by FDACS on a rolling basis, so check the current terms at FDACS Grant Opportunities rather than a fixed number here. For sector context on where Florida agriculture is headed and what FDACS prioritizes, see the Agriculture and Consumer Services trends guide.
Comparative Table: Grants, Land, and Loan Terms
| Program | Type | Amount / Terms | Source & Vintage |
|---|---|---|---|
| USDA SARE (Florida cumulative) | Competitive research/education grant | $11,424,587 total, 236 projects | USDA SARE, 1988–2026 |
| USDA FSA Direct Farm Ownership Loan | Loan (not a grant) | Up to $600,000; 5% down; 40-year term | USDA FSA, 2025 fact sheet |
| USDA NRCS EQIP | Cost-share grant | Annual cap set by fiscal year; not fixed publicly | Check current cycle with local NRCS office |
| FDACS BMP Cost-Share | State cost-share | Reimbursement rate set by FDACS; rolling applications | FDACS Grant Opportunities, current cycle |
| “Free land grants” (Florida) | Not a real program | No dedicated federal or state program identified | Verify any specific claim with FDACS/FSA directly |

Accessing Florida Agricultural Land
Florida’s 9.7 million acres of farmed land span citrus groves, row crops (sweet corn, tomatoes, peppers, sugarcane), cattle pasture, and specialty operations like blueberries and hydroponics. Routes into that land, ranked by how commonly they’re actually used:
- State and federal leasing — competitive access to public agricultural land for farming, conservation, or pasture use.
- Conservation easements — appraisal-valued compensation for restricting development rights while retaining farming use; administered through programs like Florida’s Rural and Family Lands Protection Program.
- Direct purchase financed by an FSA loan — up to $600,000, 5% down, 40-year term, as detailed above.
- Cooperative or family ownership — pooled capital across a family or group to reach acreage individual buyers couldn’t finance alone.
For a deeper look at how Florida’s cropping mix maps onto its regions, see What is Florida’s Agriculture? Key Crops & Map Guide and Agriculture of Florida: 7 Trends in Florida Agriculture Land. Timberland owners specifically should review Sustainable Timberland: 7 Steps for Ecological Forestry for reforestation and wildfire-mitigation practices tied to grant eligibility.

Sustainable Land Investments in Florida
For sustainable land investments in florida, the practical entry points are the same conservation and cost-share mechanisms covered above, applied with an investment lens rather than an operating-farm lens. An investor evaluating Florida farmland should weigh:
- Cash receipt trend: $9.24 billion statewide in 2023, with high-value specialty crops (berries, vegetables, watermelons) at $3 billion in 2024 — a signal of where per-acre returns concentrate.
- Conservation easement value: set by independent appraisal per parcel, not a published statewide rate; get a local appraisal before modeling returns.
- Water rights and zoning: the most common reason land deals or grant applications fail in Florida is a mismatch between the parcel’s water allocation/zoning and the intended use.
- BMP cost-share eligibility: land already enrolled in FDACS Best Management Practices can offset future infrastructure costs, which affects resale value to the next operator.
None of this substitutes for a title search, water-management-district review, and a current NASS Quick Stats pull for the specific county — USDA NASS Florida Statistics is the source to query directly for county-level, current-year figures rather than relying on any single article’s snapshot.
Agriculture Jobs in Florida — and in Europe
On agriculture jobs in florida: the most recent Florida-specific labor figure isolates the landscaping services sector, not farm production broadly. The Florida Department of Agriculture & Consumer Services, citing UF/IFAS analysis, put landscaping services employment at 73,382 workers earning $2.30 billion in wages in 2014 — the most recent year this specific breakout is published (FDACS Agriculture Overview and Statistics). A current, farm-production-only employment figure for Florida is not published in the latest NASS labor surveys; NASS’s broader “agriculture, natural resources and food” category last reported 1.56 million jobs statewide in 2014, up 29% from 2001, but that spans far more than farm production. For a current count, the correct method is to query the Florida Department of Economic Opportunity’s industry employment data or the U.S. Bureau of Labor Statistics’ Quarterly Census of Employment and Wages by NAICS code for Florida’s crop and animal production sectors directly.
On agriculture jobs europe: Florida-focused USDA and FDACS data sources do not cover European labor markets, and this page’s research brief carries no European agricultural employment figures. Readers comparing opportunities across the Atlantic should query Eurostat’s agricultural labor force statistics or the national statistics agency of the specific EU member state in question — those are the authoritative, current sources, and no comparable figure exists in this brief to cite responsibly.

Beginning Farmer Loan Calculator
Use the FSA direct farm ownership loan terms above to see how down payment size and repayment term change your monthly payment.
Run your own numbers
Assumptions: standard fixed-rate amortization; does not include closing costs, taxes, insurance, or FSA guarantee fees; does not model FSA joint financing arrangements or beginning-farmer down-payment loan programs that can reduce the cash down payment further. Confirm current rates and terms with your local FSA office, since both change by fiscal year.
Farm Management & Monitoring with Farmonaut
Grant-funded and loan-financed operations both come with reporting obligations — EQIP and BMP cost-share require documented outcomes, and FSA loan servicing benefits from clear yield and land-use records. Farmonaut’s satellite and AI tools support that reporting layer directly:
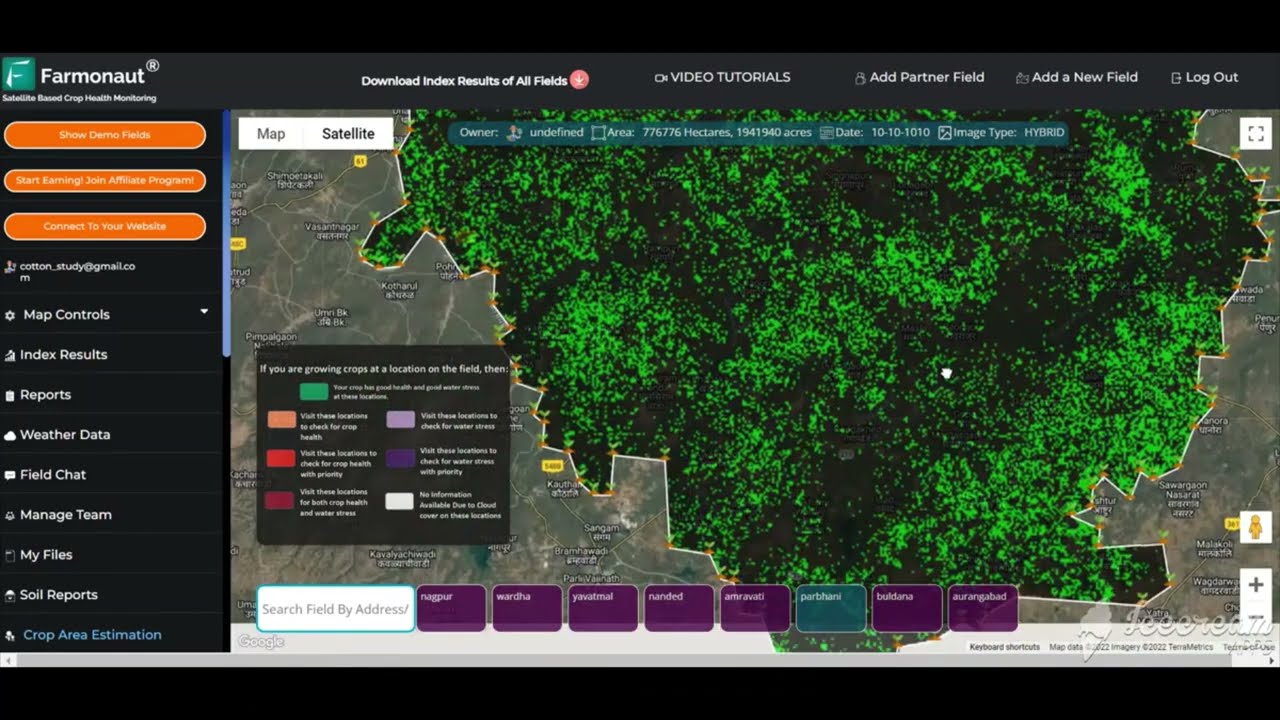
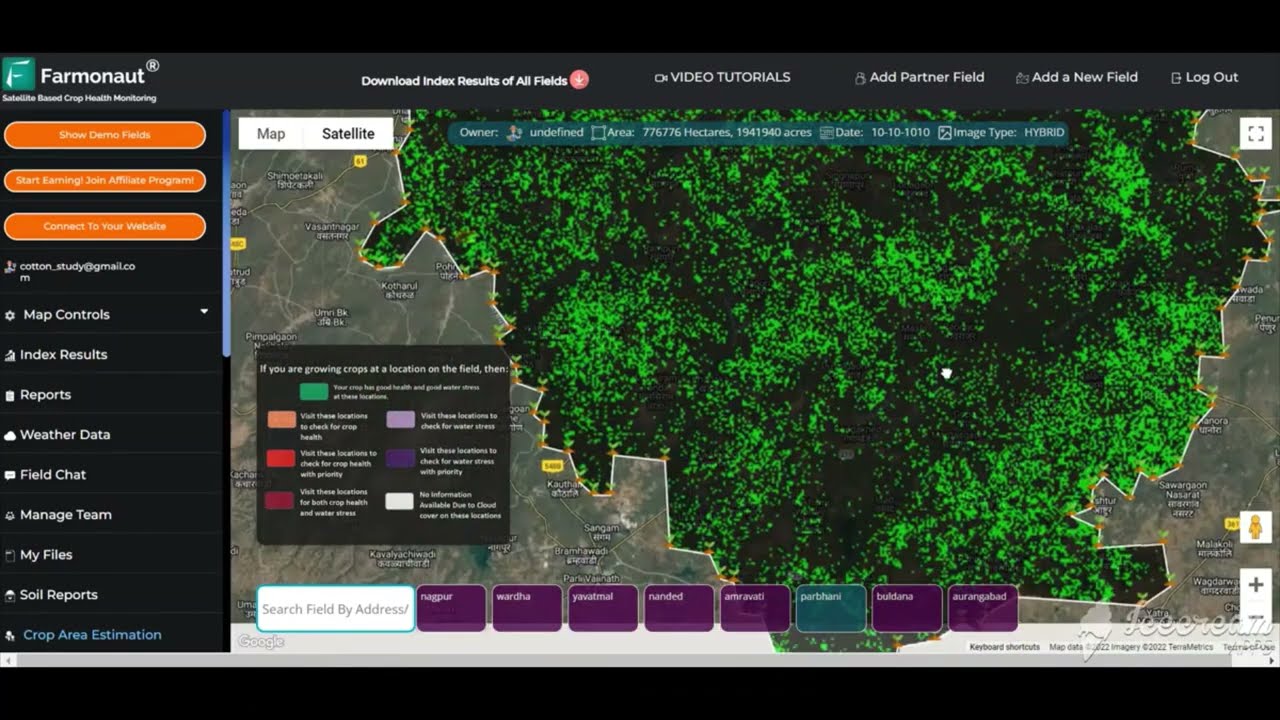
- 📊 Satellite Crop Health Monitoring: NDVI and multispectral data to inform irrigation, nutrient, and pest decisions on Florida acreage.
- 🚜 Resource Management: Farmonaut Fleet Management for equipment and logistics across a farm’s full acreage.
- 🔒 Blockchain Traceability: Farmonaut Traceability Solutions for supply-chain transparency from field to buyer.
- 🌍 Environmental Impact Tracking: Carbon Footprinting for measuring sustainability outcomes relevant to grant reporting.
- 💼 API and App Integration: Farmonaut API and Developer Docs for building satellite data into your own operation’s systems.
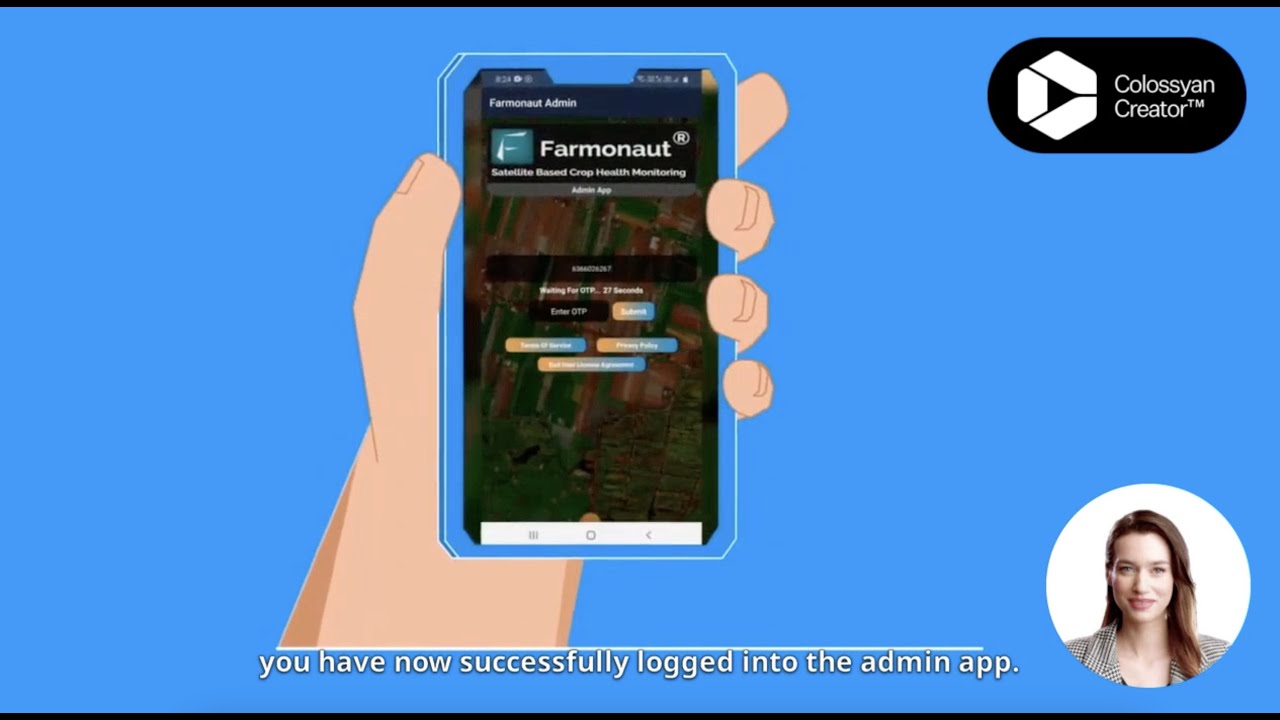
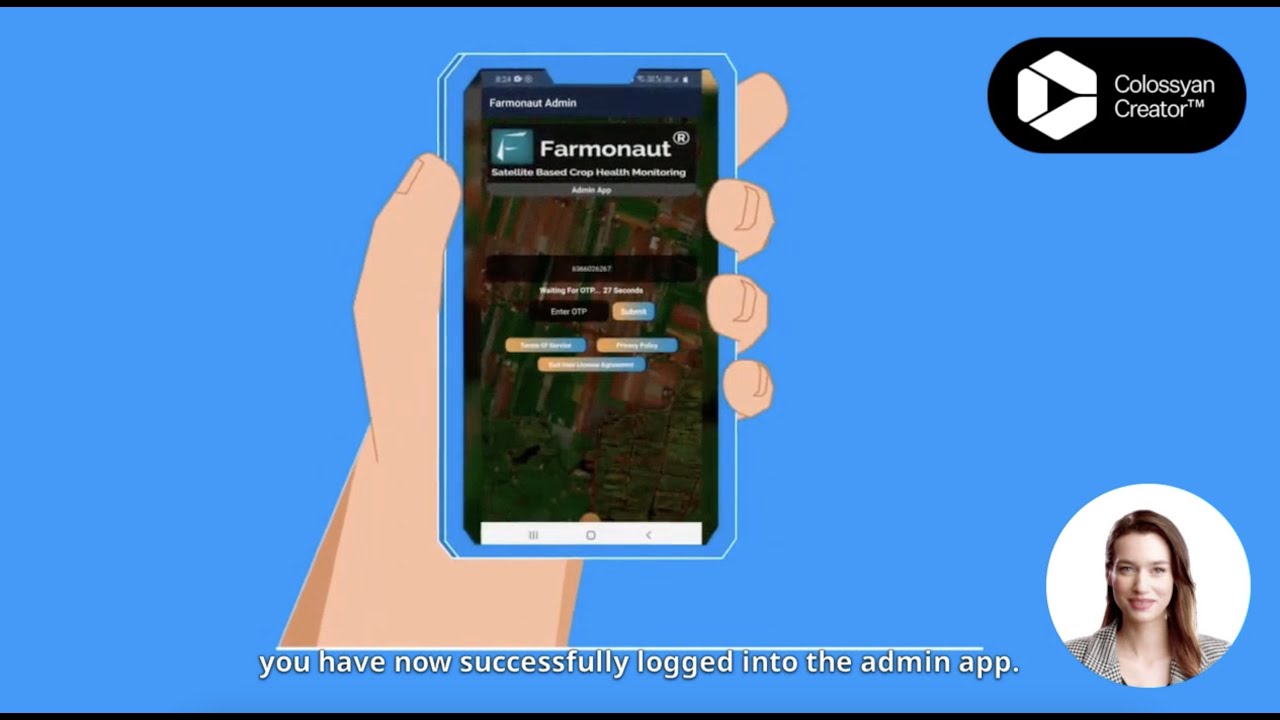
Through the Farmonaut app, web, and API platforms, operators can track project progress and generate the documentation that grant and loan compliance reviews ask for.
- ✔ Support grant reporting with real-time environmental and yield data
- ✔ Plan land use around conservation and BMP eligibility requirements
- ✔ Manage large-scale operations — see Large Scale Farm Management Tool
Tips for Securing Agriculture Grants in Florida
- Match the program to the need: SARE for research/education, EQIP/BMP for capital conservation costs, FSA loans for land purchase — applying to the wrong category is the most common rejection cause.
- Verify current-cycle numbers: EQIP caps, FDACS reimbursement rates, and FSA loan terms all change by fiscal year. Confirm this cycle’s figures at USDA FSA Florida State Programs before budgeting.
- Screen for zoning and water rights first: a parcel’s water allocation and zoning status has to match the grant’s land-use requirement before you apply, not after.
- Document outcomes: quantify expected soil-health, water-use, or yield changes — reviewers score measurable commitments higher than general statements.
- Engage extension agents early: county extension offices can flag eligibility issues before submission, saving a review cycle.
Frequently Asked Questions: Florida Agriculture Grants & Land
A: No dedicated federal or Florida state program handing out free farmland was found in this review. What exists are competitive leases, appraisal-compensated conservation easements, and FSA loans with a 5% minimum down payment — verify any specific “free land” claim directly with FDACS or your county FSA office.
A: $600,000, with a minimum 5% down payment and up to a 40-year repayment term, per USDA FSA’s 2025 fact sheet. Confirm the current figure with your local FSA office, since limits are set annually.
A: $11,424,587 across 236 funded projects from 1988 through the program’s latest reporting update, per USDA SARE’s Florida state fact sheet.
A: A current, farm-production-only figure is not published. The most recent specific breakout is 73,382 landscaping services employees earning $2.30 billion in wages in 2014 (FDACS/UF/IFAS); for current counts, query the Florida Department of Economic Opportunity or BLS QCEW data by NAICS code.
A: No — this page’s data sources (USDA, FDACS) cover Florida only. For European agricultural labor figures, query Eurostat or the relevant national statistics agency directly.
A: State and federal leasing programs, conservation easements, FSA-financed purchase, and cooperative ownership are the four main routes — see Agriculture of Florida: 7 Trends in Florida Agriculture Land.
A: Satellite-based platforms like Farmonaut track NDVI, water use, and environmental metrics in real time for grant and loan compliance documentation.





Conclusion
Florida’s 44,400 farms across 9.7 million acres and $9.24 billion in 2023 cash receipts sit behind a grant and land-access landscape that is real but narrower than “free land” searches suggest: SARE’s $11.4 million in cumulative research funding, FSA’s $600,000 loan ceiling at 5% down, and FDACS’s rolling cost-share programs are the actual mechanisms. There is no dedicated free-land program — verify any such claim against FDACS and FSA before acting on it. Whatever stage you’re at — financing a purchase, applying for cost-share, or documenting outcomes for compliance — Farmonaut’s satellite monitoring tools help keep the paper trail current as the underlying numbers change year to year.

 Godrej Agrovet
 Hayleys Agriculture
 Linx Agritech
 Adinet
 Save Your Soils
 GalaxEye Space
 Grandstream Algérie
 XOS Realty
 Geospatial Lab Africa
 Agro La Gándara
 HIPSAC
 ZOL Zimbabwe
 Juligerm
 AdBio
AdBio MISE Maroc
 NWNS
NWNS Red August Group
 Farm Inc
 WeMe Global
 Agrotoken
 Blue BearX
 Insignito
 DnCubed
 Indosistim Teknologi
 Liquify Digital
 CU Foods
 BeyondTech Global
 Rouge VC
 AgroRisk
 Oath Inc
 Esri North East Africa
 MDCV UK
 Etech Consulting Madagascar
 Vestlandsforsking
 WB Dev
 Sama Premium
 Tres Valles
 Blickwinkel
 Agricultural Credit Policy Council
 eKGIS
eKGIS Mostas Tech
 Andex
Andex Deluxe Conseil
 WICO
WICO Chimera Innovation
 SkyHarvest
 Teledarbas
 Exurbia Geospatial
 FieldZero
