

Reviewed against USDA NASS almond forecasts, peer-reviewed research, Project Apis m. and NPR reporting on California beekeeping.
Try it: Run your own numbers →
Do Almond Trees Kill Bees? The Short Answer
Almond trees don’t poison bees on contact, but California’s almond industry does drive some of the highest managed-colony mortality in US beekeeping. Almond pollination is the largest pollination event in the US, drawing more than 60% of the country’s managed honeybee colonies to California each bloom, according to a 2017 study in Scientific Reports. Across the whole year, commercial beekeepers treat losing about 30% of colonies as normal, per NPR; that is a national annual figure, not an almond-season death rate. The worst year on record came in 2024–25, when commercial beekeepers lost an average of 62% of their colonies between June and February, per a Project Apis m. survey reported by Capital Press.
So “almonds killing bees” overstates a simple cause but understates a real problem: this is the largest managed pollination event in the US, and it stresses bee colonies through several distinct, well-documented channels — pesticide exposure, forage scarcity, transport stress, and disease transmission from crowding. This article walks through what’s measured, what’s a genuine gap in the public data, and what growers and beekeepers can do about each risk in almond cultivation operations of any scale.
How Many Bees Die for Almonds?
No agency counts bee deaths inside almond orchards. What is measured is colony loss over the year, and almond bloom sits in the middle of it. Most US commercial colonies go to California each February, so a bad almond season shows up in national loss figures.
| Measure | Figure | Source |
|---|---|---|
| Normal annual loss, commercial colonies | About 30% | NPR, April 2025 |
| Average loss, June 2024 to February 2025 | 62%, the highest recorded | Project Apis m. survey via Capital Press |
| Hives lost by 702 survey respondents | About 1.12 million | Capital Press |
| Hives lost nationwide | About 1.6 million | KVPR |
| Estimated cost to beekeepers through almond bloom | $635 million | Capital Press |
What killed them? USDA sampled 120 colonies in California in January and early February 2025. It linked the collapses, at least in part, to deformed wing virus A and B and acute bee paralysis virus, all spread by Varroa mites. A genetic marker for resistance to the miticide amitraz turned up in all collected mites. Pesticide residue results were still pending in June 2025, per the Project Apis m. FAQ.
So almond trees did not cause these losses. The colonies were found dying as beekeepers readied them for bloom. The crop held up: USDA NASS forecast 3.00 billion pounds in July 2025, up 10% on 2024, per its objective report.
Why California Almonds Need Most US Bees
California’s almond acreage explains the scale of the pollination event. USDA’s National Agricultural Statistics Service put California’s 2025 crop on 1.39 million bearing acres and forecast 3.00 billion meat pounds in July 2025, up 10% from the 2024 crop of 2.73 billion pounds, per the USDA NASS 2025 objective forecast. Every one of those acres blooms in a synchronized window of roughly two to four weeks in February and March, and almond trees are almost entirely dependent on insect pollination to set nuts — there is no meaningful wind-pollination fallback for this crop.
That means orchard owners can’t rely on local, naturally occurring bee populations. No region has anywhere near enough wild or resident managed bees to service 1.39 million acres blooming at once. So beekeepers truck hives in from as far as Florida, the Dakotas, and the Pacific Northwest, on a schedule dictated entirely by bloom timing rather than what’s best for colony health. This is why so much of the national fleet ends up in one place: almost every commercially viable colony in the country converges on California’s Central Valley for a few weeks, then disperses again.
NASS updates the acreage and yield forecast each May (for the current season) and issues a subjective and objective forecast cycle through the year, with the final harvest-based objective measurement report typically published between November and January. If you need a number newer than the ones cited here, the USDA NASS California Almond Statistics page is the authoritative source and carries no publication lag for what’s already released.
7 Risk Factors Behind Almond-Related Bee Losses
The mortality and stress bees experience around almond pollination isn’t caused by any single factor — it’s the layering of several pressures within a few compressed weeks. Here are the seven documented mechanisms, in the order they typically hit a colony during the almond season.
- Pesticide and fungicide exposure
- Monoculture forage scarcity
- Nutritional deficits after bloom ends
- Transportation stress
- Colony overcrowding and disease transmission
- Water use and habitat conversion
- Displacement of native and wild pollinators
1. Pesticide and Fungicide Exposure
Fungicide applications during bloom are the most bee-specific chemical risk in almond orchards, because growers are actively treating for blossom diseases like brown rot at the exact moment hives are foraging in the canopy. Fungicides are often assumed to be low-risk to bees since they don’t target insects directly, but research compiled in UC Riverside’s fungicide-pollinator database shows sublethal effects on foraging behavior and larval development when fungicides are tank-mixed with insecticides or growth regulators — the “chemical cocktail” effect. Contamination can persist in pollen and nectar past the application window, meaning even careful spray timing doesn’t zero out exposure.
UC Riverside’s Department of Entomology maintains a running database of California fruit and nut fungicides and their pollinator impacts at cfn-fungicides.ucr.edu, updated as new peer-reviewed studies are published — that’s the primary place to check current product-by-product risk rather than relying on a static list. Growers pursuing traceable spray-application records can document exactly what was applied, when, and at what bloom stage, which matters increasingly to buyers asking for pollinator-safety assurances.
2. Monoculture Forage Scarcity
Almond orchards are a single-species floral resource. For the two-to-four-week bloom, that’s abundant nectar and pollen. Outside that window, an orchard offers close to nothing — no succession of blooming plants, no floral diversity, none of the varied pollen sources that keep a colony’s brood nutritionally balanced. At 1.39 million bearing acres in 2025, per the USDA NASS May 2025 forecast, much of that land is orchard from field edge to field edge, with limited hedgerow or wildflower margin in many conventional operations.
That scale is also what makes California the only place capable of hosting this event at all — no other US almond-growing region operates at comparable acreage, which is why most of the national colony population has to travel there rather than pollination demand being spread more evenly across smaller regional plantings.
3. Nutritional Deficits After Bloom Ends
The abrupt transition from pollen abundance to pollen scarcity is one of the better-documented stress points in commercial beekeeping. Colonies that feasted for three to four weeks face a forage cliff the moment petals drop. Malnourished colonies show weaker immune response, which compounds their vulnerability to Varroa mite infestations and viral loads picked up during the crowded bloom period. Beekeepers commonly report needing to move colonies immediately to alternate forage — cover crops, rangeland wildflowers, or other blooming crops — or supplement with protein patties and syrup to prevent post-almond colony collapse.
4. Transportation Stress
Getting enough colonies to California means trucking hives, sometimes over a thousand miles, on tight schedules dictated by bloom forecasts rather than by weather that’s kind to bees. In transit, colonies experience temperature swings, vibration, and extended confinement, all of which elevate mortality and weaken colonies before pollination work even starts. Long-haul transport also mixes bees from many disparate regions in one place, which is the direct link to risk factor five.
5. Colony Overcrowding and Disease Transmission
Almond orchards are stocked with several hives per acre to cover the short bloom window. Packing that many colonies from that many different originating states into adjoining orchards creates ideal conditions for Varroa mites and viruses to move between colonies — a documented driver of colony collapse. In early 2025, USDA linked record colony collapses at least in part to deformed wing virus A and B and acute bee paralysis virus, all spread by Varroa mites, per Project Apis m.. That is the kind of outcome crowding and mite pressure can produce in a bad year. Weakened immune systems from pesticide exposure or poor nutrition make disease outbreaks worse once they start.
6. Water Use and Habitat Conversion
Almond orchards are water-intensive relative to many California field crops, and expanding acreage has come at the cost of grassland, scrub, and other multi-crop farmland being converted to orchard. That conversion removes the wildflower margins and unmanaged open ground that would otherwise support both wild pollinators and forage diversity for managed bees outside the almond bloom window. Water allocation and drought policy in California directly shapes how much marginal land stays in orchard versus reverting to lower-water uses, which in turn affects habitat availability for pollinators. There’s no single, current, publicly available figure tying gallons used to acres of pollinator habitat lost — that’s a genuine gap in the published record, and it’s better addressed at the individual water-district or county level than with a statewide number that would need constant revision as acreage and drought conditions shift.
7. Displacement of Native and Wild Pollinators
Managed honeybees get almost all the attention in almond pollination because they’re the ones being trucked in by the millions, but native bees, bumblebees, and other wild pollinators are frequently more efficient pollinators under cool, wet early-spring conditions typical of California bloom season. As orchard acreage has expanded, native pollinator habitat has correspondingly shrunk, and disease spillover from densely packed managed colonies can affect wild bee populations nearby. A standardized, government-published baseline of native pollinator abundance in California almond regions from before large-scale orchard expansion doesn’t exist — historical surveys were not conducted at a scale or consistency that supports a defensible before-and-after figure. What does exist is a growing body of species-richness studies from university entomology departments, which is the right place to look for current, regionally specific wild pollinator data rather than a single historical baseline number.

BEE True: Scalable Honey Traceability Solution

Regenerative Agriculture: Carbon Farming, Soil Health & Climate Solutions

California Wine: Sustainable AgTech Insights
Comparative Risk Table
This table separates what’s measured from what still needs sourcing at the individual farm or region level. Where a figure comes from the research base above, it’s cited; where the honest answer is “not published as a single national figure,” that’s stated instead of estimated.
| Risk Factor | What’s Documented | Where to Get a Current Number | Grower Mitigation |
|---|---|---|---|
| Pesticide & Fungicide Use | Sublethal effects on foraging and brood documented; tank mixes elevate risk | UC Riverside fungicide-pollinator database (cfn-fungicides.ucr.edu); PubMed/Insects journal for new studies | IPM thresholds, bee-safe timing, spray-record traceability (Farmonaut Traceability) |
| Colony Concentration | More than 60% of US managed colonies used in California almond bloom | Peer-reviewed studies; USDA NASS almond reports | Regional pollinator support, staggered bloom planning |
| Seasonal Colony Mortality | About 30% annual colony loss considered normal nationally (NPR); 62% in 2024–25 | Bee Informed Partnership National Honey Bee Loss Survey (beeinformed.org), released periodically | Post-bloom nutritional supplementation, mite monitoring |
| Acute Mortality Events | 2014 and 2016 post-almond brood die-offs reported by beekeepers; 2025 losses linked to mite-borne viruses | Peer-reviewed research via PubMed; no ongoing annual tracker for acute events specifically | Reduced hive density, disease screening before placement |
| Water Use & Habitat Loss | No single current statewide gallons-to-habitat-loss figure published | Local water district reports; California Department of Water Resources | Efficient irrigation, habitat restoration (Farmonaut Carbon Footprinting) |
| Native Pollinator Displacement | No standardized pre-1980s baseline exists; modern species-richness studies only | University entomology department surveys, published on a rolling basis | Hedgerows, nest sites, wildflower corridors |
What Happens to Colonies After Bloom Ends
For managed honeybees, almond pollination is both the year’s biggest paycheck and its biggest gauntlet. During the two-to-four-week bloom, hives have more nectar and pollen than at almost any other point in the year, but also their highest exposure window to pesticide residue, hive density, and physical stress from the just-completed transport. Once bloom ends, forage collapses within days across the entire region simultaneously, because every colony in range is competing for whatever’s left in an orchard landscape offering essentially nothing beyond the almond bloom itself.
Beekeepers commonly report that post-almond colonies need active intervention — mite treatment, protein supplementation, sometimes antibiotic treatment for secondary infections — to be viable for the rest of the season. This feeds the roughly 30% annual colony loss that commercial beekeepers consider normal, per NPR: colonies that go into almond pollination healthy don’t necessarily come out that way, and the exit conditions determine how they perform for the rest of the year. The Bee Informed Partnership tracks these losses on a rolling basis through its National Honey Bee Loss Survey at beeinformed.org, with results released periodically — that’s the place to check the current season’s loss rate rather than relying on any single historical year.
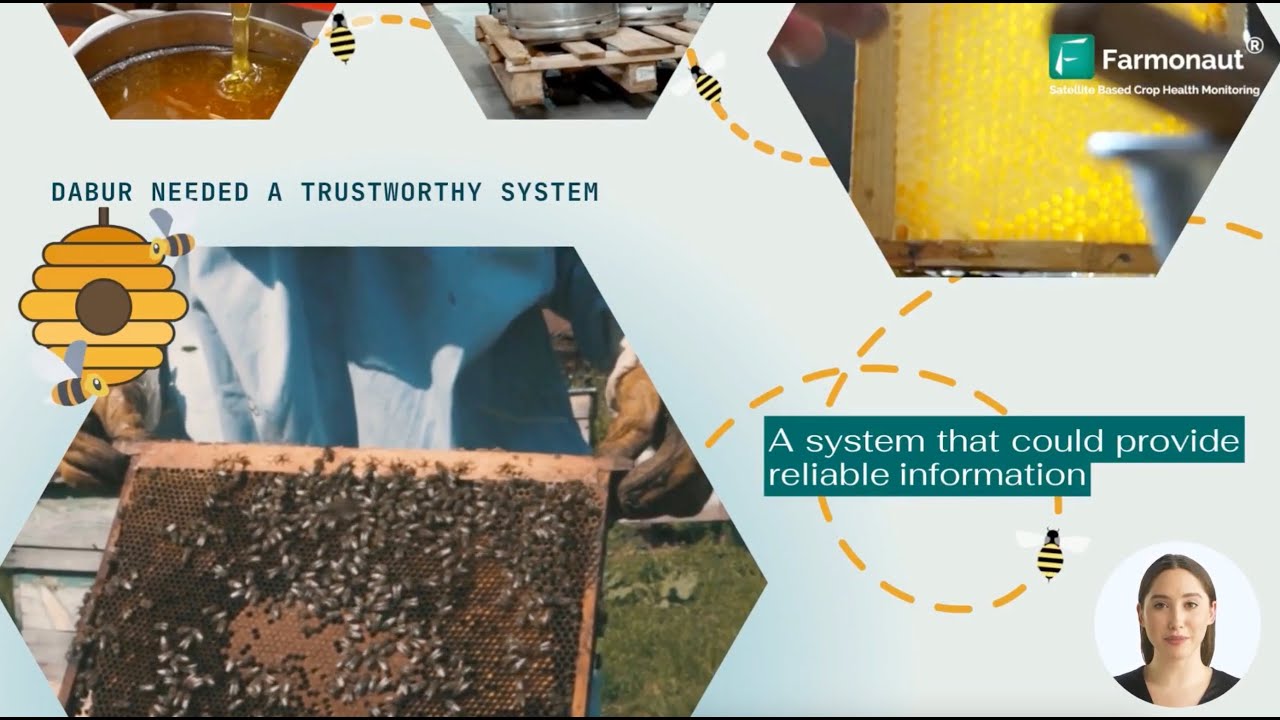
Farmonaut Traceability for Honey: Ensures transparent honey sourcing, countering honeybee health risks.
Calculator: Estimate Your Colony Loss Exposure
Use your own colony count and the mortality rates documented above to see how a normal season compares with an acute mortality event like 2014’s.
Run your own numbers
Assumptions: uses the roughly 30% annual colony loss commercial beekeepers consider normal, per NPR, and a 5% acute-event scenario, which is an illustrative input rather than a published figure. Excludes partial colony losses, queen failure unrelated to almond placement, and insurance or indemnity payments. Per-colony value is an input you control, not a published figure — use your own replacement and pollination-contract cost.
Wild Pollinators and Monoculture
Wild bee species — bumblebees, solitary mining bees, and others native to California’s Central Valley and foothills — are often more effective almond pollinators than honeybees under the cool, damp conditions common during February and March bloom, because many wild bee species forage at lower temperatures than honeybees will tolerate. But they depend on nesting sites and season-long floral diversity that almond monocultures don’t provide. As orchard acreage has grown, to 1.39 million bearing acres in the USDA NASS 2025 forecast, the wildland and mixed-crop margins that support these species have correspondingly shrunk.
There is no single standardized government dataset tracking wild pollinator population trends specifically within California almond-growing counties over time — that’s a genuine gap, not an oversight in this article. The most current, credible information comes from university entomology departments publishing species-richness surveys on a rolling basis; check with UC Cooperative Extension offices local to the growing region for the latest study relevant to a specific county.
Economic Stakes for California Growers
Almond pollination isn’t a side cost for California growers — it’s the single input the entire crop depends on, and the economics run both directions. Growers pay beekeepers for hive rental at rates that fluctuate with colony supply and demand each season; beekeepers, in turn, depend on almond pollination contracts for a meaningful share of annual income, which is why most of the national colony fleet makes the trip despite the mortality risk documented above. When colony losses run high in a given year, rental rates for the following season typically respond, and growers face tighter hive availability during the narrow bloom window when timing can’t slip.
- Elevated colony mortality tightens the supply of rentable hives for the following season, which is one of the few economic feedback loops in this system that shows up quickly in grower costs.
- Reliance on long-distance trucked colonies, rather than regional or resident bee populations, adds a fixed transportation and insurance cost to every acre pollinated.
- Buyers and retailers increasingly ask for documented pollinator-safety and traceability practices as a condition of premium contracts, which shifts spray-record keeping from a compliance chore to a sales requirement.
- Habitat loss on adjoining land reduces the wild pollinator backstop that would otherwise partially cushion a bad managed-colony year.
None of this is resolved by a single policy change — it’s an ongoing balance between bloom-window logistics, colony health, and land-use decisions that shifts every season with drought conditions, mite pressure, and hive supply.

Connect Your Farms With Satellites: Monitor field health remotely and make data-driven sustainability decisions.

Smart Farming Future: Precision technology and AI solutions for yield and bee-friendly sustainability.
Satellite Monitoring for Pollinator-Safer Orchards
Satellite crop monitoring gives almond growers a way to reduce several of the seven risk factors above without guesswork. Farmonaut’s platform supports this in a few concrete ways:
- Field health and vegetation monitoring (NDVI and moisture indices) flags stressed blocks early, reducing the reactive spraying that drives sublethal pesticide exposure during bloom.
- Monitoring tools help identify disease outbreaks, pest pressure, and water overuse before they escalate into the kind of hive-adjacent chemical response that elevates bee risk.
- Farmonaut’s Jeevn AI Advisory System supports pesticide timing decisions, helping growers apply during lower bee-activity windows and reduce total input intensity.
- Traceability features, built on blockchain, document spray timing and product choice from farm to processor, giving buyers verifiable evidence of pollinator-conscious practice rather than a marketing claim.
- Carbon footprint tracking supports habitat-restoration and sustainability-certification efforts tied to almond supply chains.
- These tools are available through the Farmonaut mobile and web app, the Farmonaut API, and for developers and integrators, the API Developer Docs.



For almond operations and agribusinesses, Farmonaut’s broader toolset extends beyond crop and bee monitoring:
- Early detection of crop and pollinator-relevant stress improves yield and payment confidence heading into harvest.
- Automated compliance data supports sustainability reporting and certification audits (Product Traceability).
- Scalable tools for operations of any size, including large-scale farm management, crop loan and insurance risk reduction, and fleet management integration for coordinating hive and equipment transport logistics.
Practices That Reduce Bee Losses
None of the seven risk factors above are fixed by a single intervention, but growers, beekeepers, and researchers have converged on a working checklist that reduces exposure at each stage of the almond season. This is the durable part of the picture — it holds regardless of what any given year’s mortality rate turns out to be.
A Pollinator-Safer Almond Season, Step by Step
-
Before bloom — pesticide and fungicide planning:
- Set Integrated Pest Management thresholds so sprays happen only when pest pressure crosses a defined level, not on a fixed calendar.
- Check product-specific pollinator risk against UC Riverside’s fungicide database before finalizing a bloom-period spray plan, and avoid tank-mixing products where the combined effect hasn’t been evaluated.
- Schedule any necessary application for early morning or late evening, when bee foraging activity is lowest.
-
During bloom — hive density and monitoring:
- Coordinate hive stocking density with the beekeeper rather than defaulting to the highest rate, since higher density raises disease-transmission risk without a proportional pollination benefit.
- Request or maintain spray-application records so pollinator-safety claims are documented, not asserted (Product Traceability).
-
After bloom — forage and recovery:
- Plan colony relocation to alternate forage — cover crops, rangeland, or other blooming crops — before the forage cliff hits, not after.
- Maintain wildflower strips, hedgerows, or uncultivated field borders where feasible to extend forage availability beyond the almond bloom window.
-
Year-round — habitat and native pollinator support:
- Preserve or restore nesting habitat for native bees at field margins, since these species don’t rely on the same forage window as trucked-in honeybees.
- Track environmental impact and habitat metrics over time rather than treating restoration as a one-time project.
-
Ongoing — data and disease screening:
- Screen colonies for Varroa mite load and disease before and after placement, since weakened colonies entering almond pollination are far more likely to end up in the mortality statistics cited above.
- Use satellite and field-monitoring tools to catch water stress or pest outbreaks early, reducing the reactive interventions that drive both cost and bee exposure.
This checklist doesn’t eliminate the underlying tension between a single, synchronized bloom event and healthy year-round bee populations — that tension is structural to how almonds are grown. But each step measurably reduces one of the seven risk factors, and the checklist itself doesn’t go stale the way any single year’s mortality figure does.

Revolutionizing Farming: Satellite-Based Crop & Bee Health Monitoring

How AI Drones Are Saving Farms & Millions
FAQ: Almonds and Bees
Q1: Do almond trees kill bees?
Almond trees themselves aren’t toxic to bees — the trees need bees to set nuts and offer abundant nectar during bloom. The mortality risk comes from the practices surrounding almond pollination: pesticide exposure during bloom, forage scarcity right after bloom, long-distance transport stress, and disease spread from packing millions of colonies into a small area at once. Commercial beekeepers consider losing about 30% of colonies a year normal, per NPR, and they lost 62% in 2024–25.
Q2: Are almond trees killing bees more than other crops?
Almond pollination is the largest pollination event in the US, drawing more than 60% of managed colonies, per a 2017 study in Scientific Reports. That concentration means almond-related stress affects a larger share of the national bee population than any other single crop’s pollination event, even though the individual risk mechanisms — pesticide exposure, crowding, transport — aren’t unique to almonds.
Q3: How many bees die during California almond season?
There’s no official almond-season death toll. Commercial beekeepers treat about 30% annual colony loss as normal (NPR). In 2024–25 they lost an average of 62%, about 1.6 million hives nationwide, per KVPR reporting on the Project Apis m. survey. For the current season’s loss rate, check the Bee Informed Partnership’s National Honey Bee Loss Survey at beeinformed.org, which publishes loss survey results.
Q4: Does growing almonds kill bees, or is it the pesticides?
It’s rarely one or the other. Pesticide and fungicide exposure is one of seven documented risk factors, alongside monoculture forage scarcity, post-bloom nutritional deficits, transportation stress, colony overcrowding and disease transmission, water use and habitat conversion, and displacement of native pollinators. Removing pesticide exposure alone wouldn’t eliminate the mortality risk, because the transport and crowding factors operate independently of chemical exposure.
Q5: What role do wild pollinators play in almond farming?
Native and wild bee species are often more effective almond pollinators than honeybees in the cool, damp conditions typical of February and March bloom, but they need nesting habitat and season-long floral diversity that almond monocultures don’t provide on their own. Preserving field-margin habitat is one of the few interventions that supports pollination resilience without adding to managed-colony transport and crowding risk.
Q6: How can growers verify pollinator-safe almond sourcing?
Ask for documented spray-application records tied to bloom-stage timing, not just a general IPM statement. Traceability platforms that log product, timing, and application method (see Product Traceability) turn a pollinator-safety claim into something a buyer or certifier can actually audit.
Where This Goes From Here
California almond acreage sat at 1.39 million bearing acres in USDA NASS’s 2025 forecast, and the industry’s dependence on trucked-in managed bees isn’t changing without a fundamental shift in how the crop is grown — a shift no current research points toward happening soon. What can change, season to season, is how well the seven risk factors above are managed: spray timing and product selection, hive density, post-bloom forage planning, and habitat investment on field margins. Those are decisions individual growers and beekeepers make every year, and they’re the reason mortality rates move up or down even while total acreage and colony demand keep climbing.
The way to track whether this is improving or worsening isn’t to wait for a single dramatic headline — it’s to check the sources this article draws on directly: USDA NASS’s almond forecasts for acreage and production trends, the Bee Informed Partnership’s loss surveys for current mortality rates, and UC Riverside’s fungicide database for product-specific pollinator risk. Each updates on its own cycle, and each will tell you more about next season than any fixed figure written here.
Satellite crop monitoring, AI-driven advisory, and traceability systems — the tools Farmonaut provides — give growers a way to act on that data rather than just observe it, tightening spray timing, documenting practices for buyers, and catching stress before it compounds into the kind of losses documented above.
Farmonaut Subscriptions
Ready to strengthen pollinator-safe practices and improve your almond orchard’s environmental performance? Farmonaut’s subscription plans bring satellite monitoring, AI advisories, traceability, and fleet management together in one platform, suited to farms, agribusinesses, government agencies, and developers alike.
Related: a regional comparison of almond farming and bee health perspectives.

 Oath Inc
 Reddane Farming
 Esri North East Africa
 Farmer Amigo
 Cresol
 Atur Kuliner
 MDCV UK
 Zerella Group
 Etech Consulting Madagascar
 Vestlandsforsking
 Agritein
 Delicio
 WB Dev
 Sama Premium
 Prochecker
 Tres Valles
 LACOS Geoinformation
 Magrifly
 LatConnect 60
 Blickwinkel
 Agricultural Credit Policy Council
