

California Agricultural Exports: Biggest Products & Tariffs
Reviewed September 2026 against CDFA’s 2024-2025 export report and USDA-NASS almond statistics.
Try it: Enter values above to estimate exposure. →
California’s biggest agricultural export is almonds, at $4.95 billion in 2024 — the single largest line item in the state’s $23.8 billion agricultural export total, which grew 6.1% from 2023, according to the California Department of Food and Agriculture (CDFA). California alone accounts for 13.5% of all U.S. agricultural export value. Below, the full commodity breakdown, the industries most exposed to tariff retaliation, and a calculator to estimate what a given tariff rate would cost a specific farm’s export revenue.
California’s Biggest Agricultural Exports, Ranked
CDFA’s 2024-2025 export report puts five commodities well ahead of everything else California ships abroad. Almonds lead by a wide margin, followed by pistachios, dairy products, and wine:
| Rank | Commodity | 2024 Export Value | Change vs. 2023 |
|---|---|---|---|
| 1 | Almonds | $4.95 billion | +13.5% |
| 2 | Pistachios | $2.93 billion | — |
| 3 | Dairy & dairy products | $2.60 billion | — |
| 4 | Wine | $1.08 billion | — |
Together, almonds and pistachios alone account for roughly a third of the state’s entire $23.8 billion agricultural export book. That concentration is exactly why “California’s biggest agricultural export” and “industries most impacted by tariffs” are, in practice, the same question — a retaliatory tariff aimed at almonds does more damage to California’s export economy than a tariff on almost any other single commodity the state produces, because there’s so much of it moving abroad in the first place.
CDFA republishes this report annually, typically the following spring, at cdfa.ca.gov/Statistics — check there for the current fiscal year’s numbers rather than relying on any single year’s figures indefinitely. The two commodities that once ranked in California’s top exports but no longer appear in the top tier — cotton and table grapes among them — don’t have current standalone export values in CDFA’s public tables; if you need those, the annual PDF report is the primary source to check first.

Almonds: Why One Crop Carries So Much of the Risk
Almonds are worth examining in detail because the production and export numbers are unusually well documented. USDA-NASS’s 2024 objective measurement survey put California’s almond crop at 2.80 billion meat pounds, grown across 1,380,000 bearing acres at a yield of 2,030 pounds per acre. Of that crop, about 70% is exported internationally, per the California Agriculture Authority’s export breakdown.
That combination — a huge crop, a majority of it export-dependent, and a small number of major destination markets — is what makes almonds the commodity analysts point to first whenever tariff retaliation comes up. China’s tariff rate on U.S. almonds has run at 35% through 2024-2025 as part of the broader retaliatory tariff dynamic, according to trade-policy tracking cited by Pinion Global’s analysis of agricultural trade policy.
USDA-NASS updates this picture on a predictable schedule: a production forecast every May and a full objective measurement report every July, with the on-demand USDA-NASS almond survey as the authoritative document. For finer-grained or more current commodity numbers between reports, USDA’s Quick Stats database (quickstats.nass.usda.gov) pulls the same underlying data on demand.
What a Tariff Actually Does to an Export-Heavy Crop
The mechanism is straightforward: a retaliatory tariff raises the price a foreign buyer pays for a California product relative to a competitor’s, without California producers seeing any of that markup. Buyers substitute toward tariff-free suppliers where they can — Australian almonds, Chilean walnuts, or EU/Mediterranean pistachios, depending on the crop — and the volume California would have shipped either goes unsold or gets redirected to a lower-value market.
The UC Giannini Foundation’s trade-policy analysis projects that tariff exposure could cost California’s agricultural economy on the order of $6 billion, based on their assessment of international trade’s role in state agriculture. That figure is a projection tied to a specific policy scenario, not a measured loss — treat it as a scale indicator rather than a fixed number, and check the UC Giannini Foundation report directly for the assumptions behind it before citing it as settled fact.
A documented historical case gives a sense of scale from an actual (not projected) tariff round: the American Farm Bureau Federation tallied $374 million in losses to U.S. fresh and processed fruit exports from the 2018 retaliatory tariff round, per their retaliatory tariff tracker. California, as the dominant U.S. producer of most of the fruit categories involved, absorbed a large share of that.
Which Industries Are Most Exposed to Tariff Retaliation
“Industries most impacted by tariffs” isn’t a single list — it depends on export dependence (what share of production leaves the country), market concentration (how many buyers matter), and substitutability (how easily a buyer can switch supplier). On those three criteria, California’s top four export commodities rank differently:
| Commodity | 2024 Export Value | Export Dependence | Primary Exposure |
|---|---|---|---|
| Almonds | $4.95 billion | ~70% of crop exported | China tariff at 35%; large, concentrated buyer markets |
| Pistachios | $2.93 billion | Majority export-bound | State produces ~99% of U.S. commercial crop, so any tariff hits the entire domestic industry at once |
| Dairy products | $2.60 billion | Export share smaller than tree nuts | Competes against EU and Oceania dairy exporters who face no equivalent tariff |
| Wine | $1.08 billion | Export share smaller than tree nuts | Already competes with tariff-free EU wine in most non-U.S. markets |
Tree nuts sit at the top of that exposure list for a structural reason that has nothing to do with any single administration’s trade policy: California isn’t just a large almond and pistachio producer, it’s the dominant one, supplying about 99% of the U.S. commercial pistachio crop. When a market imposes a tariff on U.S. tree nuts, there’s no other major U.S. supply region to absorb the shift — the exposure sits entirely on California growers.
Cross-Border Supply Chains: The California-Baja Corridor
A separate but related exposure sits in cross-border manufacturing rather than straight commodity exports. The California-Baja region runs supply chains where components cross the border multiple times during assembly — a part might cross into Mexico for one processing step and back into California for the next. If each crossing carries a tariff, the cost compounds with every trip rather than applying once at final sale.
That compounding effect is what state trade officials have flagged as a risk of “major disruptions” to the corridor: higher consumer prices, reduced competitiveness for California-based manufacturers relying on that supply chain, and pressure on jobs in border-region logistics and processing. It’s a distinct risk from commodity export tariffs — it hits assembled goods and packaged food inputs rather than raw agricultural exports — but it runs through the same California trade infrastructure (the Port of Oakland and the Port of Los Angeles/Long Beach) that agricultural exports depend on.

Diversifying Away From Tariff-Exposed Markets
The direct hedge against any single market’s tariff is market diversification — not shipping the majority of a crop to one or two buyers. That’s a portfolio problem as much as a trade-policy one, and the same logic California growers apply to export markets applies to farm revenue streams more broadly: concentration in any single crop, market, or buyer raises the variance of outcomes when that one relationship changes. Farmonaut’s piece on agricultural portfolio diversification walks through how growers apply that thinking at the farm level.
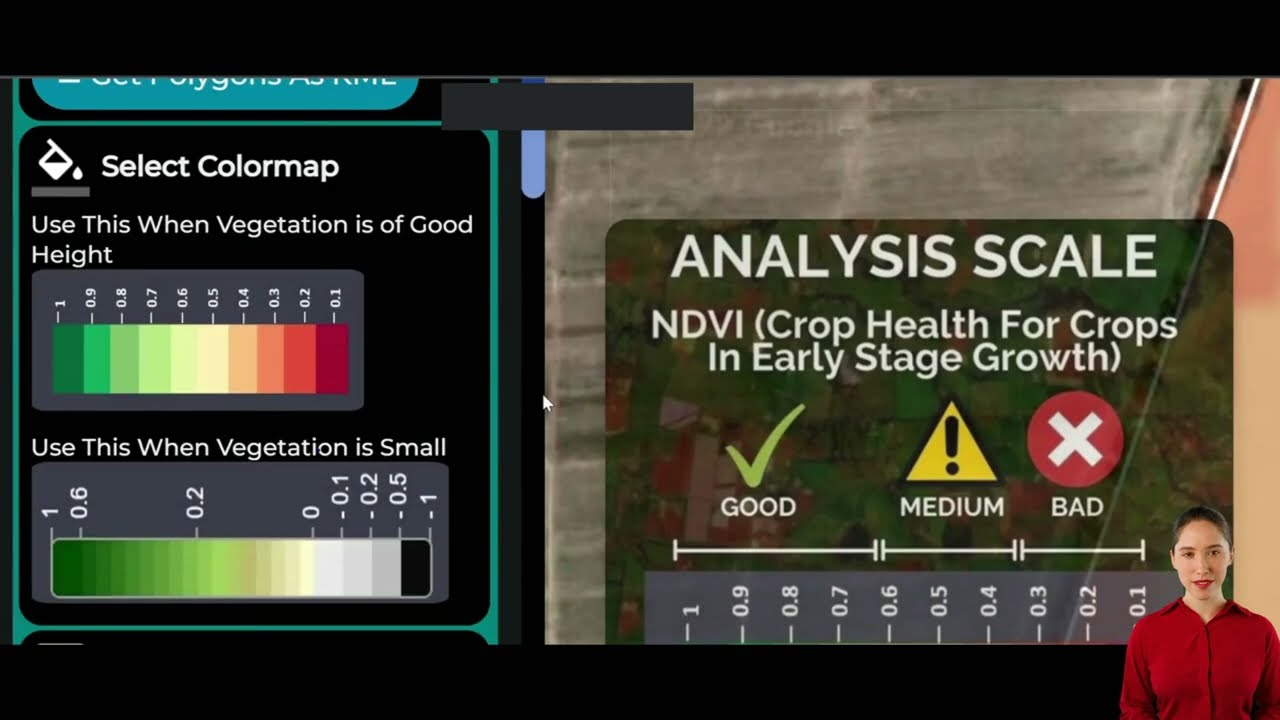
On the technology side, satellite crop monitoring doesn’t change a tariff rate, but it does change how much a grower can extract from the crop that’s already exposed to one — better-managed yield and quality narrow the margin a tariff eats into. Growers using Farmonaut’s satellite farm management platform get field-level vegetation health and irrigation data that supports the yield and quality side of that equation, alongside carbon footprinting tools relevant to environmentally-conscious export markets like the EU, and guidance on soil health practices that support long-run yield stability regardless of which export market a given harvest ends up in.
Estimate Your Own Export Tariff Exposure
The table above shows state-level exposure; the calculator below scales the same arithmetic down to a single farm’s export revenue so a grower can see what a given tariff rate would mean for their own numbers, not California’s aggregate.
Enter values above to estimate exposure.
Assumptions: this is a straight-line estimate that treats export share, tariff rate, and pass-through as independent and constant — it excludes currency effects, freight-cost changes, any substitution to alternate markets, and any domestic price support. Pass-through (the share of a tariff a grower absorbs rather than the foreign buyer) varies by how replaceable the crop is in that market; use a lower number for a crop with few substitutes and a higher one for a commodity buyers can easily source elsewhere.
California's Trade Position, in Context
Agricultural exports are one piece of a much larger trade picture. California is the largest importer among U.S. states and the second-largest exporter, engaging in more than $675 billion in two-way trade that supports jobs well beyond the farm sector — in transportation and logistics at the state's ports, in food processing and packaging, and in the agtech sector that serves growers directly. Agricultural exports at $23.8 billion are a meaningful slice of that $675 billion figure, but a slice — the bulk of California's trade volume runs through non-agricultural sectors like technology, manufactured goods, and entertainment.
That context matters for reading tariff-impact headlines: a $6 billion projected hit to agriculture (the UC Giannini Foundation figure above) would be a serious blow to the farm sector specifically, while representing under 1% of the state's total two-way trade volume. Both things are true at once — severe for growers, modest in the state's overall trade accounting.

Beyond Farms: California's Other "Biggest Exports"
Readers searching "california biggest export" or "things to buy from california" are often asking a broader consumer question rather than a strictly agricultural-trade one. Worth separating clearly: California's single largest agricultural export by dollar value is almonds ($4.95 billion, 2024, CDFA), but the state's overall export economy — the one behind that $675 billion two-way trade figure — is dominated by non-agricultural sectors including technology hardware, machinery, and entertainment/media licensing, categories CDFA's agricultural export report doesn't cover at all. If the question is specifically about farm-grown or food-and-beverage products worth seeking out from California, the CDFA ranking above (almonds, pistachios, dairy, wine) is the accurate answer; if it's about the state's exports in general, it's a different dataset outside agricultural trade statistics, and the U.S. Census Bureau's state export data is the place to check rather than any agricultural source.
How to Check These Numbers Yourself Next Year
Every figure in this article carries a publication date because every one of these figures changes on a predictable schedule. Rather than treat any single year's number as permanent, use this as a standing checklist:
- Total agricultural export value and commodity rankings: CDFA's annual export report, published the following spring, at cdfa.ca.gov/Statistics.
- Almond acreage, yield, and production volume: USDA-NASS's May forecast and July objective measurement report, or on-demand via Quick Stats (quickstats.nass.usda.gov).
- Current tariff rates by country and product: the Office of the U.S. Trade Representative (ustr.gov) and the Bureau of Industry and Security maintain the current schedules — tariff rates change faster than annual export reports and should be checked at the time of any decision, not inferred from a prior year's rate.
- Broader trade-policy impact estimates: the UC Giannini Foundation publishes periodic trade-policy analyses for California agriculture; check for the most recent version before citing a dollar figure from an older one.
That refresh path is the durable part of this article — the dollar figures above will be superseded, but the method for finding their replacements won't be.
FAQs
- What is California's biggest agricultural export?
Almonds, at $4.95 billion in export value in 2024 — up 13.5% from 2023 — per CDFA's export report. Pistachios rank second at $2.93 billion. - What are California's biggest exports overall?
Agriculturally, almonds lead, followed by pistachios, dairy products, and wine. California's total agricultural exports reached $23.8 billion in 2024, about 13.5% of all U.S. agricultural exports. Outside agriculture, the state's export economy is dominated by technology and manufactured goods, tracked separately by the U.S. Census Bureau's state export statistics rather than CDFA. - Which industries are most impacted by tariffs in California?
Tree nuts — almonds and pistachios — carry the highest exposure because California supplies nearly all U.S. production of both (about 99% of the commercial pistachio crop) and exports roughly 70% of its almond crop, per the California Agriculture Authority. There's no alternate U.S. supply region to absorb a tariff-driven demand shift the way there is for more geographically distributed crops. - How much do California agricultural exports contribute to the state and national economy?
$23.8 billion in 2024 (CDFA), representing 13.5% of total U.S. agricultural export value. That sits within a much larger $675 billion in total two-way trade the state conducts across all sectors. - How is a tariff's cost split between the grower and the foreign buyer?
It depends on how easily the buyer can source the product elsewhere — the more substitutable the crop, the more of the tariff cost lands on the grower rather than the buyer. Use the calculator above to model different pass-through assumptions against your own export revenue.
Earn With Farmonaut: Affiliate Program
Earn 20% recurring commission with Farmonaut's affiliate program by sharing your promo code and helping farmers save 10%. Onboard 10 Elite farmers monthly to earn a minimum of $148,000 annually—start now and grow your income!
Farmonaut Subscriptions
Access Farmonaut's cutting-edge agricultural technology solutions:



For developers interested in integrating Farmonaut's technology into their own applications, check out our API and API Developer Docs.
Discussion
Questions, corrections or field experience? Share them below. First-time comments are reviewed before they appear, and your email is never published.
No comments yet. Be the first to add a question or your experience.

 Prochecker
 Misteo
 Tres Valles
 LACOS Geoinformation
 Pulsar Supernova
 Magrifly
 LatConnect 60
 WebsEdge
 Blickwinkel
 Agricultural Credit Policy Council
 MCSOD
MCSOD Marei Nursery
 eKGIS
eKGIS Mostas Tech
 Andex
Andex FCF India
 Unifrutti Gulf
 Deluxe Conseil
 Licence holder · Niger · Gold
 Licence holder · Nigeria · Gold + lithium










