

California farming · Rankings guide
Top 5 Commodities in California: Value and Exports
Milk, almonds, cattle and calves, grapes and lettuce are California’s top five commodities by 2025 farm sales (CDFA, USDA ERS). By export value the order is almonds, pistachios, dairy, wine and walnuts (2024).
Key takeaways
- 2025 farm sales: milk $8.39B, almonds $6.87B, cattle and calves $6.19B, grapes $5.21B, lettuce $4.68B; total farm cash receipts $64.7B, up 4.5% (CDFA, from USDA ERS).
- 2024 exports were $23.8B, 13.5% of US agricultural exports; almonds $4.95B, pistachios $2.93B, dairy $2.60B, wine $1.08B, walnuts $0.92B (CDFA export report).
- About 77% of almonds and 79% of pistachios by weight were exported in 2024, against 33% of dairy and 7% of lettuce (CDFA export report).
- Kern, Fresno and Tulare were the top three counties by gross value in 2023; Monterey, home of the Salinas Valley, was fourth (CDFA review).
- Almonds rose from sixth in 2023 to second in 2025 (CDFA’s 2025 list leaves out the miscellaneous-crops group that was third in 2023), while almond acreage fell for a fourth year (Land IQ survey, 2025).
In this article
- Top 5 commodities in California by farm sales
- California farming at a glance
- How the top 10 commodities compare
- How the top five changed to
- Top 5 California commodities by export value
- How much of each crop is exported
- Where California's top commodities are grown
- Almonds, dairy and water: risks behind the rankings
- Yields and prices behind the top crops
- What a top crop earns per acre
- How we checked the numbers
- Tracking your own fields
- FAQ
The top 5 commodities in California by farm sales are milk ($8.39 billion), almonds ($6.87 billion), cattle and calves ($6.19 billion), grapes ($5.21 billion) and lettuce ($4.68 billion) in 2025, according to the California Department of Food and Agriculture (CDFA). Together the state’s farms and ranches took in $64.7 billion in cash receipts that year, up 4.5% on the year before. The ranking changes if you sort by exports instead, where almonds, pistachios, dairy, wine and walnuts come first.
This page gives both lists with their sources, shows where the crops are grown, and includes a calculator that turns your own acreage, yield and price into revenue per acre. It also keeps the guide to California’s main farming regions that earlier readers came for, now with counties ranked by sales value.
Top 5 commodities in California by farm sales
CDFA ranks commodities by cash receipts, a measure of what farmers and ranchers receive for what they produce. The 2025 figures use the USDA Economic Research Service (ERS) numbers published in September 2026. Here is the full top ten. CDFA’s 2025 list does not show the miscellaneous-crops group (nursery, greenhouse, seed and other crops), which ranked third in 2023 at $5.4 billion, so the 2025 ranks are not a like-for-like match with 2023.
| Rank | Commodity | Farm sales (US$ billion) | What it is |
|---|---|---|---|
| 1 | Milk | 8.39 | Dairy products, milk |
| 2 | Almonds | 6.87 | Shelled, utilized |
| 3 | Cattle and calves | 6.19 | Beef and replacement stock |
| 4 | Grapes | 5.21 | Wine, raisin and table |
| 5 | Lettuce | 4.68 | Romaine, head, leaf |
| 6 | Pistachios | 3.92 | In-shell |
| 7 | Strawberries | 3.68 | Fresh and processing |
| 8 | Carrots | 1.83 | Fresh and processing |
| 9 | Broilers | 1.54 | Chicken meat |
| 10 | Tomatoes | 1.36 | Fresh and processing |
The USDA National Agricultural Statistics Service (NASS) publishes the crop detail behind these totals. Its 2025 California overview shows 62,100 farm operations on 23.6 million acres, an average of 380 acres each. Its milk figure is 40.95 billion pounds, worth about $8.39 billion.
California farming at a glance
The 2023-2024 CDFA review gives the wider picture. California had 62,900 farms and ranches in 2023, which together received $59.4 billion, a record at that time and 11.3% of the US total. The state produced 17.7% of the nation’s milk. Its organic sales reached $11.8 billion in 2023, which is 32% of US organic sales. Farm real estate averaged $13,100 per acre, irrigated cropland $19,700 and the rental rate for irrigated cropland $486 per acre (all 2023 averages).
Three words get mixed up when people rank farm products, so it helps to separate them:
- Cash receipts are what farms receive for what they sell. CDFA’s top-commodity list uses this measure.
- Gross value of production is the figure county agricultural commissioners report for each county. It is built from local yields and prices, so it will not match cash receipts exactly.
- Export value is what the UC Davis report estimates for foreign sales, including processed forms such as wine.
Use cash receipts for the question “which crops earn the most for farmers”, and export value for “which crops depend on foreign buyers”.

▶ Seven green farming technologies that save water, fuel and fertilizer. · 2:24
How the top 10 commodities compare
Milk leads by a clear margin, but the gap between ranks 2 and 3 is under $0.7 billion. Lettuce and grapes are close enough that a price move can swap them. Rankings are for one year only, and prices drive much of the change.
Chart
California’s top 10 commodities by farm sales
US$ billion, 2025 crop year, cash receipts; the top eight of the ten shown
How the top five changed to
CDFA’s earlier review for 2023 used the ERS release of September 2024. In that year milk earned $8.1 billion, after a 21.8% fall from 2022 when milk prices received by producers dropped from $24.90 to $19.90 per hundredweight. Grapes were second at $6.5 billion, and “miscellaneous crops” (nursery and greenhouse crops, seed and other items) were third. The 2025 top-10 list on the CDFA site has no such group, so the two lists are not a perfect like-for-like match.
Chart
The top five of 2025, in 2023 and 2025
US$ billion, farm cash receipts; 2023 from the ERS release of September 2024, 2025 from September 2026
Almonds moved the most. They were sixth in 2023 at $3.88 billion and second in 2025 at $6.87 billion. Cattle and calves rose from $4.76 billion to $6.19 billion. Grapes fell from $6.52 billion to $5.21 billion. Each ERS release can revise earlier years, so use the chart for direction, not for exact differences.
Top 5 California commodities by export value
Exports tell a different story. The University of California Agricultural Issues Lab at Davis prepares the state’s export statistics for CDFA. Its 2024 report puts California’s agricultural exports at $23.8 billion, up 6.1% on 2023, and 13.5% of all US agricultural exports.
Chart
California agricultural export value
US$ billion per year, 2015 to 2024
| Export rank | Product | 2024 exports (US$ billion) | Change on 2023 |
|---|---|---|---|
| 1 | Almonds | 4.95 | +13.5% |
| 2 | Pistachios | 2.93 | +7.1% |
| 3 | Dairy and products | 2.60 | -0.6% |
| 4 | Wine | 1.08 | -0.8% |
| 5 | Walnuts | 0.92 | 0.0% |
The report lists Canada, the European Union and Mexico as the largest destinations by value in 2024, at $3.88 billion, $3.00 billion and $1.97 billion. The top ten destinations took 66.8% of the state’s export value. Canada took 85% of the value of lettuce exports.
How much of each crop is exported
The same report compares the volume exported with the volume produced, on a farm-weight basis. In 2024 about 77% of the almond crop and 79% of the pistachio crop by weight went abroad, against 33% of dairy and 7% of lettuce. The weighted average across the commodities it tracks was 28%.
Chart
Share of the crop exported, by weight
Percent of California farm quantity produced that was exported, 2024, selected crops
These shares explain why almonds and pistachios react so strongly to trade policy and port delays, while lettuce growers depend on the home market. For the full export table by product and destination, see our guide to California’s top agricultural exports.
Where California’s top commodities are grown
Farm sales are concentrated in the San Joaquin Valley and on the central coast. The county agricultural commissioners’ reports, compiled by CDFA, rank counties by gross value of production. In 2023, the latest year in the CDFA review, the top five were:
| County | 2023 value (US$ billion) | Leading commodities |
|---|---|---|
| Kern | 8.63 | Grapes, vegetables, pistachios, almonds |
| Fresno | 8.59 | Grapes, almonds, pistachios, cattle |
| Tulare | 7.87 | Milk, grapes, cattle, oranges |
| Monterey | 4.35 | Lettuce, strawberries, broccoli, grapes |
| Merced | 4.22 | Milk, almonds, sweet potatoes, cattle |
Imperial County ranked eighth at $2.69 billion, led by cattle, lettuce and alfalfa. Napa and Sonoma, known for wine, do not appear in the CDFA top ten counties. Ventura County, ranked tenth at $2.13 billion, lists strawberries, horticulture and lemons.
The Central Valley
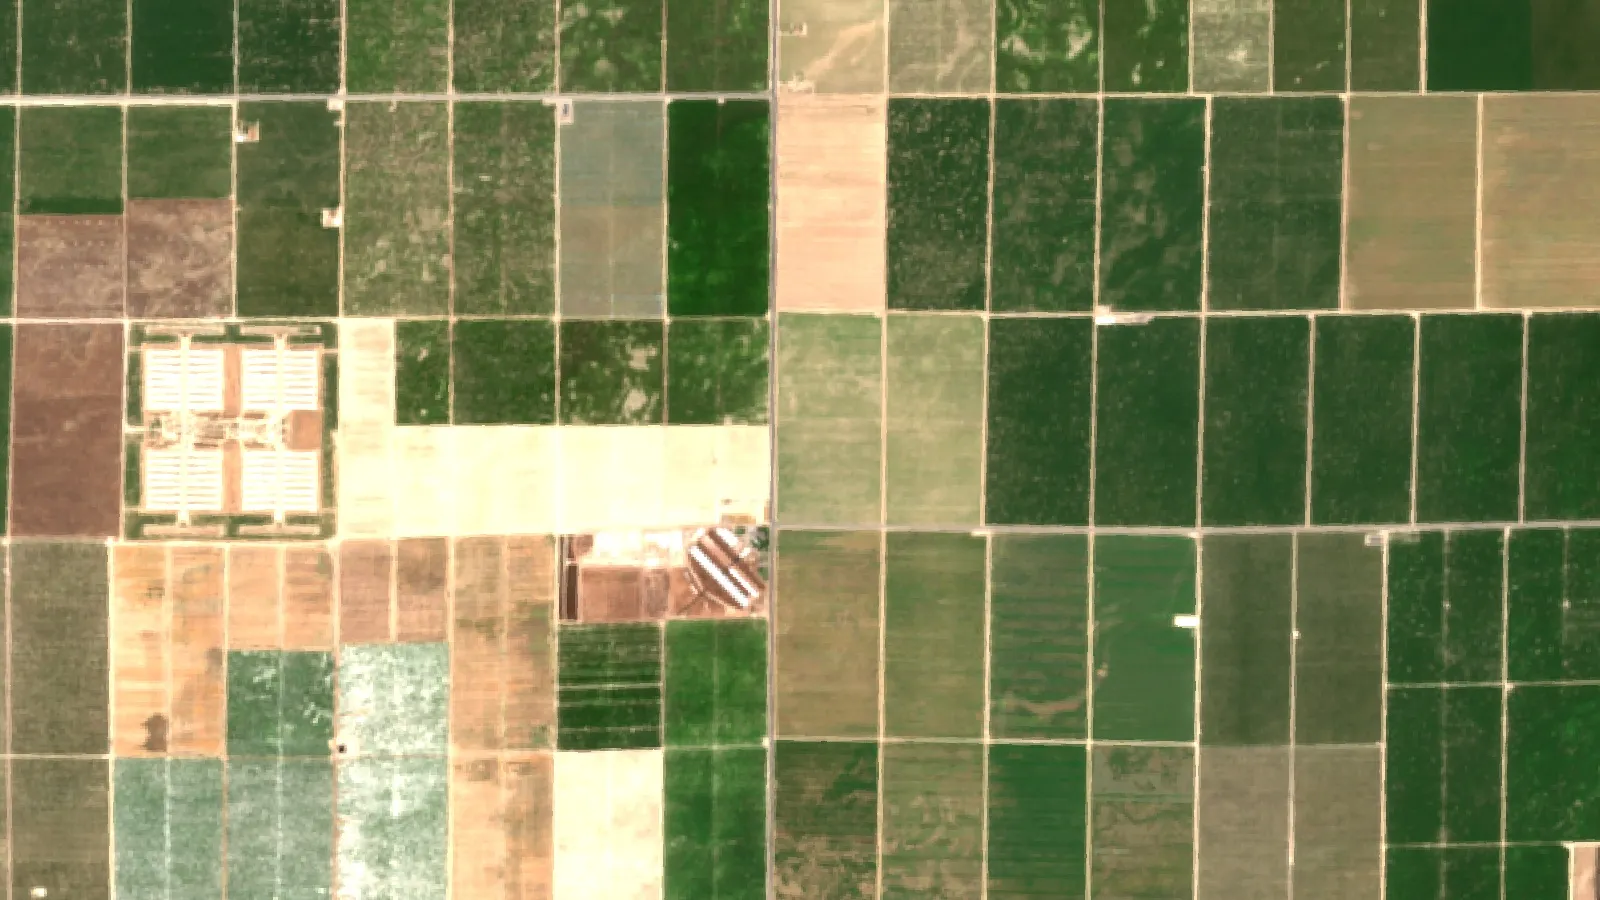
The U.S. Geological Survey (USGS) says the Central Valley grows more than 250 crops with an estimated value of $17 billion a year. It holds about 75% of California’s irrigated land and about 17% of the nation’s irrigated land. Using fewer than 1% of US farmland, it supplies 8% of US agricultural output by value, according to the USGS California Water Science Center.
The Salinas Valley and central coast
Monterey County, home of the Salinas Valley, lists lettuce first among its leading commodities, followed by strawberries and broccoli. Its total of $4.35 billion in 2023 puts it fourth in the state, and it is the highest-ranked county that is not in the San Joaquin Valley.
Imperial Valley and the south
Imperial County’s leading commodities in the 2023 table were cattle, lettuce and alfalfa. Its $2.69 billion total is smaller than the big Central Valley counties but still placed it eighth in the state.
Almonds, dairy and water: risks behind the rankings
Rank changes come with risks. The Almond Board of California reports from a Land IQ survey that total almond acreage fell to 1,505,997 acres in 2025, the fourth straight yearly fall. Orchard removals were about 49,000 acres in 2025, 67,000 in 2024 and 83,000 in 2023. In its May 2026 Crop Production report, USDA NASS forecast 1.39 million bearing acres, down from 1.40 million in 2025, and 2.70 billion pounds of shelled almonds.
Water limits what can be planted. The USDA ERS notes that California’s irrigated area fell from 8.8 to 8.2 million acres between 1997 and 2022. ERS says the fall in irrigated area across the West mainly reflects surface and groundwater shortages. For the Central Valley water story, see our guide to the Central Valley water crisis.
Dairy faces a different pressure: price. The leading dairy state produced 17.7% of the nation’s milk in 2023, so a price swing there reaches the national market. The 21.8% drop in milk receipts in 2023 came with a 2.1% fall in milk volume, so price, not output, did most of the damage.

▶ The benefits of mixing crops and livestock on one farm, including spreading risk across a bad year. · 2:55
Yields and prices behind the top crops
Farm sales are yield times price times acres, so each crop has its own story. NASS reports these 2025 figures for California:
- Almonds: 1.4 million bearing acres, 1,940 lb per acre of utilized nuts, and a price of about $2.60 per lb.
- Pistachios: 521,000 acres, 3,030 lb per acre in the shell, at $2.48 per lb.
- Grapes: 751,000 acres and 6.22 tons per acre. Processing grapes averaged $934 per ton and fresh-market grapes $1,900 per ton.
- Strawberries: 615 cwt per acre at $133 per cwt.
- Romaine lettuce: 365 cwt per acre at $59.20 per cwt. Head lettuce yielded 330 cwt per acre at $44.50, and leaf lettuce 240 cwt per acre at $84.20.
The grape split shows why the same fruit can sit in different markets: fresh-market grapes sold for about twice the price of processing grapes. Prices are marketing-year averages, so a single sale can be higher or lower.
What a top crop earns per acre
A high rank in dollars does not mean a high return per acre. The table divides the 2025 NASS value of production by harvested acres, so it is a gross figure before costs. It is our own calculation from the NASS overview, and it is for comparing crops, not for planning a budget.
| Crop | Gross value per harvested acre (US$) | Basis (NASS 2025) |
|---|---|---|
| Almonds | 4,910 | $6.87B over 1.40M acres |
| Grapes | 6,940 | $5.21B over 751,000 acres |
| Pistachios | 7,520 | $3.92B over 521,000 acres |
| Romaine lettuce | 21,610 | $2.26B over 104,500 acres |
| Strawberries | 81,850 | $3.68B over 45,000 acres |
Costs differ by crop as well, and a tree crop earns nothing until the trees bear: the Land IQ survey counts almond orchards planted in 2023 to 2025 as non-bearing. The calculator below lets you put in your own yield, price and cost.
Try the numbers for your own farm below.
Calculator
What could your acreage earn, and what price breaks even?
Enter your own acreage, yield, price and cost per acre.
- Gross revenue per acre (US$): $5,200
- Break-even price per lb (US$): 2.50
- Pounds sold abroad: 100,000 lb
- Revenue from exports (US$): $260,000
All values are examples (the default price is set slightly above break-even), not benchmarks or forecasts: use your own yield, today’s price and your own costs. For reference, NASS reported 1,940 lb per acre for utilized almonds in California in 2025 (USDA NASS state overview). The export share is your own input; the CDFA export report gives shares by crop. Costs vary by crop and farm, so this is a rough check, not financial advice.
How we checked the numbers
Farm sales come from CDFA’s statistics page and its 2023-2024 statistics review, which use USDA ERS cash receipts. Export values come from CDFA’s 2024-2025 export report. Crop yields and the 2025 value of production come from USDA NASS. Where the data come from different years or ERS releases, the text says so. Prices and yields move every year, so check the source pages for newer releases.
This page is general information, not financial or investment advice. Seek local professional advice before you buy land, plant a crop or sign a sales contract.
Tracking your own fields
Large rankings hide the field-by-field differences that decide a farm’s income. Growers who want a satellite view of vegetation change on their own parcels can use the Farmonaut web app, which shows vegetation trends from satellite images. It shows where plants are changing, not why, so a field check is still needed.

▶ Six plain steps to start precision farming, from field maps to satellite monitoring. · 4:18
Related pages on our site: large-farm management dashboard, product traceability, fleet management, carbon footprint tracking, crop loan and insurance, weather API documentation, satellite API documentation.
FAQ
What are the top 5 agricultural commodities in California?
By cash receipts in 2025 they are milk ($8.39 billion), almonds ($6.87 billion), cattle and calves ($6.19 billion), grapes ($5.21 billion) and lettuce ($4.68 billion), according to CDFA using USDA ERS data.
What is California’s biggest agricultural export?
Almonds. They earned $4.95 billion in exports in 2024, ahead of pistachios at $2.93 billion and dairy at $2.60 billion, according to the CDFA export report.
What is California known for growing?
Nuts, grapes, vegetables, berries and dairy. The CDFA site says nearly half of the country’s vegetables and over three-quarters of its fruits and nuts are grown in California, across more than 400 commodities.
How much food does California produce for the world?
Exports were worth $23.8 billion in 2024, or 13.5% of US agricultural exports. The report credits California with 100% of US export value for almonds, pistachios, walnuts and lettuce.
Which county has the highest farm value in California?
Kern County ranked first in 2023 at $8.63 billion, just ahead of Fresno at $8.59 billion. Tulare was third, according to the county commissioners’ reports compiled by CDFA.
How many farms does California have?
NASS counted 62,100 farm operations on 23.6 million acres in 2025. The 2022 Census of Agriculture counted 63,134 farms, 62% of them under 50 acres.
Farmonaut crop monitoring
See your own fields from space
Draw your fields once and view satellite vegetation maps for them through the season, on web, Android or iOS.




Keep reading
Sources
- CDFA, California’s Top 10 Agricultural Commodities (2025 crop year): cdfa.ca.gov
- CDFA / UC Davis, California Agricultural Exports 2024-2025: cdfa.ca.gov
- CDFA and USDA NASS, California Agricultural Statistics Review 2023-2024: cdfa.ca.gov
- USDA NASS, 2025 State Agriculture Overview for California: nass.usda.gov
- USDA NASS, 2022 Census of Agriculture, California profile: nass.usda.gov
- USGS California Water Science Center, California’s Central Valley: ca.water.usgs.gov
- USDA ERS, Farming and farm income (irrigated acreage chart, 2026): ers.usda.gov
- Almond Board of California, almond acreage declines for a fourth year (2025): almonds.org
- USDA NASS, Crop Production (May 2026), almond forecast: nass.usda.gov
- UC Davis, California Agricultural Issues Lab: aic.ucdavis.edu
- USDA NASS, California state page: nass.usda.gov
Discussion
Questions, corrections or field experience? Share them below. First-time comments are reviewed before they appear, and your email is never published.
No comments yet. Be the first to add a question or your experience.

 FCF India
 Rashail Infotech
 Unifrutti Gulf
 Deluxe Conseil
 TVS Electronics
 BW Pipelines
 WICO
 Gen Chayat
 Chimera Innovation
 SkyHarvest
 Polaris Digitech
 Teledarbas
 Wild Oak Farm
 SFX
 Doodlakine
 Exurbia Geospatial

 Licence holder · Niger · Gold










