

Reviewed August 2026 against Purdue Center for Commercial Agriculture, Pew Research Center, and MOST Policy Initiative.
Try it: Run your own numbers →
Cybersecurity, Data Centers & Farmland at Pittsboro, Indiana
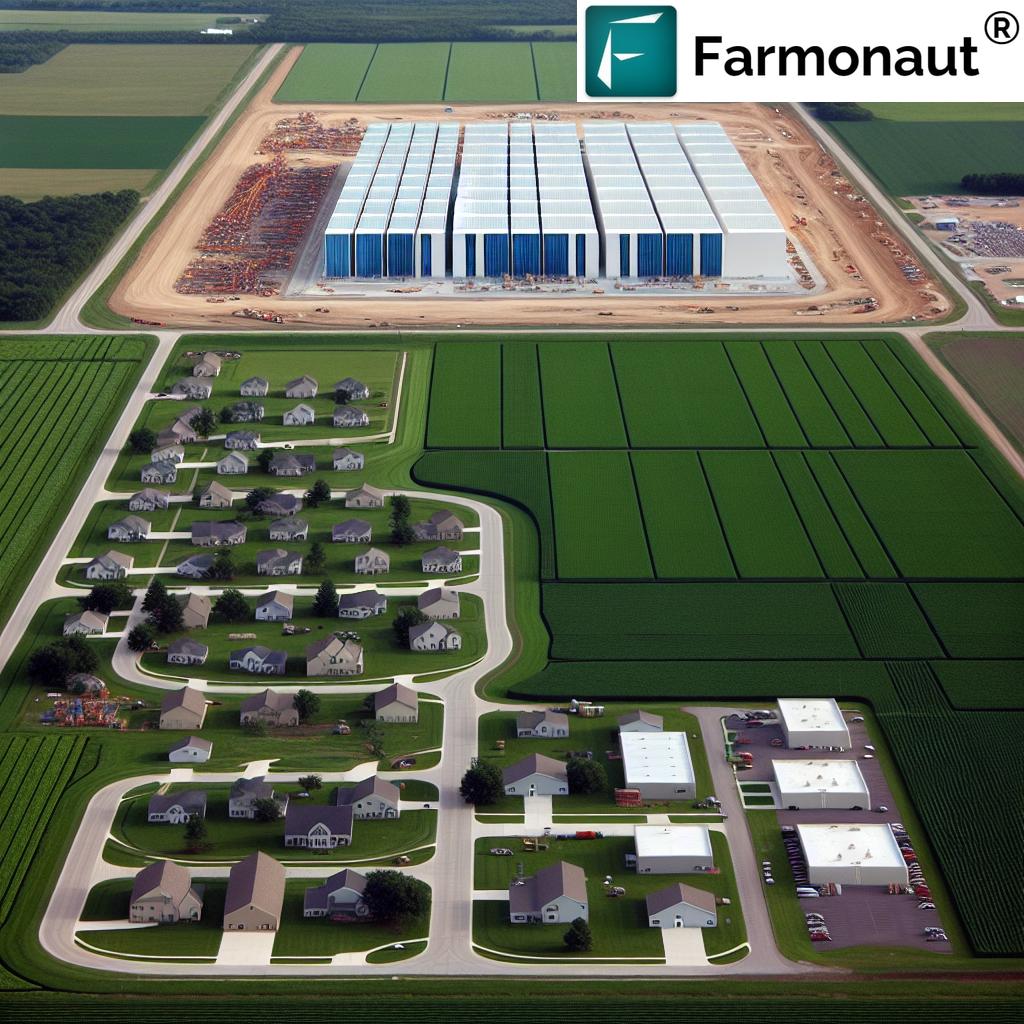
Vantage Data Centers has proposed converting 285 acres of the Charles D. Smith Family Farm — a 620-acre operation just north of Pittsboro, Indiana — into a hyperscale data center campus, per WTHR/Inside Indiana Business reporting on the rezoning filing. That single project sits inside a much larger pattern: Pew Research Center found that 67% of planned U.S. data centers are being sited in rural areas rather than cities, and the Midwest alone has 419 planned facilities, a 64% increase over current regional capacity. If you searched “cybersecurity Pittsboro,” “Pittsboro data center,” or “data center Pittsboro Indiana,” here is what’s actually documented, what isn’t, and what it means for the land, the water table, and the farms still operating around the site.
Table of Contents
- The Vantage Proposal: Scope and Numbers
- Why Rural Indiana, Why Pittsboro
- Cybersecurity at a Data Center Campus: What’s Actually Published
- What the Land Was Worth as Farmland
- Water and Energy: The Real Environmental Ledger
- Securing the Boundary: Fencing for the Adjoining Farmland
- Calculator: What 285 Acres Was Earning as Cropland
- Farmland vs. Data Center: A Structured Comparison
- Making the Remaining Acres Count
- FAQ
- Try it: Run your own numbers
The Vantage Proposal: Scope and Numbers
The filing covers 285 acres of the Charles D. Smith Family Farm, rezoned from agricultural to “warehouse industrial” to accommodate a Vantage Data Centers campus, according to WTHR/Inside Indiana Business (wishtv.com). The site sits west of County Road 500 East, between County Roads 850 North and 1000 North, just north of the Pittsboro town limits. Vantage’s own published estimate for the project is roughly 100 direct jobs — a figure the company has stated but that no source available at the time of this review breaks down by role, wage band, or hiring timeline. If you need those specifics, the Hendricks County Plan Commission docket and any traffic/economic impact study filed alongside the rezoning petition are the primary records to request; site-plan filings of this kind are typically public once submitted to the county.
What isn’t public yet, based on the sources reviewed for this piece: a construction start date, the facility’s planned power draw in megawatts, and any published security specification for the campus. Those details normally surface in the site plan and utility interconnection filings, not in the initial rezoning notice — worth checking the Hendricks County government site directly if you need current status rather than relying on this or any other article to have it first.
Why Rural Indiana, Why Pittsboro
Pittsboro’s appeal to a hyperscale operator tracks a national pattern rather than anything unique to the town. Pew Research Center’s April 2026 analysis of planned U.S. data center sites found that 39% are going into counties with zero existing data centers — first-time host communities, not expansions of existing tech clusters (Pew Research Center). Hendricks County, where Pittsboro sits, fits that description. The same Pew analysis puts typical construction cost at $9–15 million per megawatt of capacity — the number that ultimately explains the site-selection logic: land, power headroom, and highway access matter more than proximity to an existing tech corridor.
Neighboring Hancock County’s economic development council quantifies the regional logistics case that likely applies to Hendricks County sites as well: a one-hour drive radius reaches a labor shed of roughly 2 million people, and the area sits within a one-day truck drive of about 114 million people across the eastern half of the country (Hancock County Economic Development Council). Pittsboro’s own draw is its position roughly 30 minutes southeast of Indianapolis on I-74 — rural land prices with metro-adjacent connectivity, which is precisely the combination Pew’s rural-siting data says operators are chasing nationwide.
Cybersecurity at a Data Center Campus: What’s Actually Published
Searches for “cybersecurity Pittsboro” are almost certainly people trying to find out what security infrastructure a hyperscale campus brings to town — physical hardening, network security certifications, or job openings in the field. Here is the honest state of that record: none of the sources available for this review — the WTHR/Inside Indiana Business report, Pew Research’s siting data, or Vantage’s public statements — published technical detail on the Pittsboro facility’s security systems, compliance certifications (such as SOC 2 or ISO 27001), or physical hardening specifications. That is a genuine gap, not an oversight on our part.
What is standard across the hyperscale industry, and reasonable to expect a Vantage facility to include once operational, is perimeter fencing and access control, biometric or badge-gated entry to server halls, and 24-hour on-site security staff — all common baseline features at comparable campuses in Ohio and Virginia, the markets Vantage already operates in. But “common industry practice” is not the same as a verified fact about this site. If you need Pittsboro-specific security specifications, the most reliable path is Vantage’s own site announcements once construction plans are finalized, or the site plan filed with Hendricks County, which for large industrial projects often includes fencing, lighting, and access-control requirements as a condition of approval.
The jobs angle is more concrete, if still thin: 100 direct roles is the figure in circulation, but no published source breaks out how many of those are security, network operations, facilities, or general administrative staff. Data center operators nationally do hire security operations center (SOC) analysts, network security engineers, and physical security staff as a matter of course — but attaching a Pittsboro-specific headcount to any of those categories today would be inventing a number the record doesn’t support.
What the Land Was Worth as Farmland
Before it’s rezoned, the 285 acres has a documented market value as cropland, and it’s a useful anchor for any conversation about what’s being traded away. Purdue University’s Center for Commercial Agriculture puts Indiana’s top-quality farmland at $14,826 per acre as of June 2025, a 3% increase over the prior year, with cash rent on that same top-quality ground averaging $318 per acre annually (Purdue Center for Commercial Agriculture). Purdue’s same June 2025 survey lists average-quality Indiana farmland at $12,359 per acre (+5.4%) and poor-quality ground at $9,819 per acre (+7.6%) — all three tiers rising, which tells you farmland scarcity is a live pressure in the state independent of any single rezoning.
Applied to 285 acres at the top-quality figure, that’s roughly $4.2 million in land value and about $90,630 a year in cash-rent income the family farm was foregoing or converting — figures worth having on hand before weighing any tax-revenue projection for the data center against what the ground was already generating. Purdue republishes this survey every June via its Purdue Agricultural Economics Report; if you’re reading this more than a year out, go to the ag.purdue.edu/commercialag link above and pull the current year’s edition rather than trusting a 2025 figure to still hold.
Water and Energy: The Real Environmental Ledger
This is the category where vague language does the most damage, so here are the actual numbers. U.S. data centers directly consumed an estimated 17.4 billion gallons of water in 2023, and that figure is projected to rise to between 38 and 73 billion gallons by 2028, according to the MOST Policy Initiative’s science note on data center water use (MOST Policy Initiative). A single 100-megawatt facility — a plausible scale for a hyperscale campus, though Pittsboro’s planned capacity in megawatts has not been published — averages around 530,000 gallons of water per day for cooling, per the same source citing IEA data. For scale, Google’s Council Bluffs, Iowa facility, one of the largest single sites in the country, withdraws about 3.9 million gallons a day.
None of this means the Pittsboro facility will hit any of those numbers specifically — its actual water draw depends on cooling design (air-cooled vs. evaporative vs. liquid cooling) and final capacity, neither of which is public yet. But it gives Hendricks County residents and the Plan Commission a real range to ask Vantage to commit against, rather than negotiating in the dark. The same applies to power: the $9–15 million per-megawatt construction cost Pew Research cites correlates directly with grid draw, so the capacity figure — once filed — is the number that will tell you the facility’s actual electricity and water footprint, not general industry averages.

Securing the Boundary: Fencing for the Adjoining Farmland
Anyone searching “fence for farm land” in connection with this project is likely a neighboring landowner working out how to secure a property line that’s about to run alongside an industrial construction site and, eventually, a fenced data center perimeter. The practical checklist is the same one that applies to any farm boundary abutting new construction, with a few points specific to this situation:
- Survey the line before construction starts. Get a current boundary survey on record now, while the adjoining parcel is still open farmland — disputes over exact property lines get harder and more expensive to resolve once grading and fencing begin on the industrial side.
- Match fence type to what’s crossing the line. Woven wire or high-tensile electric fencing is standard for livestock containment along a boundary that will see heavy construction traffic; field fencing alone won’t stop debris, dust, or curious pedestrians during the build phase.
- Ask about the industrial-side perimeter fence early. Hyperscale campuses install perimeter security fencing — often chain-link topped with anti-climb features — as a standard feature. Coordinating your fence line with theirs, rather than building independently, avoids a redundant dead zone or a gap between the two.
- Budget for buffer maintenance. Drainage patterns change when hundreds of acres go from row crop to graded industrial pad; a fence that was fine on flat cropland may need re-grading or relocation once runoff patterns shift.
- Document pre-construction condition. Photograph your fence line, drainage, and any shared field access before groundbreaking. If construction traffic or grading damages your boundary, you’ll want dated evidence.
None of this is Pittsboro-specific — it’s the same due diligence any farm neighboring new industrial development should do — but it’s exactly the kind of concrete, get-it-right-once guidance a generic AI summary of “how to fence a farm” won’t tailor to a rezoning-in-progress next door.
Calculator: What 285 Acres Was Earning as Cropland
Plug in your own acreage and Purdue’s published per-acre figures to see what a similar conversion trades away in land value and annual rent income.
Run your own numbers
Assumptions: uses Purdue Center for Commercial Agriculture’s June 2025 Indiana farmland value and cash-rent survey. Excludes construction-phase tax revenue, indirect/supply-chain jobs, and any site-specific appraisal — actual land value depends on soil type, drainage, and location, not just the county-wide quality tier average.
Farmland vs. Data Center: A Structured Comparison
| Factor | 285 Acres as Farmland | 285 Acres as Data Center Campus |
|---|---|---|
| Land value | ~$4.2M at $14,826/acre top-quality tier (Purdue, June 2025) | Rezoned to warehouse-industrial; assessed value not yet published |
| Annual income to landowner | ~$90,630/year in cash rent at $318/acre top-quality rate | Not published; depends on lease/sale terms not in public filings |
| Direct jobs | Typically a handful of family/hired labor positions on a farm this size | ~100 jobs per Vantage’s public estimate; role breakdown not published |
| Water use | Seasonal irrigation, dependent on crop and rainfall | Comparable 100MW facilities average ~530,000 gallons/day (MOST Policy Initiative) |
| Construction cost basis | N/A | $9–15 million per megawatt of capacity (Pew Research Center, 2026) |
| Zoning | Agricultural | Warehouse industrial, per rezoning petition |


Making the Remaining Acres Count
Whatever the final footprint of the Pittsboro campus, the Charles D. Smith Family Farm and its neighbors keep farming the acres that aren’t rezoned — and Purdue’s numbers above make the case for treating those remaining acres as more valuable, not less, once part of the base is gone. At $14,826 per acre for top-quality Indiana ground, every acre lost to development raises the stakes on the acres that stay in production.
Farmonaut’s satellite-based monitoring platform gives operators a way to track crop health, soil moisture, and input use across the remaining acreage without adding labor. Real-time NDVI-based crop health readings flag stress before it’s visible from the road; soil moisture data supports irrigation timing decisions; and AI-driven advisories help time fertilizer and pesticide applications to reduce waste. For a farm operation navigating a rezoning and the disruption of construction traffic and drainage changes next door, that kind of remote monitoring reduces the number of physical site visits needed to keep tabs on the parts of the farm still in production.

The same logic applies at the county and state level. As Indiana’s data center footprint grows — the Midwest as a whole is on track for 419 planned facilities per Pew’s 2026 tally — agricultural land that remains in production carries more of the state’s food-production and land-value base per acre. Farmonaut’s API Developer Docs and satellite data API let larger operations and agtech partners build monitoring directly into farm management systems, which matters more, not less, as usable farmland gets scarcer. This dynamic isn’t confined to Indiana: it echoes broader shifts documented in national farmland decline trends and the push toward tech-driven sustainable agriculture across U.S. farm country. There’s a rough parallel, too, in how other land-based industries weigh competing uses of the same acreage — see how mineral-extraction economics get valued against alternative land use for a comparable framework applied to mining ground instead of farmland.


How to Track This Story Going Forward
Because the record here is genuinely incomplete — no confirmed construction start date, no published megawatt capacity, no security specification — treat this article as a snapshot with a checklist attached, not a final account. To get a current status:
- Check the Hendricks County Plan Commission and Board of Commissioners public meeting records for the rezoning petition’s final disposition.
- Pull Purdue’s Center for Commercial Agriculture farmland survey each June for the current year’s per-acre values and rent figures — the 2025 numbers cited here (ag.purdue.edu/commercialag) will be superseded by a 2026 survey.
- Watch Vantage Data Centers’ own site announcements for confirmed capacity, water sourcing, and security specifications once the project moves past rezoning into site planning.
- Re-check Pew Research Center’s rural data center tracking (pewresearch.org) for updated national and Midwest counts, since the 419-facility figure is a planning-stage snapshot that will move as projects break ground or fall through.

FAQ
- Q: How many acres is the Pittsboro data center taking from farmland?
A: 285 acres of the 620-acre Charles D. Smith Family Farm, per WTHR/Inside Indiana Business reporting on the rezoning petition to “warehouse industrial.” - Q: Is there published cybersecurity detail for the Pittsboro facility?
A: No. None of the sources reviewed publish technical security specifications for this site. Standard hyperscale practice includes perimeter access control and on-site security staff, but that is industry norm, not a confirmed Pittsboro detail — check Vantage’s site announcements or the Hendricks County site plan filing for anything site-specific. - Q: What is Indiana farmland worth per acre right now?
A: Purdue’s Center for Commercial Agriculture put top-quality Indiana farmland at $14,826/acre as of June 2025, average quality at $12,359/acre, and poor quality at $9,819/acre. Purdue republishes this survey every June; check ag.purdue.edu/commercialag for the current figure. - Q: How much water does a data center like this use?
A: A 100-megawatt facility averages around 530,000 gallons of water per day, per MOST Policy Initiative citing IEA data. Pittsboro’s planned capacity in megawatts has not been published, so its specific water draw isn’t yet calculable. - Q: Is Pittsboro’s project part of a bigger trend?
A: Yes. Pew Research Center found 67% of planned U.S. data centers are sited in rural areas, with 419 planned in the Midwest alone — a 64% jump over current regional capacity, and 39% nationally are going into counties with no existing data center. - Q: What should a neighboring farm do about fencing before construction starts?
A: Get a current boundary survey on record, match fence type to construction-phase traffic (not just livestock containment), coordinate with the industrial site’s planned perimeter fence, and photograph pre-construction conditions along the shared line.
Discussion
Questions, corrections or field experience? Share them below. First-time comments are reviewed before they appear, and your email is never published.
No comments yet. Be the first to add a question or your experience.

 BayWa
BayWa Azure Clouds
 MCSOD
MCSOD Marei Nursery
 eKGIS
eKGIS Mostas Tech
 Native Seeds
 Andex
Andex FCF India
 Unifrutti Gulf
 Deluxe Conseil
 TVS Electronics
 WICO
WICO Chimera Innovation
 SkyHarvest
