

Australian mining · Industry facts
Mining Industry in Australia: Output, Exports, Miners
Australia ranks first in the world for iron ore and lithium output and holds the largest gold and uranium resources (Geoscience Australia, 2024 data). This guide covers output, exports, jobs and the biggest operators, with sources.
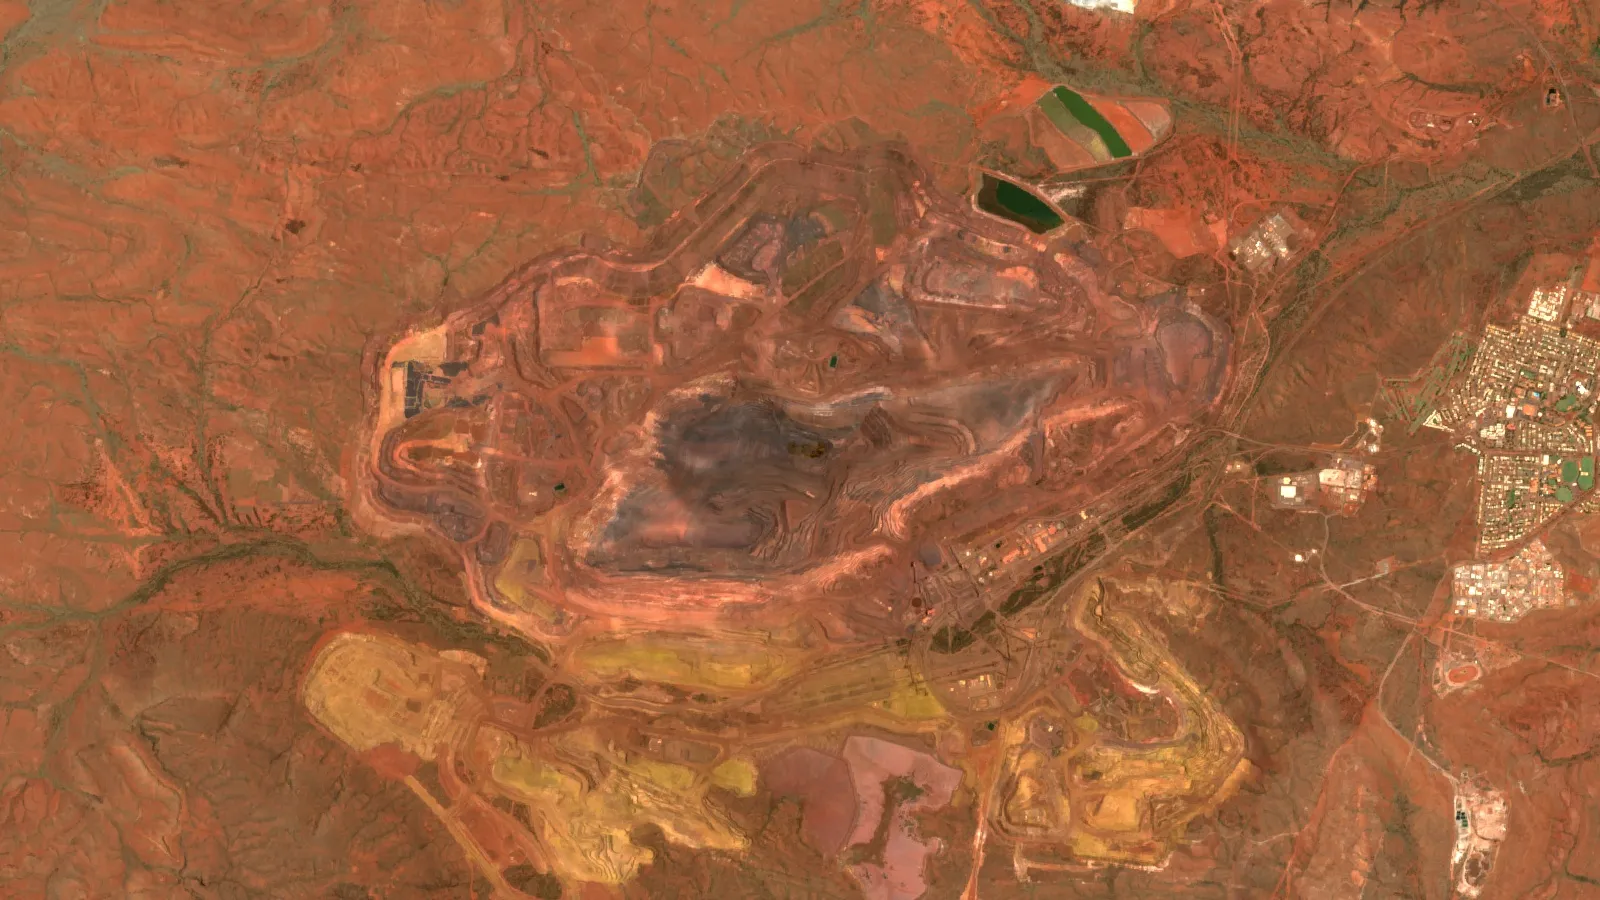
Key takeaways
- Australia mined 954 Mt of iron ore (38% of world output, rank 1) and 108 kt of lithium (43%, rank 1) in 2024 (Geoscience Australia).
- Export income in 2024 listed by Geoscience Australia: iron ore A$127.4 billion, black coal A$85.1 billion, gold A$35.7 billion.
- Fortescue shipped a record 201.3 Mt in FY26; BHP’s WAIO produced 291.2 Mt (100% basis); Rio Tinto’s Pilbara produced 162.3 Mt in the first half of 2026 (company filings).
- Western Australian lithium sales fell from A$21.5 billion in 2022-23 to A$4.3 billion in 2024-25 (WA Department of Mines, Petroleum and Exploration).
- The ABS counted 244.6 thousand mining jobs in June 2026, and WA alone had 134,009 on-site FTE mining positions in 2024-25.
In this article
- How big is the mining industry in Australia
- Australian mining output and world rank by commodity
- What Australian mining earns from exports
- Who are the biggest mining companies in Australia
- Iron ore: the largest part of Australian mining
- Gold and lithium: two markets moving in opposite directions
- Uranium, coal and other commodities
- How many people work in Australian mining
- Technology in Australian mines
- Rehabilitation, Indigenous agreements and land
- What a mine's revenue and royalty look like
- What to watch in Australian mining
- Frequently asked questions
How big is the mining industry in Australia
Australia is the world’s largest iron ore producer and holds the world’s largest identified resources of gold, iron ore, uranium, lead and zinc. In 2024 it mined about 954 million tonnes (Mt) of iron ore, 284 tonnes of gold and 108 kilotonnes of lithium content, according to Geoscience Australia’s Australia’s Identified Mineral Resources 2025. The same publication ranks the country first in the world for iron ore and lithium production, second for bauxite and third for gold, rare earths, manganese and zinc.
This guide gives the facts a reader needs in one place: what Australia produces, how much it earns from exports, which companies run the biggest operations, how many people work in the industry, and where it faces pressure. Every figure carries its source and year, because mining numbers go out of date quickly. It is written for consultants, licence owners, suppliers and investors who need a reliable starting point, and it is not investment advice.
Australian mining output and world rank by commodity
Geoscience Australia (GA), the national geological survey, publishes a yearly commodity summary. Two terms help read it. EDR means economic demonstrable resources: mineral that can be mined at a profit with current technology and prices. Production share is Australia’s part of world mine output. The table uses GA’s calendar-year 2024 production and its resource figures as at 31 December 2024.
Chart
Australia’s share of world mine production, by commodity
Per cent of world output, calendar year 2024
| Commodity | Australian production, 2024 | World rank, production (share) | World rank, resources (share) |
|---|---|---|---|
| Iron ore | 954 Mt | 1 (38%) | 1 (30%) |
| Lithium | 108 kt of lithium | 1 (43%) | 2 (28%) |
| Bauxite | 100.5 Mt | 2 (22%) | 2 (13%) |
| Gold | 284 t | 3 (9%) | 1 (20%) |
| Rare earth elements | 0.031 Mt of oxide | 3 (8%) | 3 (8%) |
| Zinc | 1.10 Mt | 3 (9%) | 1 (27%) |
| Uranium | 4.656 kt of uranium | 4 (8%) | 1 (32%) |
| Black coal | 424 Mt | 5 (5%) | 4 (9%) |
| Copper | 0.75 Mt of copper | 8 (3%) | 2 (11%) |
The pattern matters more than any single row. Australia is a top-three producer of the bulk and battery materials that Asian industry buys, but only a mid-sized producer of copper, even though it holds the second-largest copper resource. GA counts 141 operating gold mines, 55 iron ore mines, 96 black coal mines and 24 copper mines for 2024. Production in tonnes is not the same as value: GA’s own iron ore figure (954 Mt) is lower than the 982 Mt reported for Australia in the USGS Mineral Commodity Summaries 2026 (gross weight, 2024), because the two agencies may report on a different basis or period (check each source’s notes). Quote the source and the basis when you use either number.
What Australian mining earns from exports
Iron ore, coal and gold earn most of the money. GA lists export income by commodity, taken from the Resources and Energy Quarterly of September 2025 compiled by the Office of the Chief Economist. The values are for calendar year 2024 and are in Australian dollars.
Chart
Export income by commodity group
A$ billion, calendar year 2024, as listed by Geoscience Australia from the Resources and Energy Quarterly of September 2025
- Iron ore: A$127.4 billion (this GA figure covers ore, crude steel and scrap).
- Black coal: A$85.1 billion (thermal and coking coal combined).
- Gold: A$35.7 billion.
- Bauxite, alumina and aluminium: A$18.7 billion.
- Copper: A$11.9 billion (refined, ore and concentrate).
- Lithium: A$5.1 billion (spodumene ore and concentrate).
Prices decide these numbers as much as volumes do. Western Australia’s Department of Mines, Petroleum and Exploration reports that iron ore sales from the state were A$122 billion in 2024-25 on 864 Mt, “down on record levels” although volumes stayed near record, and that gold sales hit a record A$29 billion on 6.7 million troy ounces (209 tonnes) (WA Department of Mines, Petroleum and Exploration, 2024-25 Statistics Digest). Gold earned more because the price rose, not because far more was mined.
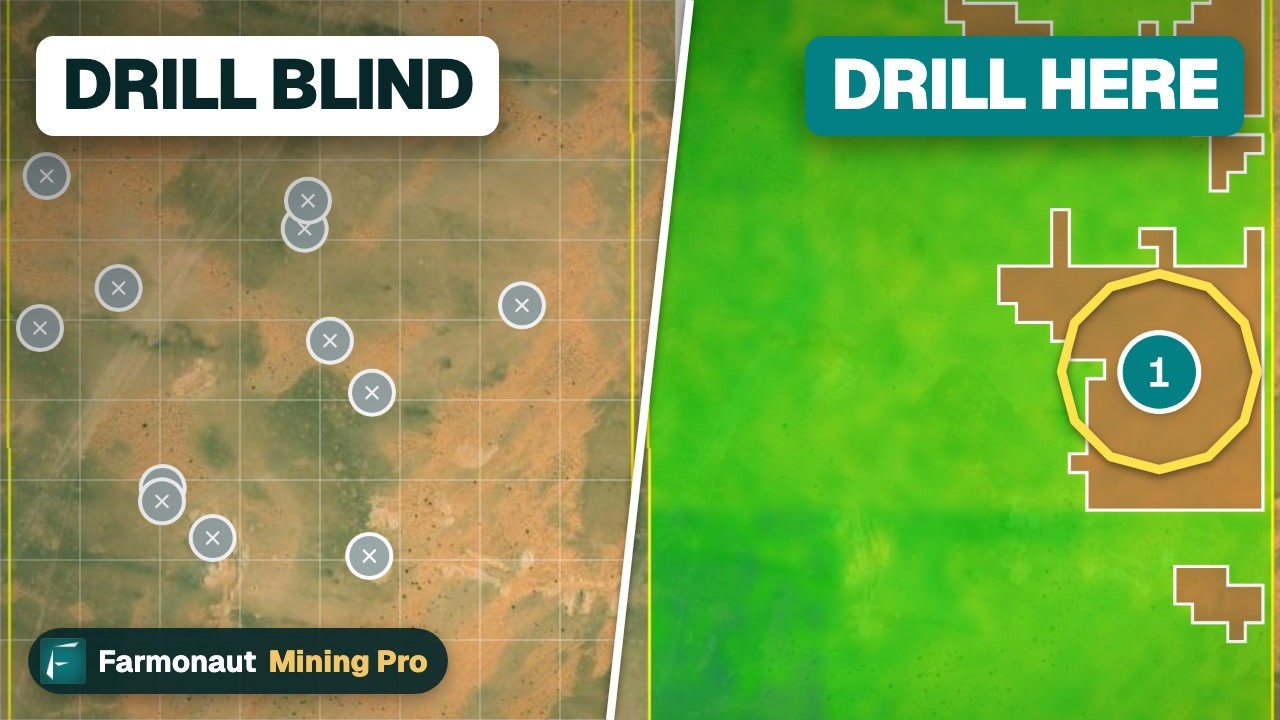
▶ Explains what mining contributes to an economy: exports, jobs, revenue and energy-transition minerals. · 5:03
Who are the biggest mining companies in Australia
Three iron ore producers dominate Western Australia’s Pilbara region, and several other firms lead in gold, lithium and coal. The table lists operating facts from each company’s own latest filing. It is a list of operators, not a ranking by value, and it is not a recommendation to buy or sell any share.
| Company (ASX code) | Main Australian operations | Latest reported operating fact |
|---|---|---|
| BHP (BHP) | Western Australia Iron Ore (WAIO) in the Pilbara; BMA coal and NSW Energy Coal in eastern Australia; Olympic Dam and the Copper South Australia project | FY26 (year to 30 June 2026): 256.9 Mt of iron ore from WAIO on BHP’s share and 291.2 Mt on a 100% basis; group copper about 2 Mt |
| Rio Tinto (RIO) | Pilbara iron ore | First half 2026: Pilbara production 162.3 Mt and sales 157.7 Mt on a 100% basis; 2026 Pilbara sales guidance 323-338 Mt |
| Fortescue (FMG) | Pilbara hematite mines and the Iron Bridge magnetite project | FY26: record 201.3 Mt shipped (198.5 Mt on Fortescue’s share), including 9.0 Mt of Iron Bridge concentrate; FY27 guidance 197-207 Mt |
| Northern Star Resources (NST) | Kalgoorlie (KCGM), Yandal in Western Australia, and Pogo in Alaska | FY27 guidance: 1,500-1,650 thousand ounces of gold sold, of which KCGM 550-650 thousand ounces during its mill ramp-up |
| Greenbushes lithium mine (Talison Lithium) | Hard-rock lithium mine in Western Australia, owned 51% by the Tianqi Lithium Energy Australia venture (Tianqi 51%, IGO 49%) and 49% by Albemarle | Described by IGO as having the highest-grade ore reserve of any hard-rock lithium mine globally |
Sources for the table: BHP operational review, 16 July 2026; Rio Tinto second quarter 2026 production results; Fortescue June 2026 quarterly production report; Northern Star FY26 financial results; IGO, Lithium Joint Venture page.
Production on a “100% basis” counts every tonne from a joint venture, even where the company owns only part of it. “Share” figures count only the company’s ownership. Mixing the two is the most common error in articles that compare miners.
Iron ore: the largest part of Australian mining
Iron ore is made into steel, and the Pilbara in Western Australia is the centre of Australian output: the state’s 864 Mt of volume in 2024-25 compares with GA’s 954 Mt for the whole country in calendar 2024. Western Australia’s iron ore industry employed 65,496 full-time-equivalent (FTE) workers on site in 2024-25, the largest of any commodity in the state (WA Statistics Digest above). The three big producers are all very large, although the figures above cover different measures (production, shipments and sales) and periods: BHP’s WAIO produced 291.2 Mt on a 100% basis in FY26, Fortescue 201.3 Mt, and Rio Tinto sold 157.7 Mt in the first half alone.
Price and cost sit at the centre of the business. Fortescue reported a Hematite C1 unit cost of US$18.74 per wet metric tonne for FY26, and guides to US$20.50-21.75 for FY27 (Fortescue quarterly report above). C1 cost is the direct cost of mining, processing and shipping a tonne to the customer, before royalties and some other charges. For more on iron ore outside Australia, see our guide to iron ore mining innovations and the comparison with iron ore mines in Canada.
Gold and lithium: two markets moving in opposite directions
Gold is Australia’s third-largest export earner in the GA table, and Western Australia produced its largest gold sales on record in 2024-25 (A$29 billion, WA digest above). Gold employed 35,672 FTEs on WA sites, up by almost 4,000 on the year before. Northern Star’s KCGM mill expansion in Kalgoorlie is the project the company itself names as the driver of its next phase of growth. Gold miners also depend on reliable inputs and logistics; our note on supply chain challenges in gold mining covers that side.
Chart
Western Australian lithium sales
A$ billion per financial year
Lithium shows how fast a market can turn. Western Australian lithium sales were A$21.5 billion in 2022-23, A$8.5 billion in 2023-24 and A$4.3 billion in 2024-25, while employment in lithium fell to 9,337 FTEs, more than 2,000 fewer than the year before (WA digest). The same report lists projects that moved to care and maintenance, including Bald Hill, Mt Cattlin and one of the two processing plants at Pilgangoora. Australia still produced 43% of the world’s lithium in 2024 (GA), so the sector is a large producer under price pressure rather than a small one.
Uranium, coal and other commodities
Australia holds 32% of the world’s uranium resources, the largest share of any country, but produced only 4.656 kilotonnes of uranium in 2024 from three operating mines, about 8% of world output (GA). The World Nuclear Association’s country profile shows Olympic Dam and Four Mile in South Australia as the mines with recent output, and notes that Ranger in the Northern Territory stopped production in January 2021 (World Nuclear Association, Australia). For a comparison with another large producer, read our review of uranium mining in the USA.
Black coal is the second-largest export by value: 424 Mt produced in 2024 from 96 mines, and A$85.1 billion of exports (GA). Bauxite, the ore of aluminium, was 100.5 Mt, making Australia the second-largest producer. Rare earth elements are small in tonnes (0.031 Mt of oxide) but Australia ranks third for both production and resources.
How many people work in Australian mining
The Australian Bureau of Statistics (ABS) Labour Account counted 244.6 thousand jobs in mining in June 2026, up from 241.7 thousand in March 2026 (seasonally adjusted). Filled jobs, which count positions actually occupied, were 234.4 thousand, up 4.2% on a year earlier (ABS Labour Account Australia, June 2026). Western Australia’s share of these jobs is shown below.
Western Australia alone had 134,009 FTE on-site mining positions in 2024-25 (a measure that counts hours worked, so it is not a head count), just under the record 135,978 of 2023-24 (WA digest). Iron ore (65,496) and gold (35,672) were the largest employers. Fly-in fly-out rosters, where workers travel to remote sites for a block of days, explain why a mine’s workforce rarely matches the population of its nearest town.
Technology in Australian mines
Large Australian operators run driverless trucks, remote operations centres and battery-electric trials. BHP reported in July 2026 that it is trialling two Caterpillar 793 XE battery-electric haul trucks at WAIO in a collaboration with Rio Tinto and Caterpillar (BHP operational review above). Fleet data, routing and fuel use are the practical gains: our overview of fleet management software and the guide to automated mining explain how those systems work.
Satellites are used before a mine exists and after it closes. Sentinel-2 and similar imagery can screen a tenement for alteration minerals and show vegetation cover over time. These results are exploration targets that need drilling, not resource estimates. Farmonaut offers satellite-based mineral detection for licence owners who want a first look at a site, and a supply-chain traceability service.
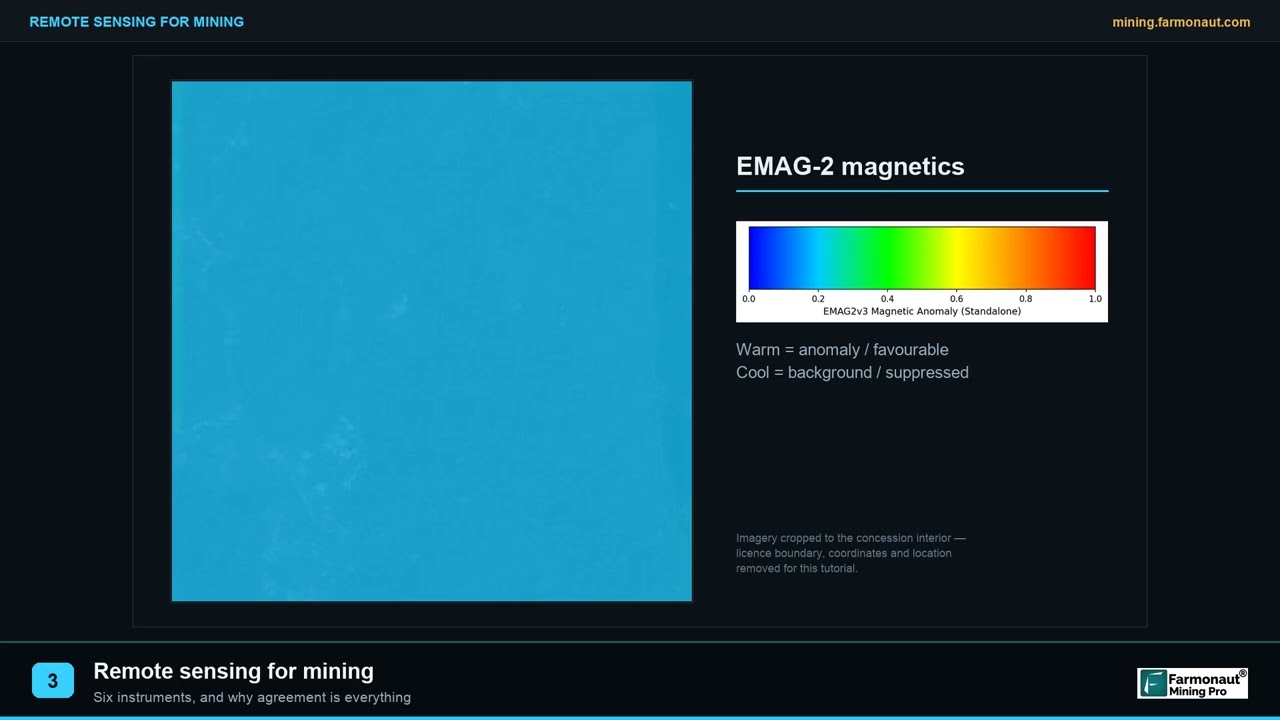
▶ A short explainer of remote sensing for mining and why agreement between instruments matters. · 2:01
Rehabilitation, Indigenous agreements and land
Closing a mine properly takes years and costs money. The World Nuclear Association notes that the Nabarlek uranium site in the Northern Territory has been rehabilitated, and that Rio Tinto raised its stake in Energy Resources of Australia (ERA), the Ranger operator, to 86.33% in February 2020 to fund rehabilitation (WNA profile above); an ERA notice of 21 August 2026 puts that stake at over 98%. Both sites sit on Aboriginal land, and Aboriginal people receive royalties of 4.25% on sales of uranium from Northern Territory mines, with more than A$207 million received from Ranger alone as of the WNA profile.
Olympic Dam in South Australia stands on former pastoral land; its 18,000-hectare lease is managed as a nature reserve (WNA). Consultation with Traditional Owners and heritage rules are part of the approval path for new projects, and they set the timeline as much as geology does. Before staking or buying a tenement, check land access: the video below describes a survey where 59% of the anomalous ground sat under a town and was blocked by land access.
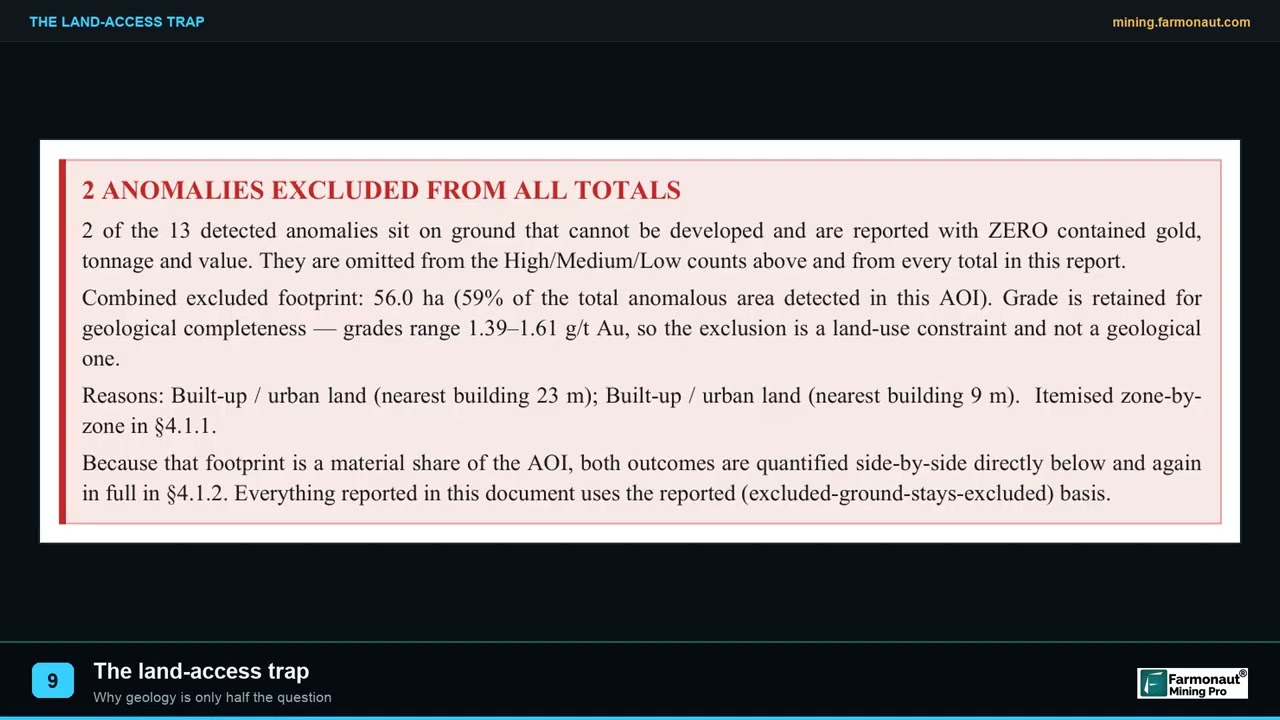
▶ Shows how land access can block good ground: 59% of the anomalous area in one survey sat under a town. · 2:05
What a mine’s revenue and royalty look like
The calculator below suits bulk ores sold by the tonne, such as iron ore or coal, and does not fit gold or lithium concentrate priced per ounce or per grade. It turns an operation’s size into revenue and royalty. Enter your own tonnes, a price, an exchange rate and a royalty rate. Royalty rules differ by state and by commodity, so check the current rate with the state regulator before relying on any result.
Calculator
What are an operation’s revenue and royalty?
Enter your own tonnes, price, exchange rate, cost and royalty rate.
- Royalty at your rate (A$ million): 77
- Revenue per tonne (A$): 153.8
- Margin after cost and royalty (A$ million): 1,062
Example values only, not a benchmark or any company’s figures. Prices are inputs: example, use today’s price. Royalty rates differ by state and commodity, so use the current rate from the regulator. The result is before tax, freight and other charges.
What to watch in Australian mining
- Iron ore guidance: Rio Tinto guides 323-338 Mt of Pilbara sales for 2026 and Fortescue 197-207 Mt for FY27, so company guidance points to broadly similar volumes, while Fortescue guides to a higher unit cost (C1 US$20.50-21.75 per wet tonne for FY27).
- KCGM ramp-up: Northern Star’s expanded Kalgoorlie mill started commissioning in FY26, and its FY27 output depends on how fast it reaches rate.
- Lithium supply: care-and-maintenance decisions in Western Australia show how quickly output responds to price.
- Copper growth: BHP describes development pathways for Copper South Australia, Escondida and Spence in its July 2026 review.
- Workforce: filled mining jobs grew 4.2% in the year to June 2026 (ABS), so skills supply stays a constraint.
Frequently asked questions
How much of the world’s iron ore does Australia produce?
Geoscience Australia puts Australia’s 2024 production at 954 Mt, 38% of world output, which ranks first. The USGS reports a higher Australian figure of 982 Mt on a gross-weight basis, so state which source and basis you use.
What is Australia’s biggest mining export?
Iron ore, at A$127.4 billion in 2024 in GA’s export table, followed by black coal at A$85.1 billion and gold at A$35.7 billion.
Which state has the highest mining sales?
Western Australia, on sales value. Its resources sector made A$220 billion in sales in 2024-25 including oil and gas, and its iron ore sales alone were A$122 billion (WA Department of Mines, Petroleum and Exploration).
Who are the biggest mining companies in Australia?
By Pilbara iron ore output, BHP, Rio Tinto and Fortescue lead. In gold, Northern Star Resources runs the Kalgoorlie, Yandal and Pogo operations, and in lithium the Greenbushes mine is owned by the Tianqi-IGO venture and Albemarle.
How many people work in Australian mining?
The ABS Labour Account shows 244.6 thousand mining jobs and 234.4 thousand filled jobs in June 2026.
Does Australia have the most gold in the ground?
Yes by identified resources: GA ranks Australia first with 20% of world gold resources, with EDR of 12,955 tonnes. Production ranks third, with 284 tonnes in 2024.
Why did Australian lithium sales fall?
Western Australian lithium sales dropped from A$21.5 billion in 2022-23 to A$4.3 billion in 2024-25 as prices fell, and several projects moved to care and maintenance.
Is uranium mined in Australia?
Yes. GA counts three operating mines and 4.656 kt of uranium in 2024. Australia has the world’s largest uranium resources at 32% of the total.
How is a mine in Australia rehabilitated?
Operators plan closure and set aside funds. The Nabarlek site is rehabilitated, and the Ranger operator is working through rehabilitation after production ended in 2021 (WNA).
What is the difference between 100% basis and share production?
A 100% basis counts all output of a joint venture. A share figure counts only the reporting company’s ownership. BHP’s WAIO, for example, is 256.9 Mt on its share and 291.2 Mt at 100%.
Can satellites help explore in Australia?
They can screen large tenements for alteration minerals and structures before field work. The output is an exploration target, and drilling is still needed to define a resource.
This page is for information only. It is not investment advice or legal advice. Company figures are from their own filings on the dates shown. Confirm royalty and licence rules with the state regulator.
Farmonaut mining
Map your mining site from space
Consultants can see how satellite data screens a site for exploration targets before field work starts.

Mining Pro sample view, synthetic data
Keep reading
Sources
- Geoscience Australia, Australia’s Identified Mineral Resources 2025: Commodity Summaries: ga.gov.au
- USGS, Mineral Commodity Summaries 2026: Iron Ore: pubs.usgs.gov
- WA Department of Mines, Petroleum and Exploration, 2024-25 Statistics Digest: wa.gov.au
- BHP, Operational review for the year ended 30 June 2026 (ASX, 16 July 2026): announcements.asx.com.au
- Rio Tinto, second quarter 2026 production results: riotinto.com
- Fortescue, June 2026 quarterly production report (ASX, 31 July 2026): announcements.asx.com.au
- Northern Star Resources, FY26 financial results (ASX, 20 August 2026): announcements.asx.com.au
- IGO, Lithium Joint Venture (Greenbushes): igo.com.au
- ABS, Labour Account Australia, June 2026: abs.gov.au
- World Nuclear Association, Australia’s uranium: world-nuclear.org
Discussion
Questions, corrections or field experience? Share them below. First-time comments are reviewed before they appear, and your email is never published.
No comments yet. Be the first to add a question or your experience.

 SRK Consulting
 Berks Gold Limited
 Mwerezi Minerals Company Limited
 Mining SARL
 SenGold Invest SAS
 Sania Corporation
 Sean Mining Limited
 NTS Group (Pty) Ltd
 Mine4Africa
 Lithspo Minerals Limited
 Tintina Mining Group
 Dalgety Minerals Pty Ltd
 Vortex Minerals Pty Ltd
 Faith At Work (Pty) Ltd
 Geotech Mining Solutions plc
 Vulcan International Limited

 Licence holder · Nigeria · Gold + lithium










