

Reviewed August 2026 against USDA Economic Research Service data and industry market research (IMARC Group, AgFunderNews).
Try it: Estimated annual net return improvement: — →
Table of Contents
- How Many US Farms Actually Use Autonomous Machinery?
- Farm Drones: Adoption Numbers, Not Just Hype
- Autonomous Robotics in Agriculture: Where the Money Is Going
- Comparison Table: Drones, Autonomous Tractors, and Robot Pickers
- Autonomous Pickers: What “24/7 Harvesting” Actually Means
- Farm Robot vs. Autonomous Machinery: What’s the Difference?
- The Autonomous Multifunctional Agriculture Robot Market
- Multi-Robot Systems: Coordinating Drones, Tractors, and Pickers
- Calculator: Is a Robotic Milking or Aerial Imagery Switch Worth It?
- Data-Driven Agriculture Ecosystems
- How Farmonaut Fits Into This
- Barriers to Adoption, and What Would Change Them
- Frequently Asked Questions
- Where This Is Actually Headed
- Try it: Estimated annual net return improvement: —
How Many US Farms Actually Use Autonomous Machinery?
Twenty-seven percent of US farms and ranches reported using some form of precision agriculture technology, per the USDA Economic Research Service’s 2023 survey data. Autosteering guidance systems, the most mature form of farm autonomy, are already on 70% of large-scale US crop farms and 52% of midsize operations. Robotic pickers and fully autonomous drone swarms, by contrast, remain a small fraction of that — the adoption gap between “autonomous navigation” and “autonomous harvesting” is the real story here, not a uniform robot revolution.
This page answers what people are actually asking: how many farm drones are in use, whether autonomous pickers exist commercially, what a “farm robot” is versus a tractor with GPS, and how big the autonomous multifunctional agriculture robot market actually is. Every figure below comes from USDA’s Economic Research Service or named industry market research, with the date it was measured and where to check for a newer number.

Farm Drones: Adoption Numbers, Not Just Hype
The most recent USDA figures on aerial imagery use by row-crop growers come from the Agricultural Resource Management Survey (ARMS): 7.0% of US corn acres were treated using aerial imagery in 2016, and 9.8% of US soybean acres in 2018, according to USDA’s Economic Research Service chart of note on the topic. Those are the only official government percentages that exist for drone-based crop imagery adoption at the acreage level — there is no newer USDA figure covering total US cropland under drone application, and industry reports on drone-sprayer acreage since then have not been quantified by USDA. If you need a current number for your own state or crop, USDA ARMS is fielded annually on a rotating subset of commodities; check the ERS Data Products page for the latest published cycle before quoting a percentage.
What has scaled since 2016–2018 is the market size behind the hardware, not necessarily the share of acres actually flown. The US agricultural robots market — which includes drones alongside autonomous ground equipment — was sized at $3.43 billion in 2025, per IMARC Group’s market research.
- What drones are actually used for on US farms: aerial surveys for crop health, soil moisture mapping, pest scouting, and targeted spray verification — feeding data into farm management software rather than replacing ground equipment.
- Where adoption concentrates: row crops (corn, soybeans) and specialty/high-value crops where per-acre imagery cost is easier to justify.
- The gap AI Overviews won’t tell you: “farm drones” as a market category is large and growing, but the acreage actually receiving drone-based treatment, per the last USDA figures available, was still single digits to low double digits by crop.

Autonomous Robotics in Agriculture: Where the Money Is Going
“Autonomous robotics in agriculture” as a category spans four distinct machine classes with very different adoption curves: guidance/autosteering (mature, majority adoption on large farms), yield-mapping and soil-mapping sensors (68% of large-scale US crop farms per USDA ERS 2023 data), robotic milking (a minority but growing dairy technology), and robotic harvesting (still a narrow, high-value-crop niche).
The clearest dollar figure available is the $3.43 billion US agricultural robots market size for 2025 from IMARC Group. That figure covers robots broadly — it is not broken out by tractor units sold, drone units in the field, or picker units deployed, and no official US source currently publishes that breakdown. If your interest is unit-level penetration for a specific machine category, IMARC’s published methodology and comparable reports from firms like Grand View Research update their market sizing annually; check their current release rather than reusing this figure past its cycle.
Robotic milking is the one sub-category with a clean before/after USDA number: 6% of US milk production came from robotic milking systems in 2021, rising to 13% adoption among midsized dairy farms (150–499 head), per USDA’s Economic Research Service. Farms that adopted robotic milking saw a net return improvement of $3.15 per hundredweight (cwt) of milk compared to non-adopters, in the same 2021 USDA analysis.
| Technology | Adoption Figure | Year Measured | Source |
|---|---|---|---|
| Guidance autosteering — large-scale crop farms | 70% | 2023 | USDA ERS |
| Guidance autosteering — midsize crop farms | 52% | 2023 | USDA ERS |
| Any precision ag technology — all US farms/ranches | 27% | 2023 | USDA ERS |
| Yield monitors, yield maps, soil maps — large-scale farms | 68% | 2023 | USDA ERS |
| Robotic milking — US milk production share | 6% | 2021 | USDA ERS |
| Robotic milking — midsized dairy farms (150–499 head) | 13% | 2021 | USDA ERS |
| Robotic strawberry harvesting — California acreage | 12% | 2025 | Industry reporting (AgFunderNews) |
| Aerial imagery — US corn acres | 7.0% | 2016 | USDA ERS / ARMS |
| Aerial imagery — US soybean acres | 9.8% | 2018 | USDA ERS / ARMS |
Comparison Table: Drones, Autonomous Tractors, and Robot Pickers
This is the table an AI Overview cannot generate for you, because it requires cross-referencing multiple USDA survey cycles and one industry report side by side:
| Machine Category | Best Available US Adoption Figure | Measured | Maturity Signal | Where to Verify Current Figure |
|---|---|---|---|---|
| Drones (aerial imagery) | 7.0% of corn acres, 9.8% of soybean acres | 2016 / 2018 | Niche, no newer USDA acreage figure published | USDA ERS Charts of Note, next Census of Agriculture 2028 |
| Guidance autosteering (tractors/harvesters) | 70% large farms, 52% midsize farms | 2023 | Mainstream on large operations | USDA ERS chartId=110550 |
| Robotic milking | 6% of milk production, 13% of midsized dairies | 2021 | Growing minority, strongest ROI data available | USDA ERS Charts of Note (114194) and Publications (113704) |
| Robotic harvesting (specialty crop) | 12% of California strawberry acreage | 2025 | Early, crop- and region-specific | AgFunderNews / Western Growers reporting |
| Any precision ag technology | 27% of all US farms/ranches | 2023 | Broad category, includes low-cost tools | USDA ERS pubid=110559 |
Autonomous Pickers: What “24/7 Harvesting” Actually Means
Autonomous pickers are commercially deployed today, but narrowly. The clearest documented figure is California’s commercial strawberry sector, where 12% of acreage used robotic harvesting systems in 2025, according to industry reporting covered by AgFunderNews citing a Western Growers report. That is the only crop- and region-specific autonomous-harvesting adoption percentage currently available from a named source — broader US specialty-crop harvesting adoption across other fruits and vegetables has not been quantified in an official government dataset. If you grow a different crop and want a comparable figure, the method is the same one used for strawberries: check current Western Growers Association reporting and AgFunderNews coverage, since USDA does not yet track robotic harvesting adoption in ARMS.
- Why strawberries first: high per-acre labor cost and a defined, repeatable ripeness signal that machine vision can detect reliably.
- Why row-crop harvesting autonomy lags: combines and pickers for corn, soybeans, and grain already use guidance autosteering (the 70%/52% figures above) — the harvesting head itself is not yet autonomous end to end on most large-scale row-crop operations.
- The honest gap: no single figure exists for “autonomous pickers, all US specialty crops” — treat any number you see for that broader claim as unsourced until it cites a specific crop and year.

Farm Robot vs. Autonomous Machinery: What’s the Difference?
“Farm robot” and “autonomous machinery” get used interchangeably in search, but they describe different things in USDA’s own survey categories:
- Autonomous machinery typically refers to guidance and autosteering systems retrofitted onto or built into existing tractors and harvesters — the 70%/52% large-farm/midsize-farm figures above. This is the most widely adopted category by a wide margin.
- Farm robot more often refers to purpose-built platforms: robotic milkers, robotic pickers, or multifunctional field robots that were designed autonomous from the ground up rather than retrofitted. Adoption here is far lower — the 6%–13% robotic milking range and the 12% strawberry-harvesting figure are the two hard numbers available for this category.
For a deeper technical breakdown of specific robot platforms on the market, see Farmonaut’s roundup of seven agricultural robots transforming farming operations, and for the retrofit path — adding autonomy to equipment you already own rather than buying a purpose-built robot — see the autonomous retrofit market trends analysis.
The Autonomous Multifunctional Agriculture Robot Market
The autonomous multifunctional agriculture robot market — platforms designed to swap tools and handle planting, weeding, spraying, and harvesting on one chassis rather than a single-purpose machine — sits inside the broader $3.43 billion US agricultural robots market figure from IMARC Group for 2025. There is currently no separate US government or named industry figure that isolates multifunctional platforms from single-task robots (a picker versus a sprayer versus a multi-tool platform) at the unit or dollar level. If you need that breakdown for a specific investment or purchasing decision, request the segmented dataset directly from IMARC Group or a comparable market research firm — their published summaries name the total but not always the sub-segment split by machine function.
- The multifunctional pitch is capital efficiency: one chassis instead of three or four single-task machines.
- Real-world deployment today skews toward single-task robots (milkers, pickers) precisely because task-specific machine vision and mechanical design are easier to validate and sell than a general-purpose platform.
- Multifunctional platforms depend on the same guidance and sensor infrastructure already present on 70% of large-scale farms — they are an upgrade path, not a replacement of that base layer.
Multi-Robot Systems: Coordinating Drones, Tractors, and Pickers
A multi-robot system on a working farm typically means a drone flight identifying a problem area, a farm management platform routing that data to a ground vehicle or sprayer, and — on the small share of farms using robotic milking or harvesting — a purpose-built robot executing the physical task. The coordination layer, not any single machine, is what makes the categories above additive rather than redundant: a farm can run guidance-autosteering tractors (mature, 52–70% adoption) alongside aerial imagery (7–10% of acres by crop) and still have zero autonomous harvesting, because each layer has adopted on its own separate curve.
- Data layer: satellite and drone imagery feeding a farm management system.
- Navigation layer: guidance autosteering on tractors and harvesters — the most mature layer at 52–70% adoption.
- Execution layer: task-specific robots (milkers, pickers) — the least mature layer, concentrated in dairy and specialty crops.

Calculator: Is a Robotic Milking or Aerial Imagery Switch Worth It?
Use the documented $3.15/cwt net return improvement for robotic milking and your own herd size to see the annual dollar difference before you model anything else.
Estimated annual net return improvement: —
Assumes the $3.15/cwt figure (USDA ERS, 2021) applies uniformly to your herd; it excludes robot purchase and financing costs, labor reallocation, and milk-price volatility. This is a directional estimate, not a purchasing decision — get a dealer quote and your own milk-price forecast before committing capital.
Data-Driven Agriculture Ecosystems
None of the machine categories above work in isolation. Guidance autosteering, aerial imagery, and robotic execution all depend on the same underlying data layer: satellite and drone imagery, on-ground sensors, and a management platform that turns raw readings into an action. Farms that have already adopted the mature layer (autosteering, at 52–70%) are the ones positioned to add the newer, lower-adoption layers (drones at 7–10% of acres by crop, robotic milking at 6–13%) without rebuilding their data infrastructure from scratch.
- Resource optimization: real-time health, moisture, and nutrient data lets inputs get applied only where and when needed.
- Environmental impact monitoring: satellite and drone-based insight tracks carbon footprint and identifies which fields respond best to reduced-input practices.
- Traceability: blockchain-based tracking follows a harvest from field to buyer, which matters increasingly for export compliance and retailer requirements.



Developers integrating autonomous-machinery data into their own systems can use Farmonaut's satellite and weather API and the accompanying API developer documentation to combine imagery and advisory data programmatically.
For fleets running multiple autonomous or semi-autonomous vehicles across large acreage, the Large Scale Farm Management Tool handles field mapping, monitoring, and modular resource planning at scale.
Tracking the environmental side of an autonomy investment — lower fuel and input use from precision application — is handled through Farmonaut Carbon Footprinting, which monitors emissions against climate targets.

Supply chain transparency is handled through Farmonaut's Traceability Product, which uses blockchain to secure field-to-distribution tracking.
How Farmonaut Fits Into This
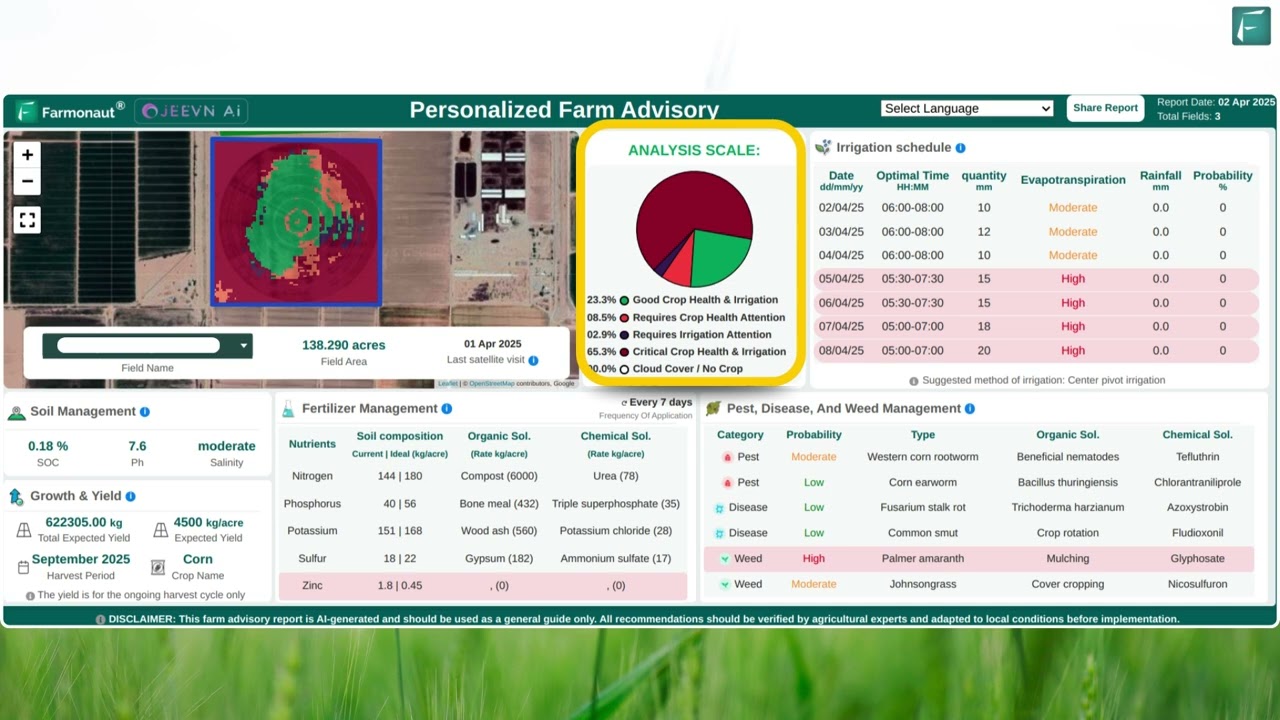
Farmonaut combines satellite imagery, AI, blockchain, and machine learning to deliver actionable farm intelligence through mobile and web apps and scalable APIs, aimed at making high-end data accessible from individual growers to large agribusinesses.
Our Jeevn AI system provides real-time advisory for day-to-day farm decisions, and our blockchain tools support traceability and authenticity claims across a supply chain. The platform is built to serve several different users:
- Individual growers optimizing crop health and resource allocation with satellite and drone-based monitoring.
- Businesses implementing traceability protocols and fleet or resource management tools.
- Governments and policymakers planning agricultural and infrastructure resource allocation.
- Financial institutions using satellite verification for crop loan and insurance approvals, detailed on our Crop Loan & Insurance page.

Our Fleet Management tools help track agricultural vehicles and equipment in real time, and for irrigation-adjacent automation that pairs well with autonomous field equipment, see our guide to automatic watering systems.
Barriers to Adoption, and What Would Change Them
The gap between the mature-layer adoption figures (70% autosteering on large farms) and the execution-layer figures (6–13% robotic milking, 12% robotic strawberry harvesting) is not primarily a technology problem — it is capital, integration, and connectivity:
- Upfront cost: purpose-built robots (milkers, pickers) carry higher capital cost per unit than a retrofit guidance kit, which is why autosteering scaled first and fastest.
- Farm size threshold: the 70% vs. 52% gap between large-scale and midsize farms on the exact same technology shows scale still determines who can absorb the upfront cost — smaller operations adopt later and at lower rates on every category measured.
- Integration with legacy equipment: mixing a retrofit-autonomous tractor fleet with new purpose-built robots requires a shared data layer; farms without that layer already in place face a harder second purchase.
- Connectivity: real-time coordination between drones, ground equipment, and cloud analytics needs reliable rural broadband or cellular coverage, which is uneven across US farm regions.
- Workforce transition: autonomy shifts labor demand toward data analysis, equipment maintenance, and system oversight rather than eliminating labor need outright.
What would move these figures: USDA's next Census of Agriculture (2028) will reset the baseline on precision technology adoption across all categories; watch the ERS Data Products page for the interim ARMS releases between now and then, since ARMS surveys a rotating subset of commodities annually rather than a full census every year.
Frequently Asked Questions
1. How many farm drones are actually in use on US farms?
There is no official US count of drone units in the field. The best available acreage-level figures are from USDA's ARMS survey: 7.0% of corn acres (2016) and 9.8% of soybean acres (2018) were treated using aerial imagery. No newer USDA acreage figure has been published for drone-based crop treatment; check the ERS Data Products page for the next survey cycle.
2. Do autonomous pickers exist commercially, or is it still experimental?
They exist commercially in specific crops. California's strawberry sector reported 12% of commercial acreage using robotic harvesting systems in 2025, per industry reporting. Broader adoption across other specialty crops has not been quantified by an official government source yet.
3. What's the difference between a "farm robot" and "autonomous machinery"?
Autonomous machinery generally means guidance and autosteering added to existing tractors and harvesters — 70% of large-scale US crop farms and 52% of midsize farms use this, per USDA ERS 2023 data. "Farm robot" more often refers to purpose-built platforms like robotic milkers or pickers, which have much lower adoption (6–13% for milking, 12% for California strawberry harvesting).
4. How big is the autonomous multifunctional agriculture robot market?
It sits inside the broader $3.43 billion US agricultural robots market figure for 2025 from IMARC Group. No published source currently isolates multifunctional platforms from single-task robots at the dollar or unit level — request a segmented dataset from a market research firm if you need that specific breakdown.
5. Is autonomous farm machinery worth the cost for a midsize operation?
The clearest documented ROI figure is for robotic milking: a $3.15 per hundredweight net return improvement over non-adopters, per USDA's 2021 analysis. That figure, combined with your herd size and milk yield, can be modeled with the calculator above. For other categories (drones, pickers), no equivalent net-return figure has been published by USDA; model your own costs against the adoption-rate context in the comparison table above.
6. How does Farmonaut support autonomous farm operations?
Farmonaut provides satellite imagery, AI-based advisory, blockchain traceability, fleet and resource management, and carbon footprinting through mobile/web platforms and APIs — the data layer that autonomous machinery of any category depends on to act on real conditions rather than a fixed schedule.

Where This Is Actually Headed
The pattern across every figure in this article is consistent: navigation autonomy (guidance autosteering) is mainstream at 52–70% adoption on US crop farms; data-collection autonomy (drones) sits at single digits to low double digits of acreage by crop as of the last USDA measurement; and execution autonomy (robotic milking, robotic picking) remains a minority technology concentrated in dairy and specific specialty crops, with real but narrow adoption figures of 6–13% and 12% respectively.
That order — navigate, then sense, then execute — is a reasonable guide to what adopts next on any given farm, and it is why the $3.43 billion US agricultural robots market figure for 2025 covers such a wide range of maturity levels under one number. The reader who wants a fresher figure than the ones cited here has a clear path: USDA's ERS Charts of Note page for anything precision-ag or dairy-related, the next full Census of Agriculture in 2028, and named industry reports (IMARC Group, AgFunderNews/Western Growers) for market sizing and specialty-crop harvesting, respectively — each cited above with its measurement year so it is checkable rather than assumed.
For a closer look at specific robot platforms already on the market, see seven agricultural robots transforming farming operations, and for the retrofit path onto equipment you already own, see the autonomous retrofit market trends analysis.

 UCAL Fuel Systems
 Kubota
 FFBS
FFBS Jontra
 Kalustyan
 Tucor
Tucor Geno
Geno Hayleys Agriculture
 Linx Agritech
 Adinet
 Save Your Soils
 Grandstream Algérie
 XOS Realty
 Geospatial Lab Africa
 Agro La Gándara
