

Reviewed August 2026 against USDA Economic Research Service and IMARC Group.
Try it: Drone vs. Satellite Field-Coverage Calculator →
The United States drones market was valued at $7.6 billion in 2024 and is projected by IMARC Group to reach $19.3 billion by 2033, a compound annual growth rate of 10.46% across 2025–2033. But the headline number hides the more useful story: agricultural drone adoption on actual U.S. farms is still low single-to-low-double digits by crop, according to USDA’s own survey data, while smart-agriculture spending (satellites, sensors, and software alongside drones) is growing faster than the airframes themselves. This page breaks the market down by segment, by crop, and by region, with sourced figures rather than a single blended forecast.


U.S. Drones Market Overview
The United States drones market spans recreational flyers, commercial service operators, and the specialized industrial segment — agriculture, infrastructure inspection, delivery, and public-safety response — that drives most of the near-term revenue growth. IMARC Group puts the 2024 base at $7.6 billion, rising to an estimated $19.3 billion by 2033 (United States Commercial Drones Market, IMARC Group). That trajectory sits inside the broader smart agriculture category, which bundles drones with satellite imagery, IoT soil sensors, and farm-management software — a bigger, slower-moving market that most searches for “smart agriculture” are actually trying to size.
The distinction matters for anyone trying to size the opportunity correctly: the agriculture drones market specifically (airframes, sensors, and flight software sold for farm use) is a narrower slice than “smart agriculture” as a whole, and narrower still than the general drone technology category that also covers construction, logistics, and defense. IMARC Group tracks the United States Agriculture Drones Market as its own line item precisely because blending it into the general drones number overstates how fast farms are actually buying and flying hardware.
Market Size, Growth & CAGR Insights
- U.S. drones market valued at $7.6 billion in 2024
- Projected to reach $19.3 billion by 2033
- CAGR: 10.46%, 2025–2033 (IMARC Group)
That growth is not evenly distributed across use cases. Agricultural monitoring, delivery, and infrastructure inspection are scaling faster than recreational and hobbyist segments because each solves a specific, measurable cost problem — fewer scouting hours, faster inspection cycles, lower per-mile delivery cost. The rest of this article works through where that growth is concentrated and, just as importantly, where farm-level adoption still lags the market-size forecasts.



Want to access real-time satellite data for farm management, environmental monitoring, and more? Check our Satellite Data API and in-depth Developer Docs.
Market Drivers and Key Trends
Five forces are shaping drone technology adoption in the United States right now, and each maps to a different buyer:
- Sensor and battery advances: Longer flight times and multispectral/thermal payloads are what turned drones from a novelty into a scouting tool that can cover a section of farmland or a mile of pipeline in a single flight.
- Commercial applications expansion: Drones in agriculture, infrastructure inspection, emergency response, mapping, and delivery are the segments pulling capital and pilots into the industry.
- Public-safety and wildland-response demand: Firefighting and search-and-rescue programs are a distinct regulatory and procurement track from farm or delivery drones (see the firefighting section below).
- Regulatory clarity from the FAA: Remote ID, Part 107 waivers, and evolving beyond-visual-line-of-sight (BVLOS) rules reduce the legal uncertainty that had kept larger operators cautious.
- Falling sensor cost per acre: As multispectral cameras get cheaper, the per-acre cost of a drone flight drops toward the price point where mid-size farms, not just large operations, can justify owning rather than contracting the equipment.


Key U.S. Drones Market Segments & Growth Estimates
Segment-level sizing helps separate the agricultural drone market from the broader commercial-drone story that dominates headline CAGR figures. The table below groups the main application areas tracked across current industry research; treat the dollar figures as directional estimates rather than audited totals, since methodologies differ between research houses.
| Application Segment | Relative Growth Rate | Key Drivers |
|---|---|---|
| Aerial Surveillance | Moderate-high | Real-time imaging, AI-based tracking, extended flight times |
| Agriculture & Monitoring | High | Precision farming, NDVI, multispectral imaging, analytics |
| Delivery Services | High | Autonomous navigation, payload capacity, obstacle avoidance |
| Infrastructure Inspection | Moderate-high | High-res mapping, thermal imaging, real-time data |
| Mapping & Surveying | Moderate | LiDAR, photogrammetry, geospatial analytics |
| Firefighting & Wildland Response | Not separately published here | See firefighting section below for sourcing and gaps |
For sector-specific dollar and unit-shipment figures on any one row, the most defensible primary sources are the IMARC Group country reports linked throughout this article — each covers a single application vertical rather than blending them into one number.
United States Agriculture Drones Market: Adoption by Crop
This is the number that market-size dollar figures skip past: how many U.S. farms are actually flying drones. USDA’s Economic Research Service pulled crop-specific aerial-imagery adoption rates from its Agricultural Resource Management Survey (ARMS), and the rates are still modest relative to how the “market” is often described. On soybean planted acres, 9.8% used aerial imagery per the 2018 ARMS survey. Corn planted acres stood at 7.0% per the 2016 ARMS survey. Sorghum planted acres came in at 4.6% per the 2019 survey, winter wheat planted acres at 3.5% per the 2017 survey, and cotton planted acres at just 2.8% per the 2019 survey (USDA Economic Research Service, Charts of Note).
Two things follow from that spread. First, “aerial imagery” in the ARMS survey includes both drone-based and manned-aircraft or satellite-sourced imagery, so it is a ceiling on drone-specific adoption, not a floor — actual drone-only adoption is very likely lower than these percentages. Second, the gap between crops is wide enough that a blanket “agriculture drones market” narrative misses the real picture: soybean growers are adopting aerial imagery at roughly 3.5 times the rate of cotton growers, which says as much about field size, canopy structure, and existing scouting practice as it does about drone technology itself.
These figures come from the 2016–2019 ARMS survey cycles — USDA runs a new ARMS iteration roughly every five years, and the next round of crop-level adoption data becomes available through the USDA NASS QuickStats portal (nass.usda.gov). If you need adoption numbers newer than the ones cited here, that portal — not a market-research vendor’s blended estimate — is the primary source to query, filtered by crop and by state.
For a country-specific commercial sizing of this same segment in dollar terms, IMARC Group’s United States Agriculture Drones Market report tracks it separately from the general commercial-drone number above. Readers comparing across North America should also note IMARC’s Mexico-specific coverage: Mexico Agriculture Drones Market and the broader Mexico Drones Market, since regulatory and cost structures differ materially from the U.S. Part 107/137 framework.
Farm-level takeaway: if your operation grows soybeans or corn, you’re in the crop segment with the highest recorded aerial-imagery usage, and a drone or satellite-based scouting workflow is well-precedented among peers. If you grow cotton or wheat, adoption is thinner — which can mean either less proven ROI in your specific crop, or an underexploited opportunity, depending on your field size and existing scouting cost. Either way, drones in agriculture pair naturally with satellite monitoring for the acres a drone can’t economically cover every week.
United States Firefighting Drones Market
Firefighting and wildland-response drones are a distinct market from row-crop agricultural drones — different payloads (thermal imaging, retardant-adjacent sensing rather than multispectral crop cameras), different buyers (fire agencies and forestry services rather than farm operators), and a different regulatory track (emergency-authorization flight rules rather than Part 137 agricultural spraying certification). IMARC Group covers this vertical on its own terms in the United States Firefighting Drones Market report, which is the primary source to consult for unit shipments, dollar sizing, and growth rate specific to this segment — the research brief behind this article does not carry an independently verified dollar figure for firefighting drones, so this piece states that gap plainly rather than borrowing a number from the general commercial-drone estimate above.
If you need current sizing for wildland-response drone procurement, the IMARC report link above, cross-checked against FAA public summary reports on Part 137 and emergency-operation certificate holders (faa.gov/uas/), is the correct method — not a figure interpolated from the general drones-market CAGR, since firefighting drones follow their own procurement cycle tied to state and federal wildfire budgets rather than commercial ROI.
Where Indoor Farming Fits — and Where It Doesn’t
Indoor farming (vertical farms, controlled-environment agriculture) is a separate market from outdoor drone-based crop monitoring, and it’s worth naming that boundary explicitly rather than blending the two. IMARC Group values the U.S. indoor farming market at $4.8 billion in 2024, with a forecast reaching $10.9 billion by 2033 (IMARC Group, United States Indoor Farming Market). That’s a real and fast-growing category, but it is structurally not a drone use case: indoor and vertical farms operate under roofs, in warehouses, or in sealed greenhouse bays, where fixed-wing or rotary drone flight is either impossible or unnecessary — sensor monitoring there is done with stationary IoT sensors and fixed cameras, not aerial imagery.
If your search brought you here looking for indoor or vertical farming market sizing specifically, the $4.8 billion 2024 baseline and $10.9 billion 2033 forecast above are the figures to work from — but the rest of this article, and Farmonaut’s satellite and drone-adjacent tools described below, are built for outdoor field monitoring across open acreage, not for controlled-environment facilities.
Drone vs. Satellite Field-Coverage Calculator
Assumptions: one flight covers the stated acreage in the stated time at a fixed altitude and speed; does not include battery-swap time between flights, weather delays, no-fly buffer zones, or FAA Part 107/137 waiver requirements. Adoption rates are USDA ARMS survey figures for aerial imagery generally (drone, manned aircraft, or satellite), not drone flights specifically — treat them as a peer-comparison benchmark, not your own required coverage.
Technology Advancements Shaping the U.S. Drones Market
The core technology trends underpinning growth across every segment above:
- AI and machine learning integration: Driving autonomous navigation, image recognition, and analytics pipelines that turn raw aerial imagery into flagged problem areas rather than raw pixels a person has to review manually.
- Extended battery life and flight time: Longer missions make delivery, mapping, and remote inspection economically viable over larger areas per flight.
- Obstacle avoidance and safety sensors: LiDAR, ultrasonic, and stereo-camera systems reduce collision risk in both urban infrastructure work and rural field operations.
- Greater payload capacity: Heavy-lift drones extend commercial use into infrastructure inspection and disaster-response supply delivery.
- Real-time data collection: Cloud integration and on-board analytics shrink the time between a flight and an actionable result.

Agricultural Monitoring: Drones and Satellites Together
Given that even the highest-adopting crop (soybeans, at 9.8% aerial-imagery use per USDA ARMS) still leaves the large majority of acreage unmonitored from the air on any given week, satellite monitoring is the practical way to close the coverage gap between drone flights. Farmonaut's platform complements — rather than replaces — drone scouting with:
- Multispectral satellite imagery for crop health analysis (NDVI, soil moisture)
- Real-time alerts for pest, disease, and water stress, reducing input waste
- AI-driven advisory for weather, fertilizer, irrigation, and resource management
- Blockchain-powered product traceability for transparent supply-chain data
- Fleet management for agricultural machinery, so drones, ground equipment, and satellite data work from the same operational picture
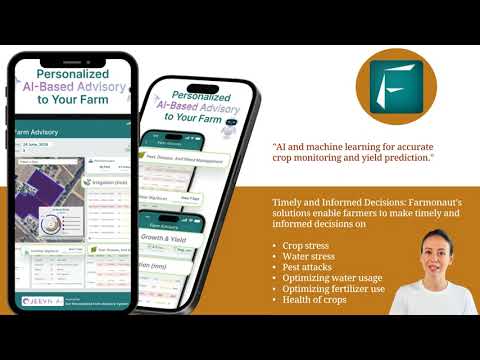
Farmonaut's mobile and browser-based apps make this monitoring approach available to farms of any size. The large-scale farm management platform supports field monitoring, advisory, and compliance reporting for U.S. agricultural operations, and sustainability-focused operations can track and reduce emissions through carbon footprint tracking.
Learn more about Farmonaut's crop plantation & forest advisory tools and scalable solutions for the agricultural sector.
Drone Regulatory Compliance & Safety Innovations
Drone operators in the United States work within a framework set primarily by the FAA:
- Part 107 and Part 137: Part 107 governs general commercial small-drone operations; Part 137 specifically covers agricultural aircraft operations, including spraying — the FAA's Advanced Operations guidance for chemical dispensing lays out certification requirements for this use case (FAA, Dispensing Chemicals from UAS).
- Remote ID: Mandatory drone-tracking requirements strengthen airspace attribution and security.
- BVLOS and night-flight rules: Evolving beyond-visual-line-of-sight and nighttime operating rules are steadily widening what commercial operators can do without a case-by-case waiver.
- Safety features: Geofencing, precision GPS, and automated return-to-home protocols are now standard on most commercial-grade platforms.
- Insurance and verification: Satellite-based field verification, as Farmonaut provides, supports crop loan and insurance processing where lenders need independent confirmation of field condition or acreage.
For agricultural operators specifically, Part 137 certification is the regulatory line to check before contracting or operating a spray drone — general Part 107 certification alone does not cover agricultural dispensing. The FAA's public UAS pages (faa.gov/uas/) track current certificate-holder counts and rule updates; check there directly for numbers newer than any figure published here, since certification counts change monthly.
Market Segmentation & Regional Analysis
The United States drones market breaks down by airframe type, payload class, end-use industry, and region.
Type & Payload Segmentation
- Fixed wing: Long-range, high-endurance mapping and surveillance missions.
- Rotary wing: Agility and vertical take-off/landing for site-specific commercial work, including most agricultural scouting and spraying platforms.
- Hybrid: Combines rotary versatility with fixed-wing endurance for emerging use cases.
- Sub-25 kg payload: Dominant class for recreational and standard commercial tasks, including most row-crop scouting drones.
- 25–170 kg payload: Growing segment for delivery drones and specialty inspection.
- 170+ kg payload: Niche today, but relevant to future heavy-lift logistics.
End-Use Industry
Core demand comes from construction, agriculture, military and defense, law enforcement, logistics, and media.
Regional Breakdown
- Northeast: Tech and R&D hubs with dense regulatory activity; strong construction and infrastructure use.
- Midwest: The core of U.S. row-crop agricultural drone adoption — the region where the USDA crop-adoption figures above are concentrated.
- South: Logistics, border surveillance, energy, and resource-sector growth.
- West: Innovation in technology, entertainment, and utility-sector inspection, plus wildland-fire response relevant to the firefighting segment above.
Explore related research:
Mexico Agriculture Drones Market |
Mexico Drones Market |
United States Agriculture Drones Market |
United States Commercial Drones Market |
United States Firefighting Drones Market
Farmonaut's Role in Precision Agriculture and Data-Driven Farming
Farmonaut is an agricultural technology company focused on making precision agriculture accessible and affordable for U.S. farmers through satellite data, AI, and machine learning. The platform provides:
- Fast, real-time crop-health monitoring through satellite imagery, supporting data-driven farm decisions between or in place of drone flights
- Blockchain-based product traceability for secure, transparent supply chains
- Scalable fleet management for large farms to optimize vehicle and machinery performance
- Carbon footprinting to help agribusinesses track sustainability targets against environmental compliance requirements
- Subscription-based pricing for individuals, agribusinesses, corporations, and government organizations
- Access via Android, iOS, and web browser apps
For agribusinesses, NGOs, government agencies, and financial institutions seeking satellite-powered verification, management, and sustainability tools, Farmonaut sits alongside — not in competition with — drone-based scouting as part of a full field-monitoring stack.
Farmonaut Platform Subscriptions
Ready to pair satellite monitoring with your existing drone or scouting workflow? Explore subscription plans below:
Frequently Asked Questions (FAQ)
Q: How big is the United States drones market?
A: IMARC Group values it at $7.6 billion in 2024, projected to reach $19.3 billion by 2033 at a 10.46% CAGR (2025–2033). See the United States Commercial Drones Market report for methodology.
Q: What share of U.S. farms actually use drones or aerial imagery?
A: USDA's ARMS survey found aerial-imagery adoption of 9.8% on soybean acres (2018), 7.0% on corn acres (2016), 4.6% on sorghum acres (2019), 3.5% on winter wheat acres (2017), and 2.8% on cotton acres (2019). These figures include manned-aircraft and satellite imagery alongside drones, so drone-only adoption is likely lower. Check USDA NASS QuickStats for updated survey rounds.
Q: Is the firefighting drones market the same as the agriculture drones market?
A: No — they are tracked separately. See the United States Firefighting Drones Market report for wildland-response sizing distinct from farm-use figures.
Q: Does indoor farming use drones?
A: Generally no. Indoor and vertical farms (a $4.8 billion U.S. market in 2024, projected to $10.9 billion by 2033 per IMARC Group) use fixed sensors and cameras in enclosed spaces, not aerial drones.
Q: What FAA certification do agricultural drone operators need?
A: Agricultural spraying operations require Part 137 certification in addition to standard Part 107 commercial rules — see the FAA's guidance on dispensing chemicals from UAS for specifics.
Q: How does Farmonaut fit into the drone market?
A: Farmonaut doesn't sell drones — it provides satellite-based crop monitoring, AI advisory, traceability, and fleet management that fills the coverage gap between drone flights, at subscription pricing scalable from individual farms to large agribusinesses.
Still have questions? Try our Farmonaut app today or explore our developer resources.
Outlook for the United States Drones Market
The United States drones market's headline trajectory — $7.6 billion in 2024 toward $19.3 billion by 2033 at a 10.46% CAGR — is real, but it is a market-value forecast, not an adoption forecast. The gap between those two numbers is where the more useful story lives: USDA's own ARMS survey shows single-digit-to-low-double-digit aerial-imagery adoption across major row crops as of the 2016–2019 survey cycle, meaning most planted acreage in the country still isn't monitored from the air on a routine basis. That gap will close as the next ARMS cycle reports through USDA NASS QuickStats, as sensor costs keep falling, and as FAA rule changes around BVLOS and Remote ID lower the operating friction for commercial fleets.
Firefighting drones and indoor-farming technology are frequently searched alongside the general drones market but are structurally distinct: one is a public-safety procurement category sized separately by IMARC Group, the other barely intersects with aerial drone technology at all. Readers should treat blended "smart agriculture" or general "drone technology" figures as directional at best, and go to the crop- or segment-specific source — USDA for adoption, IMARC Group for segment dollar sizing, the FAA for certification counts — when a decision depends on the number being right.
For the acres a drone hasn't flown this week, satellite monitoring through platforms like Farmonaut's logistics and monitoring tools and its broader work in agriculture and food security fills the coverage window between flights, at a cost structure that scales from a single field to a full agribusiness portfolio.

 Red August Group
 Farm Inc
 JJM Farms
 WeMe Global
 Pixxel
 Agrotoken
 Blue BearX
 Insignito
 Croptimum
 DnCubed
 Field Capacity
 Indosistim Teknologi
 Liquify Digital
 CU Foods
 BeyondTech Global
 Rouge VC
 AgroGreen Dynamics
 AgroRisk
 Oath Inc
 Reddane Farming
