

Agriculture Warehouse Management Software: A Buyer’s Guide
Reviewed August 2026 against USDA NASS and USDA ERS.
Try it: Run your own numbers →
Agriculture warehouse management software tracks grain and produce inventory in real time, automates climate and quality control inside storage facilities, and connects that data to commodity contracts, logistics, and financial systems. The market for it exists because the physical problem is large: U.S. farms reported 876,460,000 acres in production in 2024, spread across 1,880,000 farms averaging 466 acres each, and the country’s combined on-farm and off-farm grain storage capacity stood at 25.48 billion bushels as of December 1, 2024, per USDA NASS. Software that can’t account for every bushel across that footprint isn’t warehouse management — it’s a spreadsheet with a login screen.
This guide covers the six things buyers actually search for: warehouse inventory systems, general agriculture management software, equipment management add-ons, store/commodity management modules, warehouse management systems built for grain elevators, and the logistics layer that connects storage to transport. Each section below names what the software category does, what it costs to run badly, and what a working system looks like — with a comparison table and a shrinkage/capacity calculator you can run against your own numbers.
Table of Contents
- Agriculture Warehouse Management Software
- Agriculture Store & Commodity Management Software
- Agricultural Warehouse Management Systems for Grain Elevators
- Agriculture Equipment Management Software
- Agricultural Logistics Software and Supply Chain Tools for Agronomists
- Software for Agriculture Management: Where Warehousing Fits In
- Comparison: Warehouse, Commodity, and Farm Management Platforms
- Storage Shrinkage & Capacity Calculator
- Farmonaut’s Suite for Warehousing and Commodity Tracking
- FAQ
- Try it: Run your own numbers
Agriculture Warehouse Management Software
Agriculture warehouse management software runs the daily operations of a grain bin, produce cold store, or commodity warehouse: inventory counts by lot or bin, environmental monitoring, quality grading, and the audit trail regulators and buyers ask for. The scale it has to work at in the United States is not small — Illinois alone reported 1.65 billion bushels of grain storage capacity in 2022, the largest of any state, according to USDA NASS. A facility that size cannot be managed on paper tally sheets without losses compounding silently.
Core functions
- Real-time inventory tracking — bin-level and lot-level logging, tied to intake and outbound weights rather than end-of-season estimates.
- Environmental monitoring — temperature and moisture sensors feeding alerts before spoilage starts, not after a bin is opened.
- Automated quality assessment — grading data captured at intake and matched against USDA grade standards for the commodity in storage.
- Digital documentation — warehouse receipts, certification records, and audit trails that satisfy USDA Agricultural Marketing Service reporting and buyer due diligence. USDA AMS maintains dashboards of warehouse and commodity data for exactly this kind of cross-reference.
- Supply chain data integration — feeding commodity management and logistics platforms so a bin count updates a sales contract without manual re-entry.
The reason this matters financially: the U.S. does not maintain a centralized post-harvest loss tracking system for corn, soybeans, or wheat comparable to FAO’s global database, so there is no single published national loss percentage to cite. That absence is itself the argument for facility-level software — if the national number doesn’t exist, the only loss figure that matters is the one your own bins produce, and you only get that from a system that logs inventory continuously rather than at year-end reconciliation.

Agriculture Store & Commodity Management Software
Agriculture store management software and agricultural commodity management software cover overlapping ground: the store side handles physical stock — what’s on the shelf or in the bin, reorder points, supplier records — while commodity management adds contract terms, pricing, and market-facing documentation on top of that same inventory data. A feed mill or commodity warehouse buying grain, storing it, and reselling it under contract needs both functions working from one dataset, which is precisely the gap described by the search “agribusiness software solutions feed mill commodities and warehousing” — buyers looking for one system that spans intake, storage, and sale rather than three disconnected tools.
What commodity management software actually does
- End-to-end commodity tracking — a lot number follows the grain from intake through storage, blending, and shipment.
- Contract and compliance management — digital contract generation and e-signatures replace paper tickets, with an audit trail for each transaction.
- Risk assessment and insurance integration — storage and quality data feed into crop insurance and financing decisions. Farmonaut’s Crop Loan & Insurance Verification platform is one example of satellite-backed data supporting these financial products.
- Export and documentation automation — reduces the paperwork load for cross-border sale and traceability requirements.
Because there’s no published commercial figure for average storage cost per bushel or per cubic foot broken out by region, the honest answer for a buyer sizing a commodity management deal is to pull your own facility’s cost basis — insurance, utilities, labor, shrink — divide by throughput, and use that as the number the software needs to justify against its subscription cost, rather than benchmarking against an industry average that isn’t published.




Access mobile-ready agriculture warehouse and commodity management — optimize your farm, track inventory, and unlock real-time analytics on any device with Farmonaut.
Agricultural Warehouse Management Systems for Grain Elevators
An agricultural warehouse management system, in the elevator and commercial storage sense, is the software layer that reconciles physical grain against warehouse receipts — the legal instrument a bank or buyer relies on. USDA AMS publishes warehouse and commodity data dashboards precisely because these reconciliations matter for regulatory oversight; a system that can’t produce an audit-ready receipt ledger on demand fails the purpose regardless of how good its dashboards look.
At the scale of U.S. grain infrastructure — 13.63 billion bushels of on-farm capacity and 11.85 billion bushels off-farm as of December 1, 2024 — a warehouse management system has to reconcile positions across thousands of individual bins and facilities, not one location. The National Corn Growers Association tracks how that capacity trends against annual corn production, which is the ratio that determines whether a given harvest needs emergency ground-pile storage or fits inside built capacity.
Refresh path for storage capacity figures
USDA NASS’s Off-Farm Grain Stocks survey republishes storage capacity figures four times a year — December 1, March 1, June 1, and September 1 — so the 25.48 billion bushel total above has a shelf life measured in months, not years. Pull the current release from USDA NASS’s survey page before using last year’s number in a capacity planning decision.

Agriculture Equipment Management Software
Agriculture equipment management software tracks machinery utilization, maintenance schedules, and fleet logistics — the layer that keeps a warehouse’s inbound and outbound trucks, augers, and loaders running instead of down for unplanned repair. USDA ERS’s most recent precision agriculture survey found that guidance autosteering systems had reached 70% adoption on large-scale crop farms and 52% on midsize crop farms in 2023, with yield monitors and soil mapping at 68% adoption on large-scale farms the same year. Equipment management software is the layer that turns that hardware adoption into usable maintenance and utilization data rather than raw telemetry nobody reviews.
Across all U.S. farms regardless of size, only 27% used any precision agriculture practice in 2023, per USDA ERS — meaning equipment-level software adoption still trails the large-farm figures by a wide margin, and the gap is concentrated on small and midsize operations where the hardware investment doesn’t pencil out as easily.
Fleet and machinery coordination
For warehouses running their own inbound/outbound trucking rather than contracting it out, equipment management overlaps directly with fleet management: routing, fuel tracking, and maintenance alerts tied to the same schedule that governs bin-filling and truck turnaround. Farmonaut’s fleet management module covers this ground with satellite-linked tracking rather than a standalone telematics subscription.
Agricultural Logistics Software and Supply Chain Tools for Agronomists
Agricultural logistics software connects warehouse inventory to the trucks, rail cars, and contracts that move it — the piece that determines whether a full bin actually reaches a buyer on schedule. For agronomists specifically, the supply chain visibility that matters isn’t shipment tracking alone; it’s the link between field-level yield data, storage capacity, and delivery commitments, so an agronomist advising on harvest timing can see whether the elevator has room before recommending when to combine.
- Risk mitigation — pest surveillance and climate monitoring data feed into harvest and storage timing decisions before a crop is at risk in the field. Digital records also support crop loan applications; see Farmonaut’s loan verification tool.
- Market visibility — integration with commodity platforms gives agronomists and farmers real-time demand and pricing feedback rather than a static contract price.
- End-to-end traceability — from field to storage to shelf, every unit is logged, creating a verifiable chain of custody. Farmonaut’s Traceability Platform covers this function specifically.
There is no U.S. agency currently publishing warehouse-specific technology adoption rates for inventory visibility or traceability systems the way USDA ERS tracks precision agriculture at the farm level — the adoption data that exists stops at the field gate. Until that gap is filled, the practical way to benchmark a logistics software purchase is a direct trial against your own shipment reconciliation time, not an industry-wide adoption percentage.

Digital extension and knowledge transfer
Supply chain software for agronomists also functions as a knowledge-transfer channel — advisory data moving from research and monitoring systems back to the people making storage and shipping decisions. Farmonaut’s work on digital extension services illustrates the model even though that specific deployment is outside the U.S. market: satellite and advisory data reaching decision-makers without a manual reporting layer in between.

Software for Agriculture Management: Where Warehousing Fits In
General software for agriculture management — farm planning, input tracking, financial modules — only closes the loop when it connects to warehousing and commodity data. A farm can run excellent field-level software and still lose money if storage and sale data live in a separate, disconnected system. The market reflects this split: the U.S. precision farming software market was sized at $235.3 million in 2024 per Markets and Markets, while the broader U.S. precision agriculture systems and services market — hardware and services combined — reached $7.5 billion in 2024 according to PS Market Research. Software is a small fraction of total spend; the return on it depends on how well it connects to the physical operations — storage and logistics — that account for the rest.
Sustainability tracking is one of the connective functions: Farmonaut’s environmental impact monitoring lets users track carbon footprint data tied to the same field and storage records used for compliance reporting. See how carbon footprinting supports compliance and branding for agri businesses.
Research and knowledge platforms sit upstream of this same chain — field trial and environmental sensor data that eventually informs storage and handling decisions for new varieties. See how precision crop and plantation management supports biodiversity and ecosystem health with Farmonaut.


Comparison: Warehouse, Commodity, and Farm Management Platforms
Feature sets vary sharply by whether a platform started as a farm-management tool, a commodity trading platform, or a precision-ag hardware company. The table below compares platforms across the functions covered in this article.
| Software | Warehouse Inventory | Commodity Contracts | Equipment/Fleet | Logistics Integration | Mobile Access | Starting Price ($/month) |
|---|---|---|---|---|---|---|
| Farmonaut | Yes (satellite-enabled) | Yes (traceability + contracts) | Yes (fleet management) | Yes (API + app) | Android, iOS, Web | $40 |
| Granular | Yes | Limited | Partial (field equipment logs) | Via ERP integration | Android, iOS, Web | $65 |
| AgriDigital | Yes | Yes (contracts, payments) | No | Yes | Web | $85 |
| Trimble Agriculture | Partial (sensor-based) | No | Yes (GPS fleet, irrigation) | Via API | Android, iOS, Web | $70 |
| IBM Food Trust | Partial | Yes (traceability-focused) | No | Yes (audit trail) | Web | $90 |
| CropIn | Yes | Partial | No | Yes | Android, iOS, Web | $35 |
Prices above are estimated starting tiers as published by each vendor and change without notice — confirm current pricing directly with the vendor before budgeting, since none of these figures come from the USDA sources cited elsewhere in this article.
Storage Shrinkage & Capacity Calculator
Estimate how many bushels your facility is losing to shrinkage and how much of your rated capacity is actually filled, using your own intake and outbound figures.
Run your own numbers
Assumes shrinkage is the simple difference between measured intake and measured outbound volume; it does not separate moisture loss, handling loss, or measurement error, and it does not account for grain blended or transferred between facilities. Use it as a starting estimate, not an audit figure.
Farmonaut's Suite for Warehousing and Commodity Tracking
Farmonaut's platform connects satellite field monitoring to the warehouse and commodity functions covered above, so storage decisions trace back to the same data used for crop monitoring rather than a separate system.
- Satellite Monitoring & NDVI Analysis: field-level health and moisture data that informs harvest timing and, downstream, storage load planning.
- Blockchain Traceability: production, storage, and movement records logged for an auditable chain of custody. Farmonaut's traceability platform covers this in detail.
- Fleet and Resource Management: machinery and logistics coordination through the fleet management system.
- Environmental Impact Monitoring: carbon and sustainability KPIs via the carbon footprinting solution.
- Financial Verification Tools: satellite-based data supporting crop loans and insurance verification.
Farmonaut's API allows integration with existing warehouse, ERP, or commodity management systems rather than requiring a full platform switch.
Explore the Farmonaut API for satellite weather, resource, and farm management data.
See the API Developer Docs for onboarding.
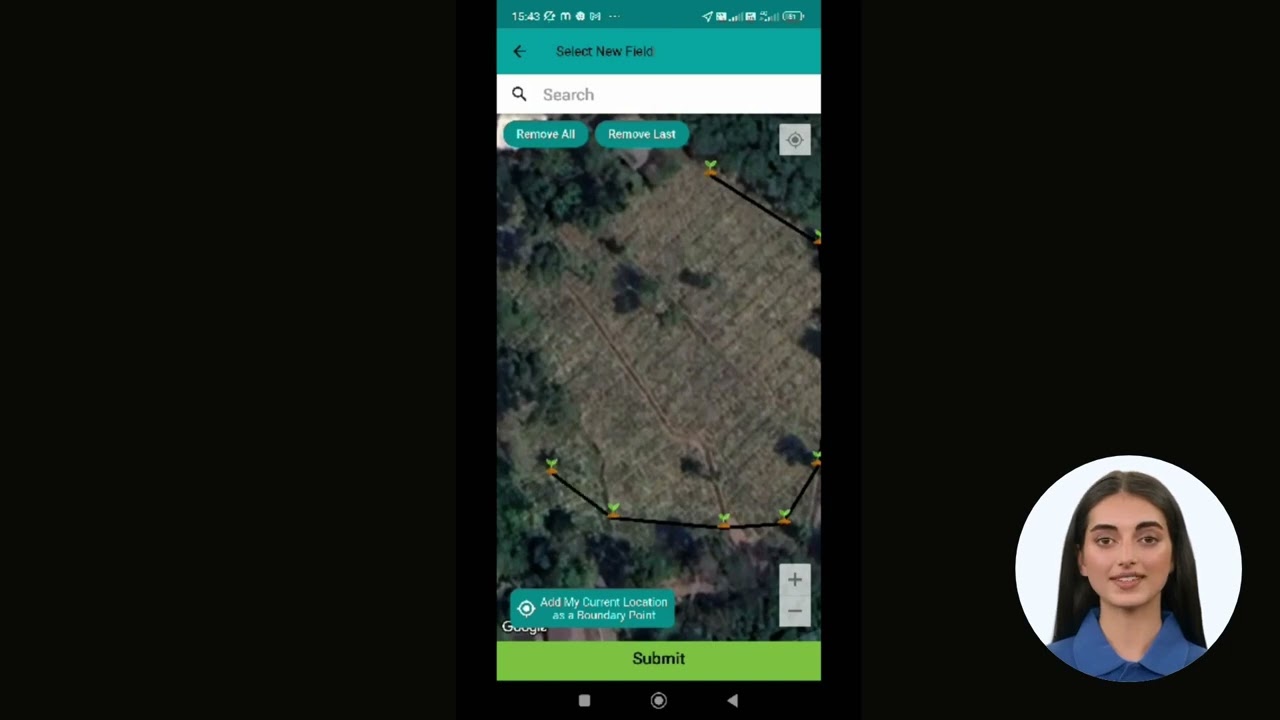
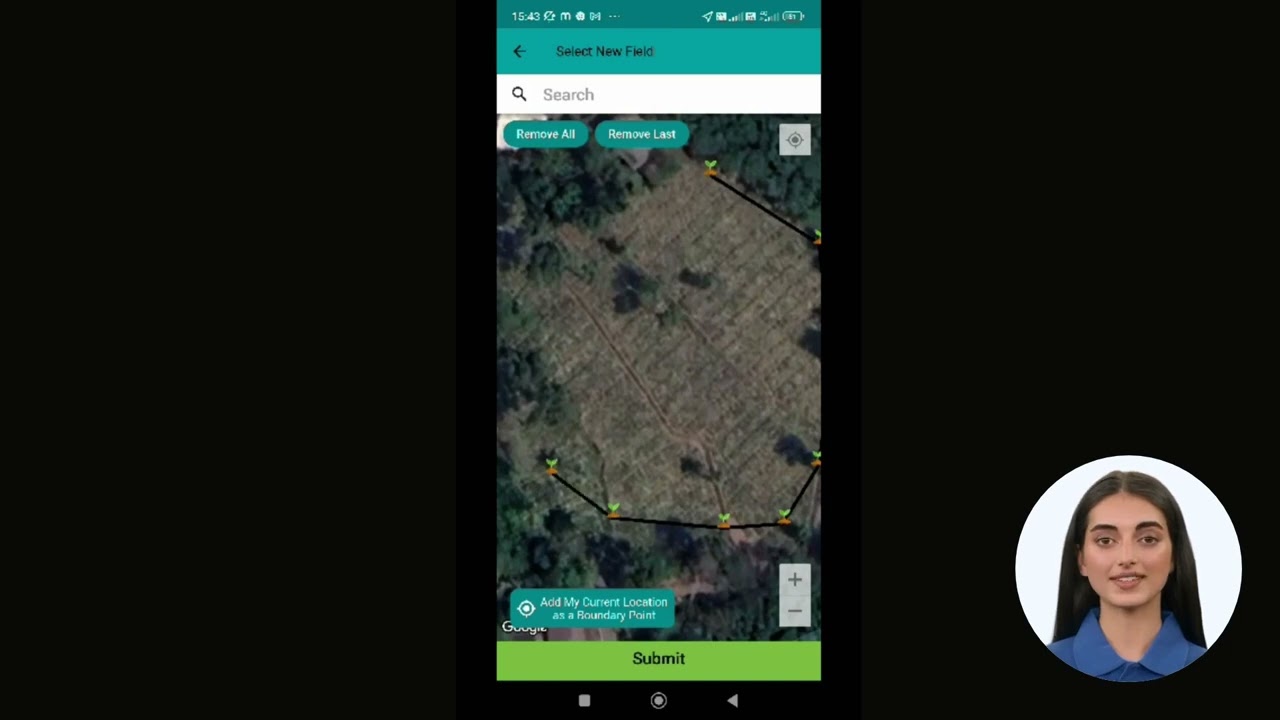
For cooperatives and agribusinesses managing storage and logistics across multiple sites, the Large Scale Farm Management App offers mapping, surveillance, and operation tracking across thousands of hectares.






FAQ
-
What does agriculture warehouse management software actually track?
Bin- or lot-level inventory, temperature and moisture data, quality grades at intake, and the documentation trail (receipts, certifications) that regulators and buyers require. USDA AMS's warehouse and commodity data dashboards are the reference point for what that documentation typically needs to reconcile against. -
How much U.S. grain storage capacity exists, and how often is that figure updated?
25.48 billion bushels combined on-farm and off-farm as of December 1, 2024, per USDA NASS. The survey republishes four times a year — December 1, March 1, June 1, and September 1 — so check the NASS survey page for the current release before relying on this figure. -
Is there a published U.S. post-harvest loss rate for grain?
No. The U.S. does not run a centralized post-harvest loss tracking system for corn, soybeans, or wheat comparable to FAO's global database. The practical substitute is your own facility's intake-versus-outbound reconciliation, which the calculator above estimates. -
What's the difference between commodity management software and a warehouse management system?
Warehouse management software runs physical storage operations — inventory, environment, quality. Commodity management adds contracts, pricing, and trade documentation on top of that inventory data. A feed mill or elevator buying and reselling grain typically needs both functioning from one dataset. -
How widely is precision agriculture adopted on U.S. farms?
27% of all U.S. farms used any precision agriculture practice in 2023. Adoption is far higher among large-scale farms specifically — 70% for autosteering guidance and 68% for yield monitors and soil mapping — per USDA ERS, which updates this survey biennially. -
How big is the U.S. precision farming software market?
$235.3 million in 2024 for software specifically, per Markets and Markets; the total precision agriculture systems and services market, including hardware, reached $7.5 billion in 2024 per PS Market Research. -
Does Farmonaut provide developer APIs for integration with existing warehouse or ERP systems?
Yes. Farmonaut's API suite and developer docs support embedding satellite and management data into existing tools. -
What does agricultural logistics software add on top of warehouse management?
It connects storage inventory to transport — trucking, rail, contracts — so a filled bin translates into a shipment on schedule, and gives agronomists visibility into whether storage capacity is available before recommending harvest timing.
Discussion
Questions, corrections or field experience? Share them below. First-time comments are reviewed before they appear, and your email is never published.
No comments yet. Be the first to add a question or your experience.

 Magrifly
 LatConnect 60
 Disease Free Life
 WebsEdge
 Blickwinkel
 Agricultural Credit Policy Council
 BayWa
BayWa MCSOD
MCSOD Marei Nursery
 eKGIS
eKGIS Mostas Tech
 Native Seeds
 Andex
Andex FCF India
 Unifrutti Gulf
 Deluxe Conseil
 WICO
WICO Chimera Innovation
