

Mining stocks · Market explainer
Why Are Mining Stocks Down Today? 7 Causes to Check
On 12 November 2026 gold bid US$3,880.20, down 2.68% (Kitco, 14:41 New York time), and GDX traded 3.27% lower. Miners usually fall more than the metal they sell. Here is how to tell which of seven causes is at work.
Key takeaways
- Gold fell 2.68% to US$3,880.20 on 12 November 2026 (Kitco) and GDX was down 3.27% at about the same time (StockAnalysis).
- Miners fall faster than metal because costs stay fixed: Newmont’s margin would shrink about 27% if gold fell about 7% from its Q3 2026 average, per a Kitco commentary.
- Hot US inflation data on 10 November lifted rate-rise bets before the Fed’s 8-9 December 2026 meeting.
- US diesel averaged US$6.127 a gallon on 9 November 2026, US$2.29 more than a year earlier (EIA).
- Lithium miners face a different problem: battery-grade lithium carbonate averaged an estimated US$9,000 a tonne in 2025, against US$63,700 in 2022 (USGS).
In this article
- Why are mining stocks down today? The short answer
- What moved mining stocks this week
- Why mining stocks fall more than the metal price
- Interest rates, the dollar and gold miners
- Fuel prices and mining costs
- Copper and lithium miners: a different story
- How to check why a mining stock is down in five steps
- Mining stock analysis: what to look at after a fall
- How earnings and deals affect mining stocks
- What licence owners and project sellers should take from this
- Frequently asked questions
Mining stocks are down on most bad days for one of three reasons: the metal price fell, the wider stock market fell, or a single company disappointed. On 12 November 2026 the first reason was in charge. Gold bid US$3,880.20 an ounce at 14:41 New York time, down US$106.80 or 2.68% on the day (Kitco), and the VanEck Gold Miners ETF (GDX) traded at US$82.42, down 3.27%, at about the same time (StockAnalysis). Miners usually move more than the metal they dig, so a 2.7% drop in gold turning into a 3% or larger drop in the shares is normal, not a sign that something broke.
This page explains the seven causes that move mining shares lower, shows how to tell which one is at work on the day you are reading, and gives a small calculator that shows why a miner’s profit falls faster than the metal price. It is written for investors and for owners of mining licences who want to read the market before they raise money or sell a project. Figures carry their date and source because they change daily.
Why are mining stocks down today? The short answer
Start with the metal. Check the price of the main metal the company sells: gold, silver, copper, lithium, uranium or another commodity. If that price fell by 1% to 3% and the miners fell by 1.5 to 3 times as much, the move is mostly about the metal. If the metal is flat but the shares fell, look at the stock market and at interest rates. If one company fell and its peers did not, read that company’s news release from the morning.
In the autumn of 2026, the main forces behind falling gold and silver miners have been rate expectations, a firmer US dollar and higher energy costs. Gold set a record of US$5,589.38 an ounce on 28 January 2026 (CBS News) and was back near US$3,900 by 12 November. A Bloomberg report carried by Mining.com on 19 March 2026 showed the pattern early: the NYSE Arca Gold Miners Index fell 6.6% in one day as oil rose, traders dropped their bets on rate cuts and the dollar gained. The same three forces were at work again in October and November.
- Metal price: the single biggest driver for producers. A fall in gold or copper cuts the expected profit of every mine at once.
- Interest rates and the dollar: gold pays no interest, so higher rate expectations make it less attractive, and a stronger dollar makes it dearer for buyers outside the US.
- Energy costs: diesel and power are among a mine’s largest running costs, so an oil spike squeezes margins even when the metal holds up.
- The stock market: small and mid-sized miners trade with the rest of the market and fall hard when investors sell anything they can sell quickly.
- Company news: a cost guidance increase, a mine accident, a delayed project or a share sale can sink one stock on a good day for the sector.
- Country and permit risk: a royalty rise, a licence dispute or an export ban can reprice every company in one country.
- Funds and flows: large ETF outflows force selling across all holdings, whatever each company’s news.
What moved mining stocks this week
The daily record shows how sharp the swings were. GDX closed at US$91.46 on 9 November after a 4.41% gain, fell 5.43% on 10 November and 1.48% on 11 November, then traded 3.27% lower on 12 November. Over the previous fortnight it closed as low as US$77.09 on 30 October, after a 5.21% drop that day (StockAnalysis daily history).
Chart
VanEck Gold Miners ETF (GDX), selected closes
US$ per share; 12 Nov is the 2:41 p.m. EST price
The 10 November fall followed the October US consumer price report. Commentary on FXStreet reported that core prices, which exclude food and energy, rose 0.3% in October against an expected 0.2%, and headline prices rose 0.4%. The same piece reported that the US dollar index rose to 102.36 and the 10-year Treasury yield to about 5%, and that futures markets priced about an 84% chance of a December rate rise. The Federal Reserve’s next policy meeting is on 8-9 December 2026, according to the Fed’s meeting calendar. Until that decision, every inflation, jobs or wage report can move gold and the miners.
The week before showed the other side. A strong October jobs report pushed gold down on 6 November, yet GDX rose 2.16% that day because the wider stock market rose. Kitco commentator Przemyslaw Radomski argued in a 9 November opinion piece that miners rising on a day gold falls only shows real strength if the stock market is also falling. That is a useful test for any reader: compare the miners with both the metal and the S&P 500 before deciding what drove the day.
Why mining stocks fall more than the metal price
The answer is operating gearing: a fixed cost base magnifies price moves. A mine’s costs do not fall when the metal falls, so each 1% lost in the price takes a bigger share out of the profit margin. All-in sustaining cost (AISC) is the industry measure that adds mining, processing, royalties, overheads and the capital needed to keep a mine running, per ounce sold.
Chart
Newmont gold margin at different gold prices
US$ per ounce; Q3 2026 actual vs Q4 cost guidance of about US$1,900
Newmont gives a clear example. In a 27 October 2026 Kitco opinion piece, Radomski reported that Newmont sold gold at an average US$4,317 an ounce in the third quarter of 2026 with AISC of US$1,454, a margin of about US$2,860. The company guided fourth-quarter AISC near US$1,900, citing sustaining capital and inflation, including oil. At US$4,000 gold, the margin would be about US$2,100, roughly 27% smaller, while the gold price would be only about 7% lower. Newmont’s shares fell 4.6% the day after it reported a record quarter, because the market priced the next quarter, not the last one.
The effect is larger for higher-cost producers and for juniors. In the same week, the VanEck Junior Gold Miners ETF (GDXJ) fell 9.6% while gold fell 4.1%, as that piece reported. The gearing also works upward: in 2025, when gold rose about 65%, Newmont, Agnico Eagle and Barrick each rose more than 115%, according to the Bloomberg report on Mining.com. Investors who bought miners for that upside should expect the same multiplier on the way down.
How to read a miner’s margin
- Find the realised price and the AISC in the latest quarterly release (both are in US$ per ounce for gold miners).
- Subtract to get the margin, then redo the sum at today’s metal price and at the next quarter’s cost guidance.
- Compare the percentage change in margin with the percentage change in price. A ratio of 2 to 4 is common for producers; for high-cost mines it can be much larger.
- Check whether by-product credits (for example copper or silver at a gold mine) are deducted in the AISC, because companies report this differently.
Calculator
How much does a miner’s margin fall when the metal price falls?
Enter a company’s cost per ounce and two metal prices.
- Change in metal price (%): -5.0
- Margin before (US$ per oz): $2,100
- Margin after (US$ per oz): $1,900
- Change in annual margin (US$): -$20,000,000
Example values only, not a benchmark or a forecast. Prices are inputs: example, use today’s price. Uses all-in sustaining cost as the cost per ounce and ignores taxes, hedging and by-product changes. All amounts in US$.
Interest rates, the dollar and gold miners
Gold earns no interest. When markets expect higher rates, government bonds pay more, and holding gold costs more in lost income. A stronger dollar adds pressure, because gold is priced in dollars and becomes dearer for buyers using other currencies. The Bloomberg report on Mining.com noted that the Bloomberg Dollar Spot Index gained 1.5% in March 2026 as the dollar acted as a safe haven, while in 2025 the same index fell about 8% and gold miners drew large inflows.
For this reason, the dates to watch are the US inflation report, the monthly jobs report and the Fed meeting. On those mornings, check the 2-year Treasury yield and the dollar index before the open. If both rise sharply, expect gold and the miners to come under pressure, often with the juniors falling hardest.
Fuel prices and mining costs
Haul trucks, drills, generators and shovels at open-pit mines run largely on diesel, so fuel is a direct cost. The US average on-highway diesel price was US$6.127 a gallon on 9 November 2026, US$2.290 higher than a year earlier (US Energy Information Administration). That weekly figure is a retail benchmark, not what a mine pays under contract, but it shows the direction of fuel costs. Remote mines that burn diesel for power, and open-pit mines with long haul roads, feel it most. Underground mines on grid power feel it less, though electricity prices often follow fuel prices.
Chart
US retail fuel prices, a year apart
US$ per gallon, weekly national average
The sectors most affected by fuel prices are therefore large open-pit operations: bulk commodities such as iron ore and coal, low-grade copper and gold pits that move a lot of rock for each tonne of metal, and mines far from a power grid. Higher oil reaches the miners twice: once through costs, and again through inflation and rate expectations, which weigh on gold. Newmont named higher oil prices among the reasons for its higher fourth-quarter cost guidance, as the Kitco piece reported.
Copper and lithium miners: a different story
Not every mining stock falls for the same reason. Copper miners track the copper price, which follows factory output, building and power-grid spending, and Chinese demand. Copper traded at US$6.42 a pound on 5 November 2026 (MetalCharts, COMEX), well above the 2025 COMEX annual average of about US$4.80 a pound reported by the USGS Mineral Commodity Summaries 2026. Copper-miner funds such as the Global X Copper Miners ETF hold producers whose shares can still fall on days when growth fears hit the wider market, even with copper high. For a look at how producers lower costs per tonne, see our guide to the top copper mining technologies, and for the largest US names see American copper mining stocks.
Chart
Battery-grade lithium carbonate price
US$ per tonne, real annual average; 2025 is an estimate
Lithium miners went through a long price slump. The USGS reports that the real annual average price of battery-grade lithium carbonate fell from US$63,700 a tonne in 2022 to US$11,800 in 2024 and an estimated US$9,000 in 2025 (USGS, 2026). Companies that planned mines at the 2022 price have had to delay projects, raise money or cut costs, which is why many lithium shares stayed weak even while gold miners rallied. Our lithium demand forecast covers the supply and price shifts in more detail.
▶ How copper is mined and why electrification needs it · 6:03
How to check why a mining stock is down in five steps
- Check the metal. Look up the spot or futures price of the company’s main metal and its change on the day. Kitco, the LME and COMEX quotes are the usual references.
- Check the sector fund. Compare the stock with GDX or GDXJ for gold, a silver miners fund for silver, or a copper miners fund for copper. If the fund fell as much, the cause is sector-wide.
- Check the market and rates. Look at the S&P 500, the 2-year Treasury yield and the dollar index. A broad sell-off or a jump in yields explains many bad days for juniors.
- Read the company’s news. Search the company’s own news page, SEDAR+ for Canadian issuers, SEC EDGAR for US issuers or the ASX announcements platform for Australian ones. Look for results, guidance, share sales, mine incidents and permit news.
- Check the country. Royalty changes, export rules, licence reviews and elections can reprice every miner in one jurisdiction on the same day.
The SEC’s Investor.gov guide to mutual funds and ETFs explains how index funds such as GDX track a basket of stocks, which is why one fund’s daily move is a fair read of the sector.
Mining stock analysis: what to look at after a fall
A falling share price does not, by itself, make a miner cheap or expensive. After a sharp fall, the useful questions are about the business, not the chart.
- Margin at today’s price: redo the margin sum with today’s metal price and next quarter’s cost guidance, as in the calculator above.
- Balance sheet: companies with net cash can wait out a weak price; companies with debt due soon may have to sell shares at a low price, which dilutes existing holders.
- Reserves and mine life: a reserve is the part of a deposit shown to be mineable at a stated price. Check the metal price the reserve was calculated at; if spot falls near that price, some ounces may no longer pay.
- Jurisdiction: mines in places with stable permits and royalties usually trade at higher values than similar mines in riskier places.
- Stage: producers earn cash today; developers and explorers depend on raising money, so they fall further when markets turn risk-averse.
For the largest producers by output, see our list of the top 20 gold mining companies; for a valuation method applied to silver names, see undervalued silver mining stocks.
How earnings and deals affect mining stocks
Earnings move mining stocks mostly through guidance. A record quarter can still be followed by a fall, as Newmont showed in October 2026, if the outlook for costs, output or capital spending is worse than the market expected. Watch for three lines in a results release: next-period production guidance, next-period AISC guidance and the capital budget.
Deals affect the buyer and the target differently. A takeover target’s shares usually jump towards the offer price. The buyer’s shares often fall on announcement day if it pays a large premium or issues many new shares to pay for the deal. A share sale (a placement or a bought deal) usually prices at a discount to the last close, so the stock tends to drop towards that price.
What licence owners and project sellers should take from this
Falling mining stocks matter beyond the stock market. When producer and junior shares fall, mining companies raise less money, and buyers of early-stage projects pay less or wait. Owners of exploration licences who plan to sell or farm out a project often do better when they can show clear targets and data rather than relying on a strong market. Satellite surveys can help here: a mapped alteration zone or a screened licence area gives a buyer something concrete to judge before drilling. Farmonaut offers satellite-based mineral exploration reports that flag targets ahead of field work; these are exploration targets, not resource estimates.
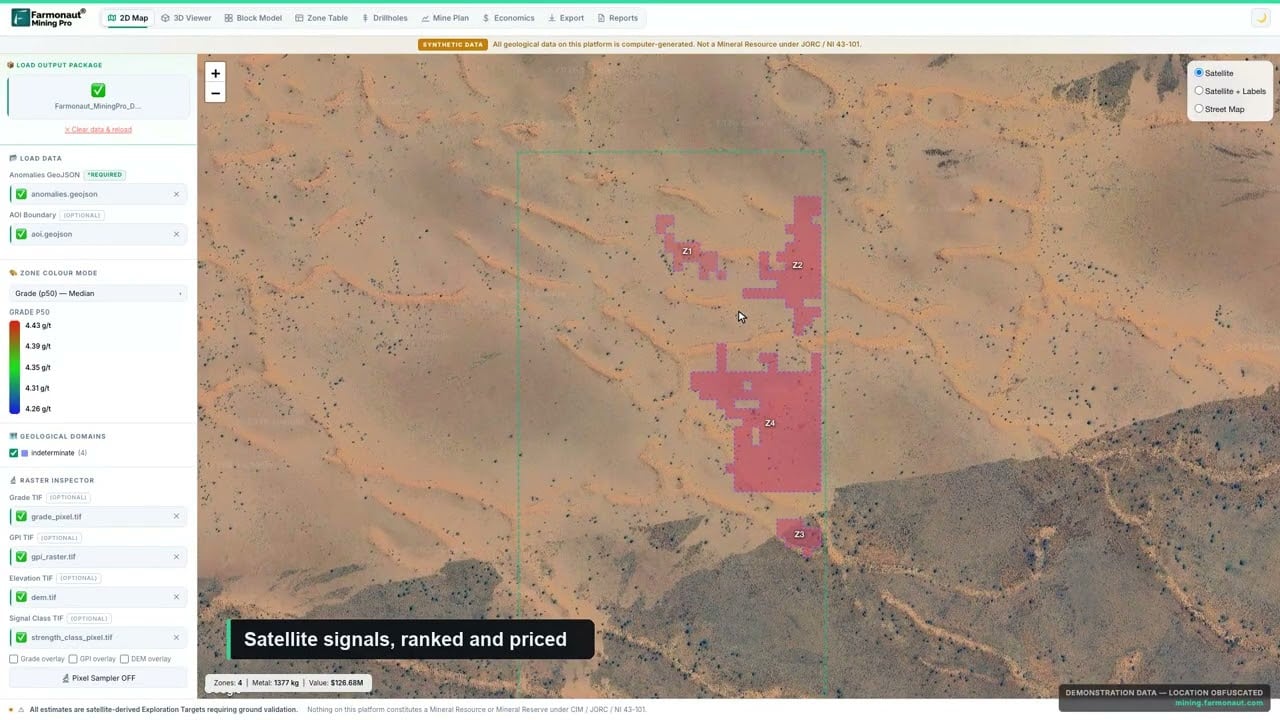
▶ What Farmonaut Mining Pro does · 4:56
Frequently asked questions
Why are mining stocks down today?
Usually because the main metal price fell, the stock market fell, or interest rate expectations rose. On 12 November 2026, gold fell 2.68% to US$3,880.20 (Kitco, 14:41 New York time) and GDX was down 3.27% at about the same time. Check the metal, the sector ETF and the 2-year Treasury yield to see which cause applies.
Why are gold mining stocks falling when gold is still high?
Share prices look ahead. Even with gold near US$3,900, the price is far below its January 2026 peak above US$5,500, and costs are rising with fuel and inflation. A shrinking margin outlook, not the level of gold, drives the shares.
Why do mining stocks fall more than gold?
Operating gearing. Costs per ounce stay roughly fixed when the price falls, so the margin falls by a larger percentage than the price. Higher-cost producers and juniors show the strongest effect.
Why are mining shares down when the stock market is up?
The metal price is usually to blame, or a rise in bond yields and the dollar that hurts gold more than other sectors. Check whether gold or copper fell on the day.
Which mining sectors are most affected by fuel prices?
Large open-pit operations that move a lot of rock per tonne of metal, such as iron ore, coal and low-grade copper and gold pits, and mines off the power grid that generate electricity with diesel.
Do interest rates affect mining stocks?
Yes, gold miners in particular. Higher rates raise the income lost by holding gold, and higher rates also raise the cost of debt for developers. The Fed’s next meeting is on 8-9 December 2026.
Why are mineral and lithium stocks down?
Lithium miners have faced a long price slump: the USGS puts the real average price of battery-grade lithium carbonate at an estimated US$9,000 a tonne in 2025, against US$63,700 in 2022. Lower prices delay projects and cut earnings.
Why do junior miners fall harder than producers?
Juniors have little or no revenue and depend on raising money. When markets turn risk-averse, investors sell the riskiest names first, and higher-cost juniors also have the thinnest margins.
How do I check if a single mining stock fell for company reasons?
Compare it with its sector ETF. If peers were flat, read the company’s latest release on its website, SEDAR+, SEC EDGAR or the ASX platform for results, guidance, share sales or operational news.
Why are mining stocks rising on some days when gold falls?
Often because the wider stock market is rising and small miners move with it. Real sector strength shows when miners hold up on a day both gold and the stock market fall.
More from Farmonaut: farmonaut.com, agro admin app, carbon footprinting, farmonaut satellite weather api developer docs, fleet management, product traceability.
This page is for information only. It is not investment advice.
Farmonaut mining
See a project area from space
Investors can add a satellite exploration view of a company's project area to their own research.
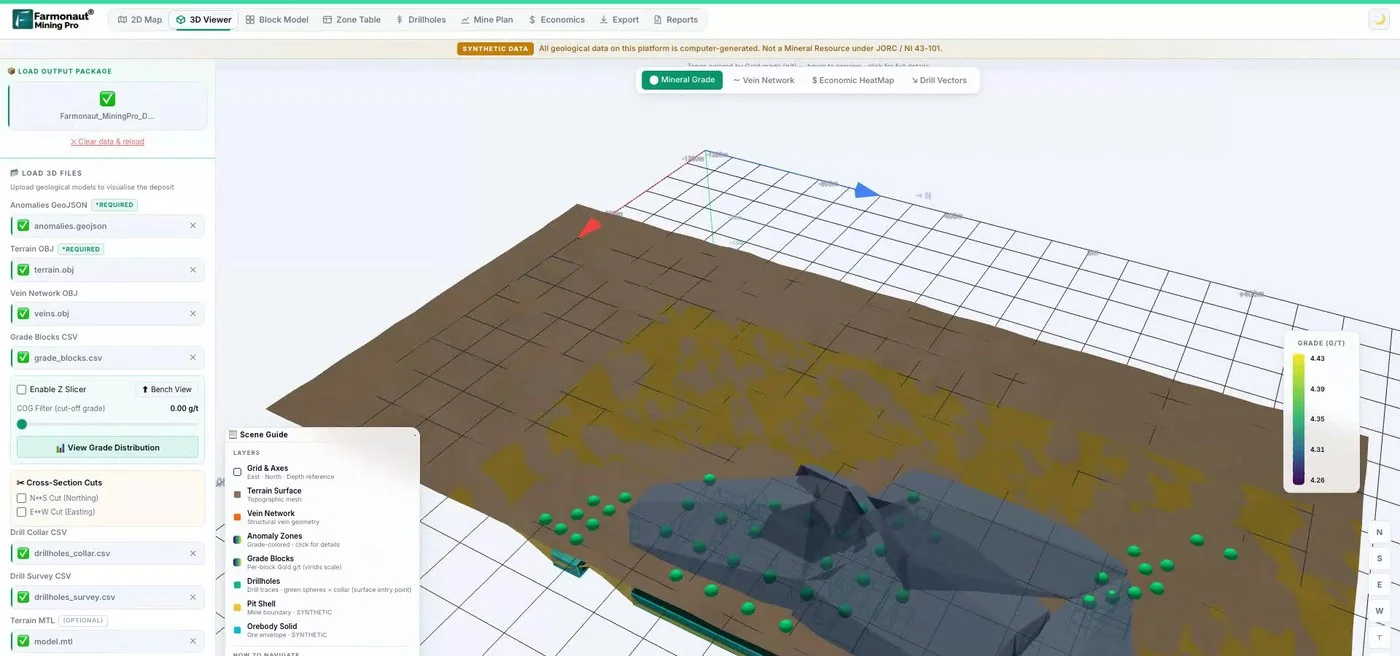
Mining Pro sample view, synthetic data
Keep reading
Sources
- Kitco, live gold price (12 November 2026): kitco.com
- StockAnalysis, GDX price history (12 November 2026): stockanalysis.com
- StockAnalysis, VanEck Gold Miners ETF overview: stockanalysis.com
- Mining.com / Bloomberg, gold mining stocks set to erase 2026 gains (19 March 2026): mining.com
- Kitco commentary, why gold miners fall even after record profits (27 October 2026): kitco.com
- Kitco commentary, why gold miners rose on gold’s down day (9 November 2026): kitco.com
- FXStreet, gold slides as the core CPI comes in hot (10 November 2026): fxstreet.com
- Federal Reserve, FOMC meeting calendar: federalreserve.gov
- US EIA, Gasoline and Diesel Fuel Update (10 November 2026): eia.gov
- MetalCharts, copper price (5 November 2026): metalcharts.org
- USGS, Mineral Commodity Summaries 2026: copper: pubs.usgs.gov
- USGS, Mineral Commodity Summaries 2026: lithium: pubs.usgs.gov
- SEC Investor.gov, mutual funds and ETFs: investor.gov
- CBS News, highest gold price in history: cbsnews.com
Discussion
Questions, corrections or field experience? Share them below. First-time comments are reviewed before they appear, and your email is never published.
No comments yet. Be the first to add a question or your experience.

 SG Gold Mining LLC
 VRV Global Pte Ltd
 Omsri International FZE
 G.I.T.T.
 Jaunita Erss Ltd
 Almosi SARL
 SRK Consulting
 Berks Gold Limited
 Mwerezi Minerals Company Limited
 Mining SARL
 SenGold Invest SAS
 Sean Mining Limited
 NTS Group (Pty) Ltd
 Mine4Africa
 Lithspo Minerals Limited
 Tintina Mining Group

 Licence holder · Nigeria · Gold + lithium
 Client · Somalia · Gold










