

Crop Monitoring Sensors: What They Cost & How They Work
Reviewed August 2026 against USDA Economic Research Service (ARMS survey data) and market-research figures from PS Market Research and HTF Market Insights.
Try it: Run your own numbers →
Crop monitoring sensors are hardware and satellite-based systems that measure plant health, soil moisture, temperature, and canopy conditions in real time, feeding that data into software that tells a grower when to irrigate, fertilize, or scout for pests. In the United States, adoption is still small in relative terms — the USDA Economic Research Service’s 2023 Agricultural Resource Management Survey (ARMS) found only 2% of US farms use sensors for real-time crop monitoring, covering about 6% of total crop area — but the technology segment is growing fast, from a $2.1 billion US precision agriculture technologies market in 2024 toward a projected $4.3 billion by 2032, according to PS Market Research. This guide covers what the different sensor types actually do, what they cost, how wireless field networks differ from greenhouse systems, and where US adoption stands today, with a worked calculator so you can size a system for your own acreage.
Table of Contents
- What Is Crop Monitoring?
- Crop Monitoring Sensors: The Main Types
- Wireless Crop Monitoring: How Field Networks Work
- Satellite Monitoring vs. Ground Sensors
- Crop Yield Monitoring Technology
- Greenhouse Crop Monitoring
- US Adoption Data: Who Is Actually Using This
- Sensor Cost Calculator
- Choosing a System for Your Operation
- Where Farmonaut Fits
- FAQ: Crop Monitoring Sensors
- Key Takeaways
- Try it: Run your own numbers
What Is Crop Monitoring?
Crop monitoring is the ongoing measurement of field or plant-level conditions — vegetation health, soil moisture, temperature, nutrient status, and pest pressure — used to decide when and how much to irrigate, fertilize, or treat. It ranges from a farmer walking rows with a soil probe to a fully automated stack of ground sensors, satellite imagery, and software that pushes alerts to a phone. The common thread is that a decision gets made on measured data instead of a calendar or a guess.
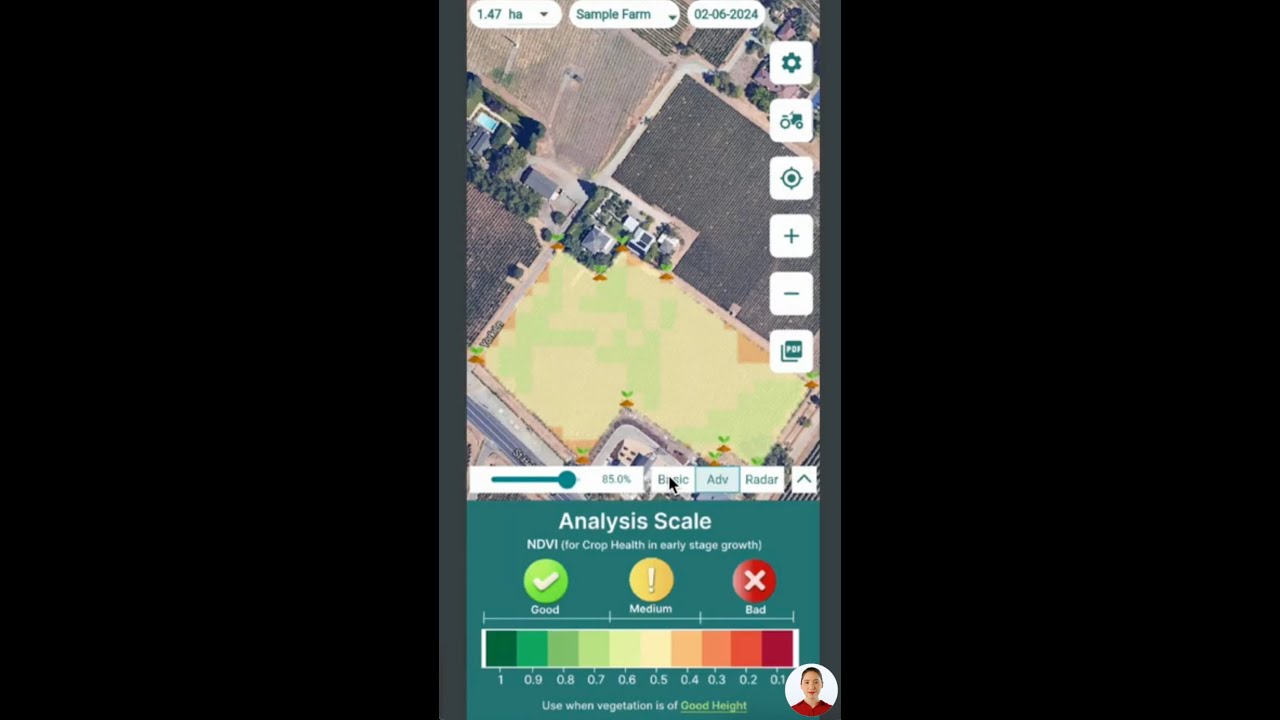
Two data sources dominate practical crop monitoring today. The first is ground-based sensors — soil moisture probes, canopy temperature sensors, weather stations, and multispectral sensor rigs mounted on equipment — that measure a specific point or a narrow strip of field. The second is remote sensing, primarily satellite imagery processed into vegetation indices like NDVI (Normalized Difference Vegetation Index) and NDWI (Normalized Difference Water Index), which cover an entire field or farm without any hardware installed on the ground. Most working systems combine both: satellite data flags where in a field something looks off, and a ground sensor or a scouting trip confirms why.

The US precision agriculture technologies market — the umbrella category that includes crop monitoring hardware and software — was valued at $2.1 billion in 2024 and is forecast to reach $4.3 billion by 2032, per PS Market Research. That is roughly a doubling over eight years, driven less by sensor novelty than by falling wireless-module costs and better integration with farm management software.
Crop Monitoring Sensors: The Main Types
“Crop monitoring sensor” covers several distinct hardware categories, and mixing them up is the most common mistake in system planning. Each measures something different and answers a different question.
- Soil moisture sensors — capacitance or tension-based probes installed at one or more depths in the root zone. They answer “does this spot need water right now,” and are the backbone of most irrigation-scheduling setups.
- Canopy temperature and infrared sensors — measure plant surface temperature as a proxy for water stress, since a water-stressed plant closes its stomata and warms up before visible wilting.
- Multispectral and NDVI sensors — either handheld/tractor-mounted units or satellite-derived, measuring reflected light in red and near-infrared bands to quantify canopy density and chlorophyll activity.
- Weather stations — temperature, humidity, rainfall, wind, and solar radiation at the field level, used to calculate evapotranspiration (ET) rates that drive irrigation timing.
- Yield monitors — mounted on the combine or harvester, measuring grain flow and moisture in real time to produce a yield map correlated to GPS position.
- Environmental sensors for controlled environments — temperature, humidity, CO2, and light sensors used specifically in greenhouses and high tunnels, covered in more detail below.
An individual temperature/humidity sensor module for structured environments (the type used in greenhouses) retails for $239–$270 as of 2025, according to equipment supplier ControlByWeb. Open-field soil moisture and weather-station hardware is priced separately by manufacturer and typically quoted per field zone rather than per module — get a current quote from your equipment dealer rather than relying on a published list price, since these change with each supplier’s catalog cycle.
Wireless Crop Monitoring: How Field Networks Work
Wireless crop monitoring replaces the wired sensor networks common in older greenhouse and research-plot installations with battery-powered nodes that transmit over LPWAN protocols (LoRa, NB-IoT, or cellular) to a base station or gateway, which then pushes data to a cloud dashboard. The appeal for open-field agriculture is straightforward: running conduit and wire across a quarter-section is expensive and impractical, while a wireless node can be moved between fields season to season.
The US wireless agricultural sensor market was valued at $1.35 billion in 2025 and is projected to reach $4.12 billion by 2034, a 13.2% compound annual growth rate over that period, according to HTF Market Insights. That growth rate is markedly faster than the broader precision-ag market’s roughly 9% implied CAGR, reflecting the fact that wireless is displacing wired installations as the default rather than just adding new coverage.
Practical considerations for a wireless deployment:
- Gateway range — LoRa-based nodes typically need line-of-sight or near line-of-sight to a gateway; rolling terrain or windbreaks can force you to add a repeater rather than relying on a single base station for the whole farm. Get the manufacturer’s range spec tested on your own terrain before committing to node count — published ranges assume flat, open ground.
- Battery life — determined by transmission interval; a node reporting hourly lasts far longer than one reporting every five minutes. No US-specific published battery-life benchmark broken out by farm topography exists in current market research; ask your vendor for field-tested (not lab-tested) battery life at your intended reporting frequency.
- Data plan or gateway cost — cellular-connected nodes carry a recurring SIM cost; LoRa nodes need a one-time gateway but no recurring connectivity fee beyond your own internet.
Farmonaut’s own large-scale farm management tools are built to sit on top of whichever wireless or satellite data source you already have, consolidating readings from multiple fields into one dashboard rather than requiring a single proprietary sensor brand.


Satellite Monitoring vs. Ground Sensors
The two approaches are complementary, not competing, but they answer different questions at different costs. The table below is built to separate what each is actually good at, since most system-design mistakes come from expecting one to do the other’s job.
| Factor | Satellite / Remote Sensing (NDVI, NDWI) | Ground-Based Wireless Sensors |
|---|---|---|
| Spatial coverage | Whole field or whole farm in one pass, no hardware installed | Point measurement at each node’s location only |
| Update frequency | Every few days, limited by satellite revisit time and cloud cover | Continuous — can report hourly or in near-real time |
| Upfront hardware cost | None; software/subscription only | Per-node cost, e.g. $239–$270 per temperature/humidity module (ControlByWeb, 2025) |
| Best for | Canopy vigor trends, whole-field stress mapping, historical comparison | Root-zone soil moisture, precise irrigation timing, frost/freeze alerts |
| Blind spots | Cloud cover delays; cannot see below-canopy or root-zone conditions | Only as representative as node placement; no view of unmonitored zones |
See Farmonaut’s own comparison of the two core vegetation indices in NDVI vs. NDWI: 5 Key Vegetation Indices for Precision Farming and the deeper breakdown of moisture-specific readings in NDWI Range Explained for the numeric bands each index typically falls into by growth stage.

Crop Yield Monitoring Technology
Yield monitoring technology sits downstream of the growing-season sensors above: it measures what was actually produced, geolocated to specific field zones, so a grower can trace a low-yield patch back to a soil, water, or pest cause captured earlier in the season by NDVI or moisture data. A combine-mounted yield monitor pairs a mass-flow sensor with GPS to build a yield map at harvest; that map is the single most useful record for deciding where next season’s variable-rate inputs should go.
Adoption of the broader precision-ag toolkit that yield monitoring belongs to is uneven by farm size. USDA ERS’s 2023 ARMS data shows guidance autosteering — a related, more mature precision technology — installed on 52% of midsize US crop farms and 70% of large-scale farms, while yield monitors and soil maps specifically are used on 68% of large-scale farms, per the same USDA ERS chart series. That gap between large and midsize operations is consistent across nearly every precision-ag category ERS tracks: scale drives adoption more than any single technology’s price.
Real-time sensor-based monitoring specifically — as distinct from the broader precision-ag category — remains rare: only 2% of US farms report using crop sensors for real-time monitoring, covering 6% of crop area nationally, per the same 2023 ARMS survey (USDA ERS). That figure is refreshed annually as each survey year’s ARMS data is processed; check the ERS Charts of Note page directly for the current release before citing it, since a new survey year typically posts within twelve months of the reference period.
Greenhouse Crop Monitoring
Greenhouse monitoring is a distinct sub-category because the environment is controlled rather than ambient: the sensors exist to drive automated climate response — venting, heating, shading, fogging — rather than just to inform a human decision days later. A greenhouse sensor stack typically includes temperature, relative humidity, CO2, soil or substrate moisture, and light (PAR) sensors feeding a climate controller.
Costs scale by installation type. An individual temperature/humidity sensor module costs $239–$270 retail as of 2025 (ControlByWeb), while a full climate-control system for one greenhouse zone — sensors, controller, and actuation tied into vents, fans, and heating — runs $15,000–$40,000 installed, per current greenhouse equipment industry figures reported by IndexBox. The spread in that per-zone range depends on greenhouse size, whether climate actuation (vents, fans) is already installed or needs to be added, and how many discrete zones the structure is split into.
A few things worth knowing before budgeting a greenhouse system:
- Zone count drives cost more than sensor count. A single large open-bay greenhouse may need only one climate zone; a range house split into propagation, vegetative, and finishing sections needs a separate sensor/controller set per zone, multiplying the $15,000–$40,000 figure accordingly.
- Wired vs. wireless inside the structure is a smaller decision than in open fields, since greenhouse spans are short enough that wired installations remain common and often more reliable given the metal-frame interference wireless signals can face inside a greenhouse structure.
- Retrofit vs. new build changes the installed-cost figure substantially, since new construction can integrate conduit and mounting points that a retrofit has to work around.
Farmonaut’s crop, plantation, and forest advisory tools extend satellite-based canopy and moisture monitoring to greenhouse-adjacent operations that also manage open-field or nursery acreage alongside protected structures, giving one dashboard view across both.

US Adoption Data: Who Is Actually Using This
It’s worth being direct about where US crop-sensor adoption actually stands, because most marketing copy on this topic implies universal uptake that the USDA’s own survey data doesn’t support. As of the 2023 ARMS survey:
- 2% of US farms report using crop sensors for real-time monitoring.
- 6% of total US crop area is managed under sensor-based monitoring systems.
- 52% of midsize crop farms use guidance autosteering (a more mature, adjacent precision technology).
- 70% of large-scale crop farms use guidance autosteering.
- 68% of large-scale farms use yield monitors and soil maps.
All five figures come from the same USDA ERS Charts of Note series and its companion page on guidance autosteering adoption. Read together, they say something specific: real-time crop sensors are still an early-adopter technology in the US, while adjacent precision tools like autosteering and yield mapping are mainstream on large operations and common on midsize ones. If you are budgeting a sensor rollout, that gap is useful context — you are not late to a saturated market, and you are not first either.
ERS republishes ARMS-derived adoption figures annually as each survey cycle’s data is processed. Bookmark the ERS Charts of Note index rather than this page’s numbers alone if you need the current-year figure for a grant application, business plan, or board presentation — a new release typically supersedes the prior one within about a year of the reference period closing.
Sensor Cost Calculator
Estimate the installed cost of a wireless field-sensor network using your own node count and per-module pricing, based on the $239–$270 module range reported by ControlByWeb for 2025.
Run your own numbers
Assumptions: uses the $239–$270 per-module retail range reported for temperature/humidity sensors by ControlByWeb (2025); excludes data plan/SIM fees for cellular-connected nodes, installation labor, software subscription costs, and repeater hardware for large or non-flat terrain. Treat the output as a starting estimate for a budget conversation with your equipment supplier, not a quote.
Choosing a System for Your Operation
There is no single right sensor stack — the right combination depends on farm size, crop type, and what decision you’re actually trying to improve. A practical way to narrow it down:
- Start with the decision, not the sensor. If your main cost driver is irrigation water or energy, prioritize soil moisture probes and an ET-calculating weather station over canopy-index hardware. If it’s input timing (fertilizer, fungicide), prioritize NDVI trend monitoring, which satellite platforms deliver without any ground hardware.
- Match coverage to field variability. A uniform, flat field needs fewer ground nodes per acre than one with mixed soil types or elevation changes, where point-sensor readings from one corner won’t represent the rest.
- Budget for the network, not just the nodes. Gateway hardware, any recurring data/SIM cost, and software subscription fees are recurring line items that the per-module sticker price doesn’t show.
- Layer satellite monitoring under everything. Because remote sensing requires no field hardware, it is the cheapest way to get whole-farm coverage and can flag where a ground sensor is actually worth installing, rather than guessing at node placement upfront.

Where Farmonaut Fits
Farmonaut’s platform is built around the satellite side of this equation — NDVI and NDWI monitoring, soil and moisture estimates, and AI-driven advisories — designed to work whether or not you already have ground sensor hardware in the field. Core capabilities:
- Satellite-based NDVI & NDWI analytics — canopy and moisture trend data without installing field hardware
- AI- and API-driven advisory systems — irrigation, nutrient, and pest/disease guidance tied to current field conditions
- Web, Android, and iOS access, plus API integration for existing farm management or ERP systems
- Blockchain-based traceability for buyers and export compliance
- Carbon footprint tracking for operations reporting on sustainability metrics
For teams that want to combine satellite monitoring with existing ground sensor networks or ERP systems, the Farmonaut API and its developer documentation cover the integration path in detail.


Download the Farmonaut app for Android or iOS for stage-specific irrigation, nutrient, and pest advisories built on satellite monitoring data.

Farmonaut’s traceability layer connects field-level monitoring data through to blockchain-based traceability records — useful for growers supplying buyers who require documented input and monitoring history.
Farmonaut also offers a carbon tracking module for operations documenting sustainability practices, described further at Farmonaut Carbon Footprinting.
FAQ: Crop Monitoring Sensors
What is crop monitoring?
Crop monitoring is the ongoing measurement of field or plant conditions — vegetation health, soil moisture, temperature, nutrient status, and pest pressure — used to trigger irrigation, fertilizer, or pest-control decisions on measured data rather than a fixed schedule. It draws on ground sensors, satellite remote sensing, or both together.
How many US farms actually use crop monitoring sensors?
2% of US farms use sensors for real-time crop monitoring, covering 6% of total US crop area, according to USDA ERS’s 2023 Agricultural Resource Management Survey. That is a smaller share than more mature precision technologies like guidance autosteering, used on 52% of midsize and 70% of large-scale crop farms in the same survey.
What does a wireless crop monitoring sensor cost?
A single temperature/humidity sensor module retails for $239–$270 as of 2025, per equipment supplier ControlByWeb. A full network cost depends on node count, gateway hardware, and any recurring data plan fees — use the calculator above to estimate a total for your own field.
How is greenhouse crop monitoring different from open-field monitoring?
Greenhouse monitoring drives automated climate response — vents, fans, heating, shading — rather than just informing a later human decision. A full per-zone greenhouse climate control system, including sensors and actuation, costs $15,000–$40,000 installed, compared to $239–$270 for a single open-field sensor module.
What is the difference between satellite crop monitoring and ground sensors?
Satellite monitoring (NDVI, NDWI) covers an entire field with no installed hardware but updates only every few days and cannot measure root-zone conditions. Ground sensors give continuous, precise point-level readings but only at each node’s specific location and require upfront hardware cost.
Can crop monitoring sensor data connect to farm management software?
Yes — most modern sensor and satellite platforms expose an API. Farmonaut’s API and developer documentation allow NDVI, NDWI, soil, and advisory data to be pulled into an existing ERP, dashboard, or farm management tool.
Key Takeaways
- Real-time sensor-based crop monitoring is still an early-stage technology in the US — 2% of farms, 6% of crop area, per USDA ERS’s 2023 ARMS survey — while adjacent tools like autosteering and yield mapping are mainstream on large operations.
- Ground sensors and satellite monitoring solve different problems: point-level, continuous data versus whole-field, periodic coverage. Most working systems use both.
- Individual sensor modules run $239–$270; full greenhouse per-zone climate systems run $15,000–$40,000 installed. Get a current quote from your supplier before budgeting, since these are 2025 figures and pricing shifts with each supplier’s catalog cycle.
- The US wireless agricultural sensor market ($1.35B in 2025, projected $4.12B by 2034) is growing faster than the broader precision-ag market, reflecting wireless displacing wired installations as the default.
- Start system design from the decision you need to improve — irrigation timing, input timing, or harvest planning — not from whichever sensor is being marketed hardest.
- Leverage Farmonaut‘s satellite, app, and API tools to add whole-field monitoring coverage whether or not you already run ground sensor hardware.

Useful Resources:
- Farmonaut Official Website: Satellite-driven advisories, NDVI/NDWI analytics, advisory tools for agriculture
- Farmonaut Carbon Footprinting: Measure and reduce the environmental impact of your operation
- Farmonaut Product Traceability: Blockchain traceability for crops and supply chains
- Farmonaut Satellite/Weather API | Developer Docs: Integrate real-time NDVI, NDWI, and advisory data into your own system
- Large-Scale Farm Management: Manage multiple fields, access NDVI/NDWI data, and plan logistics in one dashboard

 LatConnect 60
 Disease Free Life
 WebsEdge
 Blickwinkel
 Agricultural Credit Policy Council
 BayWa
BayWa MCSOD
MCSOD Marei Nursery
 eKGIS
eKGIS Mostas Tech
 Native Seeds
 Andex
Andex FCF India
 Unifrutti Gulf
 Deluxe Conseil
 WICO
WICO Chimera Innovation
