

Fruit IPM · Evidence guide
Fruit IPM: What Scouting-Based Pest Control Changes in Sprays, Costs and Natural Enemies
IPM means scouting first and spraying only when counts pass a threshold. In selected US studies, an Ohio scouting project cut sprays by 36% on average and an Iowa orchard used two fewer insecticide sprays; a Washington trial found no cut. Savings depend on the pest, crop and region.
Key takeaways
- IPM here means scouting and spraying only above a set threshold. The EPA lists four steps: set thresholds, monitor and identify, prevent, then control.
- An Iowa apple trial (HortTechnology, 1994) used on average two fewer insecticide and three fewer fungicide sprays, with no significant difference in yield, scab or codling moth injury.
- Ohio orchards cut sprays by 36% on average in a scouting project. Northeast trap trees used at least 43% less insecticide (by amount) with similar plum curculio injury.
- Highly toxic sprays can kill predatory mites and make red mite harder to control (Purdue, 2017). Selective products protect them.
- Savings are not automatic. A Washington trial found similar spray counts and costs when growers switched products, and scouting adds its own cost.
In this article
- Introduction: Changing Climate, Expanding Trade & the Need for Effective Pest Control
- Understanding Integrated Pest Management (IPM) in Fruit Farming
- IPM Evolution: Precision Agriculture, Data Analytics, and Technological Advancements
- Key Components of IPM Programs & Their Role in Sustainable Fruit Pest Management
- Economic & Environmental Benefits of Fruit IPM
- How Integrated Pest Management (IPM) Compares with Calendar Spraying in Fruit Farming
- Diverse IPM Methods for Sustainable Fruit Pest Control
- Challenges Facing IPM Adoption and the Future of Fruit Pest Management
- How Farmonaut Helps Fruit IPM with Satellite & AI Technology
- FAQs: Fruit IPM, Pest Control & Farmonaut Insights
- Conclusion: Toward Sustainable, Resilient Fruit Farming
What integrated pest management changes in fruit crops: sprays, costs, fruit quality and natural enemies
Introduction: Changing Climate, Expanding Trade & the Need for Effective Pest Control
In fruit farming, the impact of a specific type of pest control is the topic of this article. That type is Integrated Pest Management (IPM): scout first, and spray only when counts pass a set threshold. Controlling pests effectively matters in every season. Pest pressure changes from year to year and from place to place, and it threatens fruit yield, quality and farm income.
Integrated Pest Management (IPM) is an approach to fruit pest control. It rests on monitoring and action thresholds. The aim is to protect the crop at a reasonable cost while limiting harm to natural enemies and the environment.
IPM’s multifaceted strategy minimises reliance on chemical pesticides, and choosing selective products can protect predatory mites and other natural enemies.
Understanding Integrated Pest Management (IPM) in Fruit Farming
To appreciate the impact of a specific type of pest control in fruit production, it’s vital to understand what sets IPM apart from conventional pest control.
Chart
How US fruit growers monitor and decide
Percent of planted acres, 21 fruit crops, 12 states, 2023 crop year (selected practices)
- Integrated Pest Management (IPM) is a multifaceted, integrated strategy that combines biological, cultural, physical, and chemical tools to manage pest populations below economically damaging levels.
- Focuses on monitoring, accurate pest identification, and threshold-based interventions, aiming to reduce reliance on chemical pesticides and limit harm to the environment.
-
Components of IPM programs:
- Monitoring (using field scouting, traps, remote sensing, and automated devices)
- Accurate pest identification (biological, physical, and digital methods)
- Setting action thresholds before interventions are triggered
- Deploying a range of ecologically sound control measures, prioritizing non-chemical options
In some of the trials cited below, injury from the main target pests stayed similar while growers used fewer sprays or less insecticide. Results depend on the pest, crop and region.
Fruit farmers can reduce input costs if scouting shows that fewer sprays are needed. Try biological and cultural practices before chemical options, and follow the product label and local rules.
What “a specific type of pest control” means here. This article compares two ways of timing sprays in fruit crops. Calendar spraying applies products on fixed dates. IPM scouts first and sprays only when counts pass a threshold. The US Environmental Protection Agency lists four steps: set action thresholds, monitor and identify pests, prevent problems, and control, starting with the lowest-risk option. Scouting is already common on surveyed US fruit acres. Growers in 12 states reported scouting for insects and mites on 98% of the planted acres of the 21 fruit crops surveyed (USDA NASS, 2023 crop year). On 58% of acres, growers compared their scouting data with published guidance to help decide.

▶ A general talk on smart agriculture. The section from 1:00 covers the shift from chemical-only control to IPM; it is not specific to fruit. · 14:45
IPM Evolution: Precision Agriculture, Data Analytics, and Technological Advancements
The practice of IPM has evolved significantly in the era of digital agriculture. Fruit growers can use several technologies for precision pest management, which amplifies the overall impact of a specific type of pest control approach.
Chart
Codling moth: when to spray after biofix
Degree-days (50°F lower, 88°F upper limit) after the biofix of each generation, apples (California guidelines)
- 📡 Remote Sensing: Multispectral satellite imagery and drones can show crop stress and canopy change, so scouts know which blocks to check first. They do not name the pest. Traps and scouting do.
- 📊 AI and Analytics: Degree-day models use temperature records to predict when a pest reaches the stage that needs action. Check that a model has been tested for your crop and region.
- 🛠️ IoT Devices: Some networked traps and automated monitors can report pest counts. Check how accurate a device is for your pest before relying on it.
- 🔬 Biotechnology: Biopesticides and beneficial insect releases are used where they fit the pest and the crop.
These innovations collectively enable fruit farmers to apply control measures in a timely, targeted, and effective manner, which can help protect yield and fruit quality while supporting sustainable agricultural health.
Investor Note:
Using satellite-based crop monitoring with carbon footprinting tools can help with farm planning and reporting. Analytics can help stakeholders review IPM interventions, monitor environmental impact, and check regulatory requirements, which differ by country.
How timing works for one pest. For codling moth in apples, the UC IPM guidelines for California set a biofix. This is the first date moths are caught in traps on three checks in a row, once sunset temperatures have reached 62°F. Growers then add up degree-days from that date, using a lower limit of 50°F and an upper limit of 88°F. The first spray is timed at 250 degree-days after biofix, or at 160 when trap catches are high. For later generations, a new biofix is set when trap catches rise again, and sprays are timed at 200 to 250 degree-days. In mating-disruption orchards, fruit sampling starts late in each generation, and damage above 0.5% calls for supplemental sprays in the next generation (UC IPM, text updated 2009, treatment table 2015). Thresholds differ by pest and region, so check your local guide and follow the product label and local rules.
Key Components of IPM Programs & Their Role in Sustainable Fruit Pest Management
- ✔ Monitoring & Early Detection: IPM emphasizes ongoing monitoring using manual scouting, remote sensing, and automated devices for early detection of pest activity and crop stress.
- ✔ Threshold-Based Interventions: Action is only taken when pest populations reach levels that may cause economic damage—helping reduce unnecessary pesticide usage.
- ✔ Biological Controls: Beneficial insects, natural predators, and biopesticides are released or conserved, protecting ecological balance while suppressing pest infestations.
- ✔ Cultural & Physical Controls: Orchard sanitation, resistant varieties and physical barriers such as netting limit pest populations without sprays.
- ✔ Selective Chemical Use: When needed, selective products are chosen to limit harm to natural enemies, and modes of action are rotated to slow resistance.
Infographic
A monitoring-based spray decision in 5 steps
- 1Trap and scoutSet traps and walk the blocks on a regular schedule. Count the pest and its natural enemies.
- 2Start the clockMark the biofix, such as the first steady trap catch, and add up degree-days from that date.
- 3Compare with the thresholdUse your regional guide. For example, Purdue gives 2.5 mites per leaf before mid-June in Indiana apples.
- 4Choose a selective optionPick the product that does least harm to natural enemies. Follow the label and local rules.
- 5Record and reviewWrite down counts, sprays and fruit damage. Check the results at harvest and adjust next season.
Overreliance on broad-spectrum pesticides can lead to pest resistance and kill natural enemies such as predatory mites. IPM uses several tools and sprays selectively.
Economic & Environmental Benefits of Fruit IPM
Sustainability: Spray Use, Yield and Fruit Quality
- 🌱 Reducing pesticide usage in some fruit crops: Ohio orchards that scouted instead of following a spray calendar cut sprays by 36% on average (SARE project, 1996 to 1998)
- 🧑🌾 Lower input costs are possible, but scouting has its own cost. In an Iowa budget, a reduced-spray program cost less than a protectant program at 5 to 40 acres (HortTechnology, 1994). Return per acre was somewhat lower for the IPM strategies.
- 🍏 Similar yield and pest injury with fewer sprays in an Iowa orchard trial (HortTechnology, 1994)
- 🌊 Less pesticide that can reach soil and water when fewer sprays are applied
- 🦋 Selective products can spare natural enemies such as predatory mites
- ♻️ Fewer sprayer passes: in the Iowa trial, IPM programs used on average two fewer insecticide sprays and three fewer fungicide sprays than the protectant program
- 🔄 Rotating modes of action is the standard way to slow resistance, in any program. Scouting does not remove the need to rotate
Chart
Cuts reported when sprays follow monitoring
Percent less than a calendar or whole-block program (selected studies; Ohio: number of sprays, Northeast: amount of insecticide in 2005)
Key IPM Benefits for Fruit Farming:
- Spraying only when counts pass a threshold
- Fewer sprays can mean less pesticide applied, but residue limits set by your buyer still apply
- Sparing natural enemies such as predatory mites when selective products are used
- Reducing costs where scouting saves more than it costs
- Keeping yield and pest injury at the level of calendar spraying, as in the Iowa trial cited here
Delivering Tangible Benefits to Farmers & the Environment
- ✔ Farmers embracing IPM must count the cost of scouting as well as the spray savings. The calculator below shows the trade-off.
- ✔ Choosing selective products can spare natural enemies such as parasitic wasps and predatory mites.
- ✔ IPM programs can protect predatory mites, which help keep European red mite in check, when growers choose products that spare them.
- ✔ Produce with fewer pesticide residues can sometimes sell at better prices, FAO notes. Whether you get a premium depends on your buyer.
What the trials show. A three-year trial in one Iowa apple orchard timed codling moth sprays from pheromone-trap catches and degree-day models. The IPM treatments used on average three fewer fungicide sprays and two fewer insecticide sprays than the protectant program. Yield, apple scab and codling moth injury did not differ significantly (HortTechnology, 1994). In 2004 and 2005, trap trees guided plum curculio sprays in commercial apple orchards in seven northeastern states. Plum curculio injury did not differ significantly from conventional plots, and the amount of insecticide used was at least 43% lower (Journal of Economic Entomology, 2011). Injury from another pest, the tarnished plant bug, was higher in trap-tree plots in 2004. That trial reported no yield figures.
Not every trial finds fewer sprays. In paired Washington orchards (2001 to 2003), a program that replaced organophosphate and carbamate insecticides with more selective ones had similar spray counts, costs and codling moth damage to the conventional one. Both programs used mating disruption (Entomological Society of America meeting abstract, 2005). Using more selective products is not the same as spraying less.
Scouting also costs money. In the Iowa budget, one scab strategy cost more than the protectant program below 20 acres. The reduced-spray strategy cost less at 5 to 40 acres. Return per acre (revenue minus control cost) was somewhat lower for both IPM strategies than for the protectant program. Enter your own spray counts and costs in the calculator below.
Try the numbers for your own farm below.
Calculator
What could monitoring-based spraying save my orchard?
Enter your own numbers. Use one area unit (hectares or acres) for the area and for both costs.
- Calendar program, cost per area: $500
- Monitoring-based program, cost per area: $445
- Saving per area per year: $55
- Share of calendar sprays avoided: 20.0%
- Sprays to avoid just to cover scouting and loss: 0.9 sprays
Example values only, not a benchmark. This is an illustration, not a forecast or a guarantee of savings. Nothing here is a fixed constant: sprays avoided, costs and loss are all your inputs, and the $ sign is only a label (use your own currency). Saving per area = sprays avoided x cost per spray, minus scouting cost, minus extra crop loss. Sprays avoided cannot exceed your calendar sprays. For reference, an Ohio scouting project reported 36% fewer sprays on average (SARE, 1996 to 1998), and an Iowa trial two fewer insecticide sprays (HortTechnology, 1994). Results depend on the pest, crop and region. Follow the product label and local rules.
How Integrated Pest Management (IPM) Compares with Calendar Spraying in Fruit Farming
| Aspect | Conventional Pest Control (calendar sprays) |
IPM (scouting and thresholds) |
Environmental / Sustainability Impact |
|---|---|---|---|
| Spray decisions | Dates set in advance | Set by scouting and thresholds | Fewer sprays in several studies; the size of the cut depends on the pest, crop and farm |
| Yield and fruit injury | Reference level | Iowa: yield, scab and codling moth injury not significantly different. Northeast trap trees: plum curculio injury not significantly different | Fewer sprays or less insecticide in those trials. Tarnished plant bug injury was higher in the trap-tree plots in 2004 (Piñero et al., 2011) |
| Resistance risk | Rises if one product class is repeated | The same rule applies: rotate modes of action | Rotating modes of action slows resistance in any program. Scouting does not remove the need to rotate; 70% of US fruit acres surveyed did it (USDA NASS, 2023) |
| Cost | Product, machine and labour for every spray | Same items for fewer sprays, plus scouting | Net cost depends on farm size and scouting cost. Use the calculator above. |
| Natural enemies | Broad-spectrum sprays can kill predatory mites | Selective products and fewer sprays spare them | Predatory mites can keep red mite in check when they are conserved (Purdue Extension, 2017) |
| Spray timing | Fixed dates can miss the pest stage | Trap catches and degree-days set the date | Codling moth sprays are timed from trap catches and degree-days (UC IPM) |
Chart
Share of pesticide applied on Austrian apple fields
Percent of total pesticide weight, 2,549 commercial fields, 2010 to 2016 (three classes shown)
The saving is the cost of the sprays you avoid, minus the cost of scouting. It can be negative if scouting costs more than the sprays you avoid. Check your own numbers in the calculator above.
Where the sprays go. A study of 2,549 commercial apple fields in Austria (2010 to 2016) recorded 29.5 pesticide applications per season on average. By weight, fungicides made up 71% of the pesticide applied and insecticides 15% (Science of the Total Environment, 2023). Insect monitoring changes only part of a spray program. Disease sprays need their own decision rules.
The table above compares how spray decisions are made. It carries no cost or yield figures, because those depend on the crop, the pest and the farm.
Diverse IPM Methods for Sustainable Fruit Pest Control
The IPM Toolbox in Action
- Biological Controls: Beneficial insect releases (like parasitoids or predators), conservation of natural enemies already in the orchard, and use of biopesticides target pests while protecting ecological balance.
- Cultural Controls: Orchard sanitation and pest-resistant varieties limit pest spread.
- Physical Controls: Physical barriers such as netting and mechanical removal limit pest damage. Pheromone traps are used to monitor pests and time sprays, not to control them.
- Chemical Controls (as a last resort): IPM uses targeted, lower-risk pesticides, rotated to avoid resistance, and only when pest thresholds are crossed. Always follow the product label and local rules.
Chart
European red mite: treatment threshold by date
Average mites per leaf (moving stages) that justify a spray, apples in Indiana
Example: IPM Tactics for Key Fruit Pests
- 🍊 Fruit Flies (in Citrus):Sterile insect technique (SIT), traps with attractant lures, and orchard sanitation. SIT works as part of an area-wide program, not on one farm alone.
- 🍑 Leaf Miners: Regular monitoring, pheromone traps, and natural parasitoids.
- 🍓 Spider Mites: Predatory mites, insecticides that spare them, and sprays only when mites per leaf pass a threshold.
- 🍇 Mealybugs:Ant control, selective products when needed, and releases of the mealybug destroyer beetle (Cryptolaemus), an option in citrus.
Spray records from an IPM program can feed traceability. Learn how blockchain-based traceability enhances fruit supply chain transparency at Farmonaut Product Traceability.
Protecting natural enemies. Purdue Extension advises that conserving natural enemies is the key to managing European red mite on apples. If highly toxic insecticides kill most of the predator mites, red mite can be hard to control and may need several miticide sprays (Purdue Extension, 2017). Purdue lists 12 insecticides and miticides as highly toxic to the main predatory mite there. UC IPM makes a similar point for citrus: broad-spectrum products harm many natural enemies, and parasitic wasps and predatory mites are very susceptible to pyrethroids (UC IPM, text updated 2022).
Area-wide programs. Some fruit pests are managed across a district, not farm by farm. In Croatia’s Neretva Valley, a sterile insect pilot against Mediterranean fruit fly was reported to cut larvae per kilogram of mandarins by 97.8%, and infestation in export shipments was reported to fall from 4.1% in 2011 to 0.2% in 2013 (IAEA, 2015). Always follow the product label and local rules when you use any pesticide.
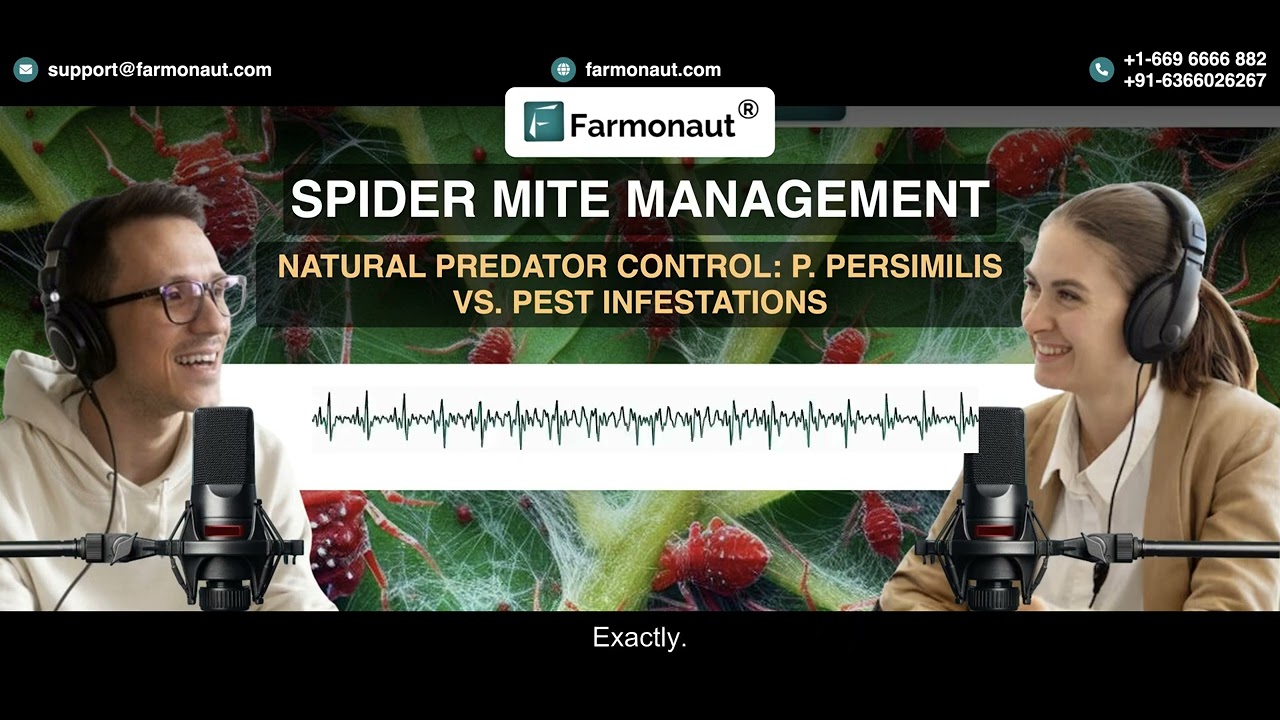
▶ Spider mite control with released predatory mites, shown for gardens. Orchard advice (Purdue) is to conserve the predatory mites already there. · 13:25
Challenges Facing IPM Adoption and the Future of Fruit Pest Management
Despite the benefits of IPM, the adoption of integrated programs faces challenges:
- ⚠ Farmer education and training are needed because scouting takes skill. Growers must learn to identify pests and natural enemies and to count them correctly.
- ⚠ Upfront investment in monitoring tools, automated tracking devices, and data analytics infrastructure can be significant without external support.
- ⚠ Coordination between stakeholders (producers, advisors, buyers, and policy makers) can help align threshold levels and market requirements.
- ⚠ Thresholds and degree-day models are set for a region, such as California codling moth or Indiana red mite, so check that yours fits your area.
As we advance, artificial intelligence and machine learning may help with precision monitoring, rapid pest identification, and real-time advisory in the future. Ask for field-test results for your crop before relying on them. Whatever tools you use, follow the product label and local rules.
Fruit farmers can use satellite-driven monitoring, insights and resource management tools, with plans for different farm types. Our Large Scale Farm Management Platform helps track crop health by block, so pest checks can be planned.
How Farmonaut Helps Fruit IPM with Satellite & AI Technology
As a satellite technology company, we at Farmonaut have designed a suite of tools for fruit pest management that use:
- 🌎 Satellite-Based Monitoring: Satellite maps of crop stress and canopy change that show scouts which blocks to check first. Satellite images do not identify the pest. Traps and scouting do.
- 🤖 AI Advisory & Data Analytics: The Farmonaut Satellite + AI Farm Monitoring System gives AI advice from satellite and weather data. A pest decision still needs field scouting and the product label.
- 🔗 Blockchain-Based Traceability: Records that support supply chain transparency and food safety checks in fruit value chains.
Read more - 📲 Mobile & Web Access: Farmonaut’s Android, iOS, and web apps give growers monitoring and advisory on a phone or in a browser.
Try Farmonaut Web App - 📈 Environmental Monitoring:
Farmonaut offers carbon footprinting and soil health tools.
Learn more - 🔄 API & Integration: Developers and agribusinesses can integrate Farmonaut’s insights using our API platform and explore API Docs for fruit farm management.
Farmonaut is sold as a subscription, with plans for individual farmers, agribusinesses and government bodies.
Farmonaut Subscription Plans
Farmonaut offers subscription plans for individual farmers, agribusinesses, and government bodies with satellite monitoring, AI advisory, and blockchain traceability, for IPM and more effective pest management in fruit farming:
For a closer look at a related question, see our guide: GM Crops: Pros, Cons & Environmental Impact Explained.
If this topic matters to you, read Ladybug Pest Control & Bug Control Spray: Eco Solutions next.
FAQs: Fruit IPM, Pest Control & Farmonaut Insights
- What is the main impact of Integrated Pest Management on fruit farming?
In the studies cited in this article, monitoring-based programs used fewer sprays than calendar programs (36% fewer on average in Ohio orchards). In an Iowa trial, yield and fruit injury were similar to calendar spraying. In a Northeast trial, plum curculio injury was similar. They can also protect predatory mites when growers choose selective products. Results depend on the pest, the crop and the region. - How does IPM differ from conventional pest control?
IPM emphasizes monitoring, biological controls, and targeted interventions, prioritizing environmental health and reducing reliance on chemical solutions. Calendar spraying applies products on fixed dates whether or not the pest is present. Repeating one product class can speed up resistance, and broad-spectrum products can kill natural enemies such as predatory mites. - Can smallholder fruit farmers implement IPM?
Yes. Scouting, trap counts and spray records can be done on a small farm, and local extension services often offer training. Use the calculator above to check whether scouting pays on your area. - Do IPM programs always avoid pesticides?
No. IPM interventions may use chemical controls, but only when pest populations cross economic thresholds. The emphasis is on targeted, lower-risk products used as the label directs. - Is IPM compatible with organic fruit farming?
Often. Traps, beneficial insects and orchard sanitation are used in both. Organic standards limit which products you may spray, so check with your certifier. - How can Farmonaut help with IPM adoption?
Farmonaut provides satellite images, AI-based advisory, blockchain traceability and environmental tracking. Satellite maps can show which blocks to scout first. Pest identification and spray decisions still rest on field scouting and the product label.
Conclusion: Toward Sustainable, Resilient Fruit Farming
Overall, the impact of a specific type of pest control, namely Integrated Pest Management, is a way of managing pests that relies on monitoring, thresholds and fewer unneeded sprays. For fruit growers managing pests in orchards, IPM is a multi-tool strategy that can help protect yield and fruit quality while limiting spray use.
Control method and harvest quality are linked, as explored in how pest control affects fruit quality.
Fruit IPM programs can use new tools, such as satellite monitoring, AI, and real-time advisory tools. Whether they pay off depends on the pest, the crop and the region. Along with policy incentives, traceability solutions, and consumer demand for safe, sustainable produce, they may help keep fruit farming productive and ecologically sound.
For fruit farmers, agribusinesses and advisers: IPM starts with scouting and counting. It is a practical way to cut unneeded sprays, and the savings depend on your pest, crop and region. Follow the product label and local rules.
- ✔ IPM reduces sprays in several studies, by an amount that depends on the pest, crop and region
- 📊 Yields held at a similar level in the Iowa trial cited above
- 🦋 Natural enemies: selective products and fewer sprays help keep predatory mites
- 💡 Satellite maps from Farmonaut can show which blocks to scout first
- 🌱 Each market sets its own residue limits, so check your buyer’s rules before you spray
Farmonaut crop monitoring
See your orchard blocks from space
The Farmonaut Satellite + AI Farm Monitoring System shows crop stress by block, so you can decide where to scout first. It does not name pests; traps and scouting do.




Keep reading
Sources
- US EPA, Integrated Pest Management (IPM) Principles: epa.gov
- FAO, Integrated Pest Management (IPM): fao.org
- USDA NASS, 2023 Agricultural Chemical Use Survey: Fruit Crops highlights (July 2024): nass.usda.gov
- UC IPM, Pest Management Guidelines: Apple, Codling moth (UC ANR Publication 3432): ipm.ucanr.edu
- Purdue Extension, E-258 European Red Mite Management (February 2017): extension.entm.purdue.edu
- SARE, Alternative Management Strategies for European Red Mite in North Central Ohio Apple Orchards (FNC96-141): projects.sare.org
- Piñero et al., Effectiveness of odor-baited trap trees for plum curculio monitoring in the Northeast, J. Econ. Entomol. (2011): blogs.cornell.edu
- Comparing IPM and protectant strategies for apple scab and codling moth in an Iowa orchard, HortTechnology (1994): doi.org
- Zaller et al., Potential to reduce pesticides in intensive apple production, Sci. Total Environ. (2023): pubmed.ncbi.nlm.nih.gov
- Brunner et al., Transitioning to apple pest management in Washington without organophosphates, ESA meeting abstract (2005): esa.confex.com
- IAEA, Supporting fruit fly pest prevention in the Balkans and the Eastern Mediterranean (September 2015): iaea.org
- UC IPM, Pest Management Guidelines: Citrus, selectivity of insecticides and natural enemies (UC ANR Publication 3441): ipm.ucanr.edu
- UC IPM, Pest Notes: Citrus Leafminer (2010): ipm.ucanr.edu
Discussion
Questions, corrections or field experience? Share them below. First-time comments are reviewed before they appear, and your email is never published.
No comments yet. Be the first to add a question or your experience.

 Lunar Edge IT
 FieldZero
 Indico Company
 Kubota
 FFBS
 Jontra
 Kalustyan
 Tucor
 Geno
 Hayleys Agriculture
 Linx Agritech
 Adinet
 Save Your Soils

 Licence holder · Niger · Gold










