

Sustainable farming · Evidence guide
Shifting Agriculture: 7 Green Farming Trends With Evidence
Shifting agriculture clears a plot, crops it briefly, then leaves it to regrow. It covers about 280 million hectares of fields and fallows (PLOS ONE, 2017). Legume rotations and intercropping have the clearest measured results among green options, mostly from outside shifting systems.
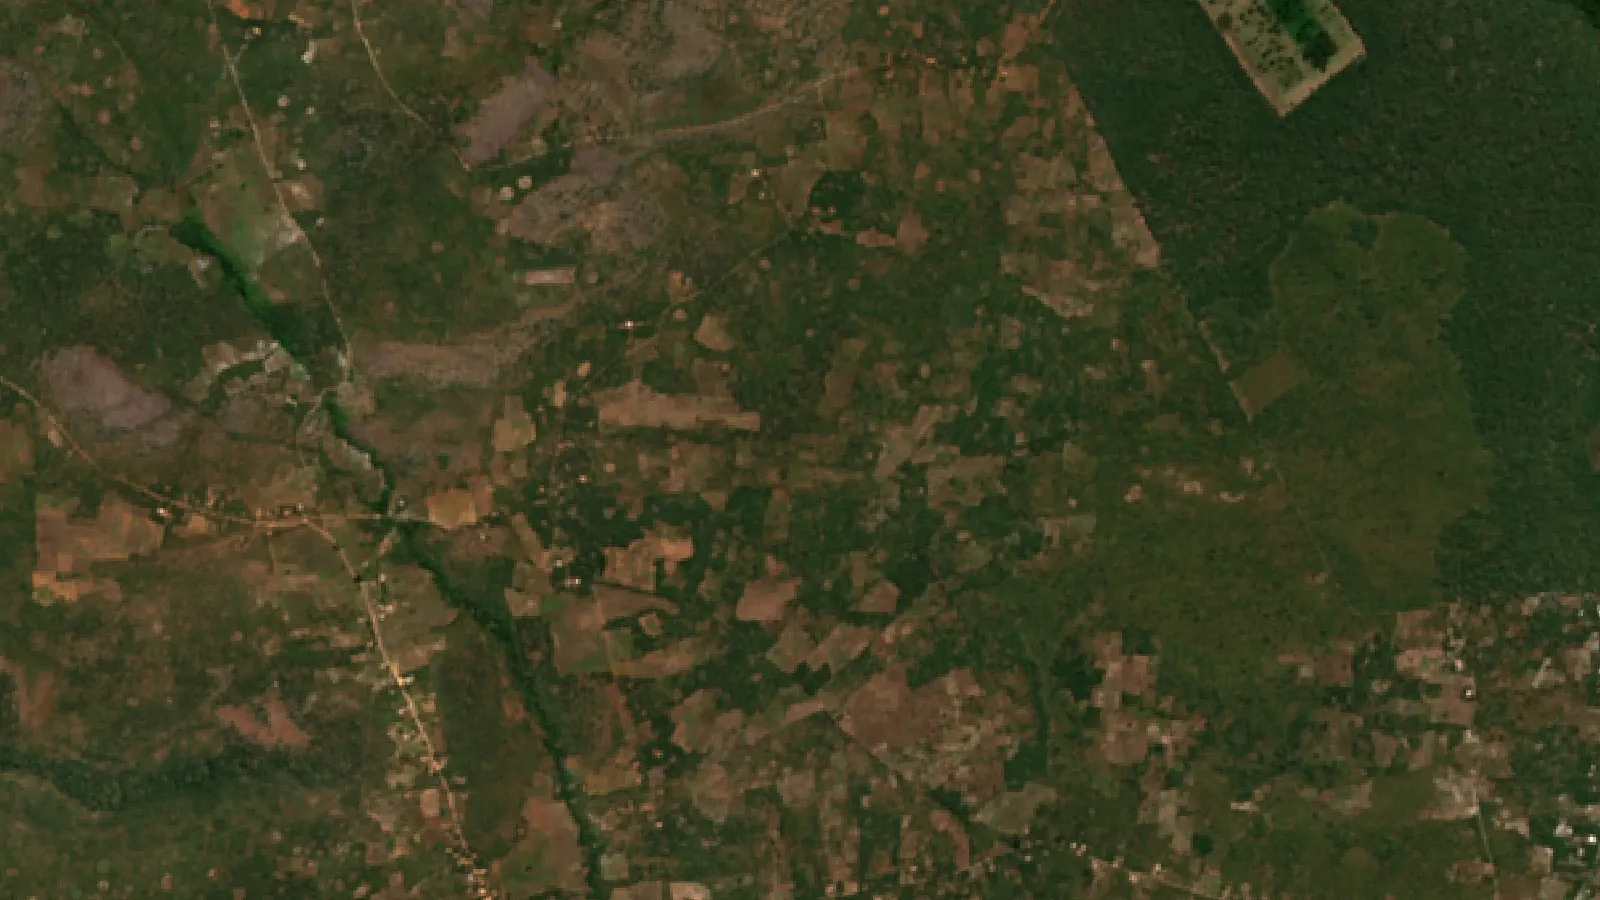
Key takeaways
- Shifting cultivation landscapes cover roughly 280 million hectares, including fallows (Heinimann et al., 2017).
- It accounts for 7.9% of world tree cover loss but 36.6% in Africa, 2001 to 2022 (Sims et al., 2025).
- Fallows cut too short bring soil decline and lower yields, an older FAO review warns.
- In Malawi trials, semi-perennial legume rotations at half the fertilizer rate matched monoculture maize grain, with steadier yields (PNAS, 2010).
- Land needed equals the area cleared each year times the full cycle length. The calculator tests your own numbers.
In this article
- What is shifting agriculture?
- Is shifting agriculture bad for forests?
- Will your land support the fallow you want?
- 7 green farming trends, ranked by strength of evidence
- 1. Legume rotations and agroecological intensification
- 2. Intercropping and crop diversification
- 3. Agroforestry and managed tree fallows
- 4. Satellite monitoring of fields and fallows
- 5. Biochar and better fire management
- 6. Cover crops and drought-tolerant varieties
- 7. Market links, certification and farmer-led research
- Comparison of the seven trends
- What are the best green technologies for farming beyond the tropics?
- How to start moving a shifting system towards greener practice
Shifting agriculture is a farming system in which a plot is cleared, cropped for a short time, then left to regrow while the farmer moves on. It still covers roughly 280 million hectares, counting fields and fallows, according to a global study in PLOS ONE (Heinimann and colleagues, 2017). The best green technologies for farming to consider here are legume rotations and intercropping, which have measured results, mostly from outside shifting systems, plus agroforestry and satellite monitoring of fallows.
This page sorts seven green farming trends by what the evidence shows. It also has charts of where shifting cultivation drives forest loss and a calculator that tests whether your land can support the fallow you want.
What is shifting agriculture?
You will also see it called shifting cultivation, swidden or slash-and-burn. An older FAO definition in Unasylva describes it as relatively short periods of continuous cropping followed by relatively long periods of fallow. The long fallow is what sets it apart from short-fallow and permanent farming.
The cycle has four stages:
- Clear. Farmers cut trees and shrubs on a plot, often in the dry season.
- Burn. The dried material is burned. The ash adds nutrients to the soil.
- Crop. Grains, tubers and legumes grow for a few seasons, until yields or weed control get worse.
- Fallow. The plot is left so trees and soil can recover, and the farmer moves to another plot.
Fire has practical reasons behind it. FAO lists them: burning saves labour, ash acts as fertilizer, nutrients become easier for plants to take up, and fire may kill fungal diseases and harmful insects. That is why advice to simply stop burning often fails. A replacement has to solve the same problems.
Where is it still practised?
The system is found across the humid and sub-humid tropics. The PLOS ONE study found signs of it in 62% of the one-degree grid cells it examined. Of those cells, 41% were in the Americas and 37% in Africa. The rest were in Asia and the Pacific. Larger areas with widespread signs include Central Africa, northern Laos and Myanmar, and Borneo.
The authors expect a strong decline. Their scenarios, which they call very rough, show the system shrinking in all regions over the coming decades and tending towards disappearance by 2090. They expect it to fade fastest in Asia and last longest in Central Africa. These are expected trends, not fixed figures.
How much land does it cover?
Published estimates differ widely, because land cover maps cannot reliably separate this practice from other mosaics of farms and trees. A figure of 1,000 million hectares appears in some papers, but the PLOS ONE authors traced it back and said it seems to be unfounded. The chart shows the other estimates they report. They note that the 260 million figure rests on land cover data, which is of limited use for spotting this practice.
Chart
Estimates of world shifting cultivation area
Million hectares, three published estimates
Is shifting agriculture bad for forests?
It depends on where you look. A satellite-based map in Environmental Research Letters (Sims and colleagues, 2025) attributes 7.9% of world tree cover loss from 2001 to 2022 to this system. Permanent agriculture was the leading driver, at 35%.
Chart
Shifting cultivation’s share of tree cover loss
Percent of tree cover loss attributed to it, 2001 to 2022
The regional picture is very different. In Africa the same map gives shifting cultivation 36.6% of tree cover loss. The Democratic Republic of the Congo stands out: the World Resources Institute reports that 86% of its primary forest loss from 2002 to 2025 came from small-scale shifting cultivation.
Tree cover loss here is not the same as permanent deforestation. The class is defined by clearing that is later abandoned and followed by regrowth. The damage grows when the regrowth gets too little time.
Why short fallows are the real problem
FAO’s Unasylva review sets out the core limit. Long fallows need a lot of land per family. When population rises and land runs short, farmers shorten the fallow. It notes this happening in northeastern Zambia, and warns that past a certain point shorter fallows bring soil degradation and lower yields. At that stage, farmers need a more radical change towards permanent farming.
How many people the system can carry is debated. FAO cites one estimate of no more than 56 people per square kilometre, and another from Ivory Coast of up to 123. So no single number fits every landscape. You can test your own situation in the calculator below.
Will your land support the fallow you want?
The arithmetic of a rotation is simple. If you clear the same area each year, total land needed equals the yearly area multiplied by the full cycle length, crop years plus fallow years. Enter your own numbers to see the land needed and the longest fallow your land allows.
Try the numbers for your own farm below.
Calculator
How long a fallow can your land support?
Enter your own plot size, crop years, fallow years and land.
- Land needed for the fallow you want: 12.0 ha
- Land left over (minus means a shortfall): 0.0 ha
- Share of the cycle spent in fallow: 83.3 %
Example values only, not a benchmark or a recommendation; they are set so the land exactly meets the rotation. The right fallow depends on your soil and climate, so get local advice.
7 green farming trends, ranked by strength of evidence
Legume rotations and intercropping, which have measured results, come first. The order after that is our judgement, based on adoption counts, specifications and models, and the last trend has the thinnest evidence. Each has a “Best for” line. Soil, climate and land rights differ from place to place, so test any change on a small area first.
1. Legume rotations and agroecological intensification
This means using ecological processes to get more from the same land: rotations, soil cover and mixed crops. FAO describes 10 Elements of Agroecology and stresses that there is no single way to apply it, because local conditions decide what works.
One large dataset comes from Malawi. A study in PNAS (Snapp and colleagues, 2010) compared maize alone with maize diversified with legumes, in a countrywide trial (n = 991) and a decade of participatory research (n = 146). Rotations with semi-perennial legumes at half the fertilizer rate gave the same grain as monoculture. Yield variability fell from 22% to 13%, and returns were twofold better. The study also notes that natural fallows and shifting cultivation have declined sharply in sub-Saharan Africa, but its trial did not detect a soil carbon gain, and the authors note such changes take years to show.
Best for: farmers whose fallows have become too short to restore fertility.
▶ How soil and water together shape what a farm can produce. · 9:40
2. Intercropping and crop diversification
Intercropping grows two or more crops on the same land at the same time. It is old practice in swidden fields, where grains, tubers and legumes commonly share a plot. A global meta-analysis in npj Sustainable Agriculture, covering 4,195 observations from 334 studies in 60 countries, found that yield losses per crop were smaller than the cut in planting density. Its modelled potential varies sharply by cereal.
Chart
Modelled production gain from optimised intercropping
Percent, modelled global potential: maize with soybean, barley with pea, wheat with faba bean
Those gains are modelled potential from optimised planting, not results a farmer should expect in one season. Results depend on matching species and plant spacing.
Best for: small plots where food variety matters as much as total grain.
3. Agroforestry and managed tree fallows
Agroforestry keeps trees in the farming system instead of clearing them all. FAO describes it as a long-standing way of combining trees with crops and animals, and it covers many different land management systems. In a shifting system, this can mean keeping useful trees during clearing or planting trees into the fallow.
Interest is not limited to the tropics. The USDA Forest Service analysis of the 2022 Census of Agriculture counted 32,717 US farms reporting agroforestry, up 6% from 30,853 in 2017.
Best for: households with secure long-term rights to the land. Trees can take years to pay back, so insecure tenure can be a barrier.
4. Satellite monitoring of fields and fallows
Satellites can now follow the patchwork of clearings and regrowth at a useful scale. The two Sentinel-2 satellites are designed to revisit the same spot every 5 days at the Equator, with some bands at 10 m resolution. The Sims map, built with satellite and other data, separates seven drivers of tree loss with an overall accuracy of 90.5%.
The practical limits matter. Cloud can block optical images in the wet season, when crops are growing. Satellites also show that vegetation has changed, not why. A field visit is still needed to find the cause. Farm tools such as Farmonaut use this type of satellite imagery to show crop vegetation maps for mapped fields.
Best for: cooperatives, programme managers and larger farms tracking many scattered plots.
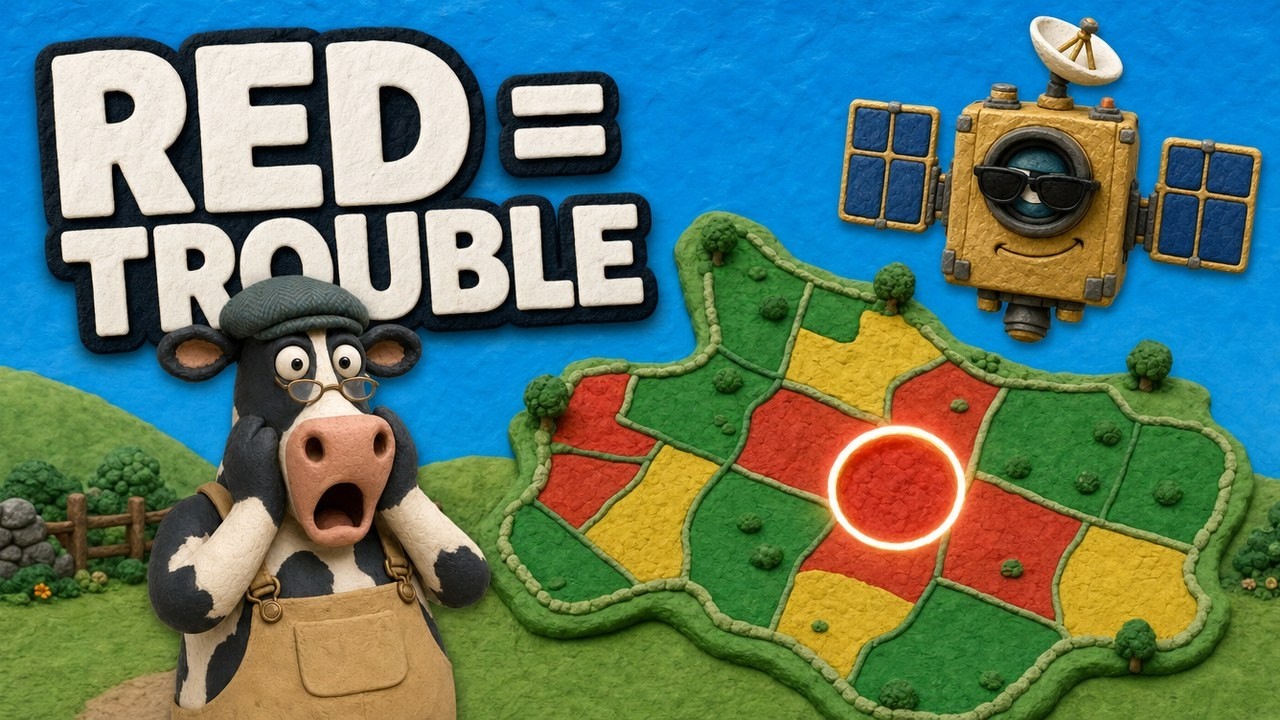
▶ How satellite NDVI maps show changes in crop condition across a large farm. · 4:09
5. Biochar and better fire management
Biochar is charcoal made from biomass in low-oxygen conditions and added to soil. A Nature Communications study (Woolf and colleagues, 2010) put the maximum sustainable global potential at 1.8 Pg of CO2-carbon equivalent a year, or 12% of emissions at that time. The authors say this figure leaves out economic, social and cultural barriers, so treat it as a ceiling.
Timing and control of burning also matter. Fire was a major contributor to world tree cover loss in 2025, at 42% of 25.5 million hectares, according to World Resources Institute data. That figure covers all fires, not only farm burns. Check local burn rules and permits before any fire, and get local advice on fire breaks and timing.
Best for: places with spare crop residue and enough labour to make char. It adds work compared with an open burn.
6. Cover crops and drought-tolerant varieties
Cover crops keep living roots and soil cover between main crops. They are widely discussed but still cover little land in the US. USDA’s Economic Research Service reports that they reached 4.7% of US cropland in 2022.
Drought tolerance is the seed side of the same trend. A review in GM Crops and Food reports that genetically modified drought-tolerant maize was planted on 1.42 million hectares in the United States in 2020. Conventionally bred options exist too. Check which varieties are registered where you farm, and follow seed and input labels and local rules.
Best for: fields moving from long fallow to shorter or permanent cropping, where soil cover has to replace regrowth.
7. Market links, certification and farmer-led research
This trend has the thinnest measured evidence. The ideas are plausible: cooperatives may improve bargaining power, certification can open higher-value markets, and traceability records show where produce came from. We found no good data that blockchain lifts incomes for shifting cultivators. Certification also has costs, and a plot that moves every few years can be hard to certify.
Finance and training are the other half. FAO’s agroecology framework came from a consultation that included small-scale food producers, which supports the case for farmer-led research. Where farmers want a loan or carbon payment, they should get independent financial and legal advice first and check who holds the rights to the land and any credits.
Best for: organised groups with a steady crop and a known buyer.
Comparison of the seven trends
This table shows what the evidence measures. No source gives a single comparable adoption or yield score for all seven.
| Trend | Main benefit | Evidence | Main catch |
|---|---|---|---|
| Legume rotations | Same grain at half the fertilizer, steadier yields | Malawi participatory trials, PNAS | Needs seed, labour and farmer support |
| Intercropping | Yield losses smaller than the density cut | Global meta-analysis, 334 studies | Results vary by species and spacing |
| Agroforestry | Long-term soil cover and tree products | FAO overview, US census counts | Slow payback, needs secure tenure |
| Satellite monitoring | Tracks clearing and regrowth at scale | Sentinel-2 specification, Sims map | Cloud gaps, does not show cause |
| Biochar and fire care | Carbon storage in soil | Global modelling, Nature Communications | Extra labour, limit is a ceiling |
| Cover crops and seed | Soil cover, drought protection | USDA census data and a crop review | Seed cost and local registration |
| Markets and finance | Possible better prices and credit | No measured source found | Certification costs, moving plots |
What are the best green technologies for farming beyond the tropics?
Most readers in the US, Canada, Europe and Australia do not farm in shifting systems, but the principles carry over: keep soil covered, diversify, and target inputs. On US row crop acreage, automated guidance leads precision tools. USDA’s February 2023 report on precision agriculture (EIB-248) found it on well over 50% of acreage planted to corn, cotton, rice, sorghum, soybeans and winter wheat. Yield maps, soil maps and variable-rate tools were lower, at 5% to 25% of acreage for winter wheat, cotton, sorghum and rice.

▶ Satellite vegetation indices such as NDVI and EVI, and how farmers use them. · 10:49
Cover crop area shows how slowly a green practice can spread. For a wider list with data, see our guide to the best green technologies for farming.
Chart
US cropland planted to cover crops
Million acres, 2017 and 2022 census years only
How to start moving a shifting system towards greener practice
- Map your land. Record each plot, the year it was cleared and its fallow age. A hand sketch works; satellite maps help at larger scale.
- Work out your real fallow. Use the calculator. If the fallow your land allows is shorter than what restores your soil, plan a change.
- Pick one soil practice. A legume rotation or an intercrop is a simple first test on a small plot.
- Keep useful trees. Protect fruit, fodder and nitrogen-fixing trees during clearing.
- Plan any fire with care. Check local rules, use fire breaks, and warn neighbours.
- Compare results. Weigh yields from the test and the normal plot for at least two seasons, since one season can mislead.
FAQ
What is shifting agriculture in simple words?
Farmers clear a plot, grow crops on it for a short time, then leave it to regrow and move to another plot. The rest period, called a fallow, lets soil and trees recover.
What crops are grown in shifting agriculture?
It depends on the region. Mixed plots of grains, tubers and legumes are common, and many are grown mainly for household food. Local crop lists vary, so check with a local extension service.
Is shifting cultivation sustainable?
It can be when fallows are long enough and population pressure is low. FAO warns that very short fallows lead to soil degradation and lower yields, so the answer depends on land per family.
Why is shifting agriculture declining?
The PLOS ONE authors point to economic development and changes in farming and in the wider economy, especially in Asia. Less land per family also makes long fallows harder to keep, as FAO notes.
What are the best green technologies for farming?
There is no single best one. Legume rotations and intercropping have the best measured results here, though mostly from outside shifting systems. On US row crop acreage, automated guidance is widely adopted, per USDA, and cover crops protect soil.
Can satellites track shifting agriculture?
Yes, at landscape scale. Researchers used satellite data to map it worldwide. Cloud and young regrowth make individual plots harder to read, so ground checks are still needed.
Related pages on our site
greenhouse and microgreen methods · agriculture data collection tools · carbon footprint tracking · crop loans and insurance · farm fleet management · product traceability · large farm administration · web and mobile apps · satellite data access · crop data APIs · API developer documents
Farmonaut crop monitoring
See your own fields from space
Draw your fields once and Farmonaut shows satellite vegetation maps for them through the season.




Keep reading

Sources
- Heinimann et al., A global view of shifting cultivation, PLOS ONE (2017): pmc.ncbi.nlm.nih.gov
- FAO, Unasylva 150: Changes in shifting cultivation in Africa: fao.org
- Sims et al., Global drivers of forest loss at 1 km resolution, Environmental Research Letters (2025): iopscience.iop.org
- World Resources Institute, Global Forest Review: deforestation trends (2026): gfr.wri.org
- World Resources Institute, Tropical rainforest loss release (2026): wri.org
- FAO, Agroecology overview and 10 Elements: fao.org
- Snapp et al., Biodiversity can support a greener revolution in Africa, PNAS (2010): pmc.ncbi.nlm.nih.gov
- Ruillé et al., intercropping global meta-analysis, npj Sustainable Agriculture (2026, corrected March 2026): nature.com
- FAO, Agroforestry home page: fao.org
- USDA Forest Service, Agroforestry across the United States: 2022 Census of Agriculture: research.fs.usda.gov
- Copernicus SentiWiki, Sentinel-2 mission overview: sentiwiki.copernicus.eu
- Woolf et al., Sustainable biochar to mitigate global climate change, Nature Communications (2010): nature.com
- USDA ERS, Charts of Note: cover crop use, 2022 Census of Agriculture (2024): ers.usda.gov
- Brookes, Farm income and production impacts of GM crops, GM Crops and Food (2022): pmc.ncbi.nlm.nih.gov
- USDA ERS, Precision Agriculture in the Digital Era, EIB-248: ers.usda.gov
Discussion
Questions, corrections or field experience? Share them below. First-time comments are reviewed before they appear, and your email is never published.
No comments yet. Be the first to add a question or your experience.

 Unifrutti Gulf
 Deluxe Conseil
 Krishify
 TVS Electronics
 BW Pipelines
 WICO
 Gen Chayat
 Chimera Innovation
 SkyHarvest
 Polaris Digitech
 Teledarbas
 Wild Oak Farm
 SFX
 Doodlakine
 Exurbia Geospatial

 Licence holder · Niger · Gold
 Client · Tanzania · Gold
 Client · Somalia · Gold
 Client & affiliate partner · Ghana · Gold










