

Reviewed September 2026 against NCREIF Farmland Index and USDA Economic Research Service (ERS) data.
U.S. farmland delivered an annualized total return of 11.0% between 1992 and 2020, against 8.0% for the S&P 500 over the same period, according to the NCREIF Farmland Index. It did so with roughly a third of the volatility of stocks — a standard deviation of 6.84% versus 16.9% — and a correlation to equities of -0.06 between 1994 and 2024, meaning farmland’s returns have moved almost independently of the stock market. Those are the historical farmland returns behind the “benefits of farmland investing” pitch; this article lays out the actual numbers, where they came from, where they’ve gone since, and the risks that the pitch usually leaves out.
Historical Farmland Returns: The Data
The most-cited benchmark for historical farmland returns in the United States is the NCREIF Farmland Index, published by the National Council of Real Estate Investment Fiduciaries. It tracks institutionally owned, income-producing farmland — row crops and permanent plantings — across U.S. regions, and it is the closest thing the sector has to an S&P 500 for dirt.
Over the 29-year span from 1992 to 2020, NCREIF-tracked farmland returned 11.0% annualized, combining two components: rental or crop income and land price appreciation. That return was not evenly distributed across decades. USDA’s Economic Research Service (ERS), which maintains the longest-running farmland value series in the country, points to the first decade of the 2000s as a particularly strong stretch — annualized returns around 14% during 2000-2010, driven by a commodity price boom and low interest rates that pulled land values up across the Corn Belt and Plains states.


That volatility-of-timing point matters for anyone chasing a single headline number. “Farmland returns 11%” is true as a 29-year annualized average; it is not true of any single year, and it is not what 2025 delivered (more on that below). Anyone underwriting a specific farmland investment returns projection should pull the NCREIF series directly rather than repeating a decades-old average as if it were current.
Farmland vs Stocks, Bonds and REITs
To place farmland investment returns in context, the NCREIF comparison against the S&P 500 over the same 1992-2020 window is the most defensible like-for-like figure available in the brief behind this article:
| Asset Class | Annualized Return, 1992-2020 | Volatility (Std. Dev.) | Correlation to Equities (1994-2024) |
|---|---|---|---|
| Farmland (NCREIF) | 11.0% | 6.84% | -0.06 |
| S&P 500 | 8.0% | 16.9% | 1.00 (baseline) |
The number that matters more than the return itself is the near-zero correlation: -0.06 between farmland and equities from 1994 to 2024, per NCREIF. A return that beats stocks is good; a return that beats stocks and moves independently of them is what makes an asset class worth adding to a portfolio rather than just chasing performance.

10 Low-Investment, High-Profit Agri Business Ideas
What the historical data does and doesn’t tell you
- 📈 The 11.0% figure blends income return (cash rent or crop revenue) and appreciation — the split between the two shifts by era, and the two components carry very different risk profiles.
- 🌾 NCREIF’s index tracks institutionally held farmland, which skews toward larger, professionally managed row-crop and permanent-crop operations. A family-owned quarter section bought at a local auction will not necessarily track the index.
- ⚡ The 6.84% volatility figure is lower than stocks by design — farmland doesn’t mark-to-market daily, and appraisal-based valuation smooths reported volatility compared to an asset that trades every second.
- 🔎 None of this data covers farmland outside the U.S. institutional universe; Canadian, U.K. and EU farmland returns are tracked through different national datasets (Statistics Canada, Defra, Eurostat) not included in the NCREIF series.
- Try it: Estimated results
Farmland Returns Since 2020: The Slowdown
The 11.0% long-run average and the 14% 2000-2010 stretch both predate a much weaker recent period, and an article that stopped at the historical average would be misleading. In 2025, the NCREIF Total Farmland Index returned just 0.20% — composed of a 3.05% income return partly offset by land value declines in several regions. Over the five years from 2020 to 2025, USDA ERS puts the compound annual growth rate of farmland values at 5.8% nominal, well under both the 29-year average and the 2000s boom decade.
That gap between income return (3.05%, positive) and total return (0.20%) tells the real 2025 story: rental and crop income kept coming in, but land price appreciation went negative, dragging the combined figure down close to flat. This is exactly the pattern USDA ERS’s farmland value series is built to track over long stretches — it’s the same dataset investors should pull to see whether that appreciation drag has reversed by the time they’re reading this article.
Anyone underwriting “understanding farmland returns” should separate income return from appreciation every time a number is quoted. Income return (cash rent, crop revenue net of costs) is the more stable, more predictable component. Appreciation is the component that swings — up 14% a year in a commodity boom, flat or negative when farm income compresses and interest rates bite into land-buyer demand.
What Has Driven Farmland Value Historically
The swings in the historical record above didn’t happen in a vacuum. A handful of structural episodes explain most of the variance in U.S. farmland value over the past century, and the same categories of event are what will move the number next:
✔ Major Drivers and Their Impact
- 🌀 Post-war productivity gains: Mechanization and synthetic fertilizer adoption from the 1940s onward raised yields per acre across the Corn Belt, lifting the income component of returns and, with it, land prices.
- 🌪️ The Dust Bowl (1930s): Drought and wind erosion across the U.S. High Plains caused a severe, multi-year land devaluation — the sharpest documented drop in the historical U.S. farmland record, and the reason soil conservation practices are now baked into most federal land-use programs.
- 💸 The 2000-2010 commodity boom: Rising corn, soybean and wheat prices combined with low interest rates to push the annualized return over that decade to roughly 14%, per USDA ERS and industry sources — the strongest sustained decade in the modern record.
- 🔗 The 2008 financial crisis: Farmland’s income-driven return structure meant it held up materially better than equities during the crash, reinforcing the diversification case that shows up in the -0.06 equity correlation figure above.
- 🥦 Organic and sustainable farming premiums: Land suited to certified organic production or regenerative practices now commands a premium in parts of North America and Europe — see Farmonaut’s coverage of organic farming trends for the demand side of that shift.
- 📉 2020-2025 appreciation slowdown: Higher interest rates and softer row-crop prices pulled the growth rate down to 5.8% CAGR nominal over the five years, and to a near-flat 0.20% total return in 2025 specifically, per NCREIF.

Regenerative Agriculture: Carbon Farming, Soil Health & Climate-Smart Solutions | Farmonaut
Treating a national average as a local truth. A drought or a regional commodity price shock can hit one state’s land values hard while the NCREIF national index barely moves. Always check the region-specific NASS QuickStats figures (link below) before relying on a national number for a local decision.
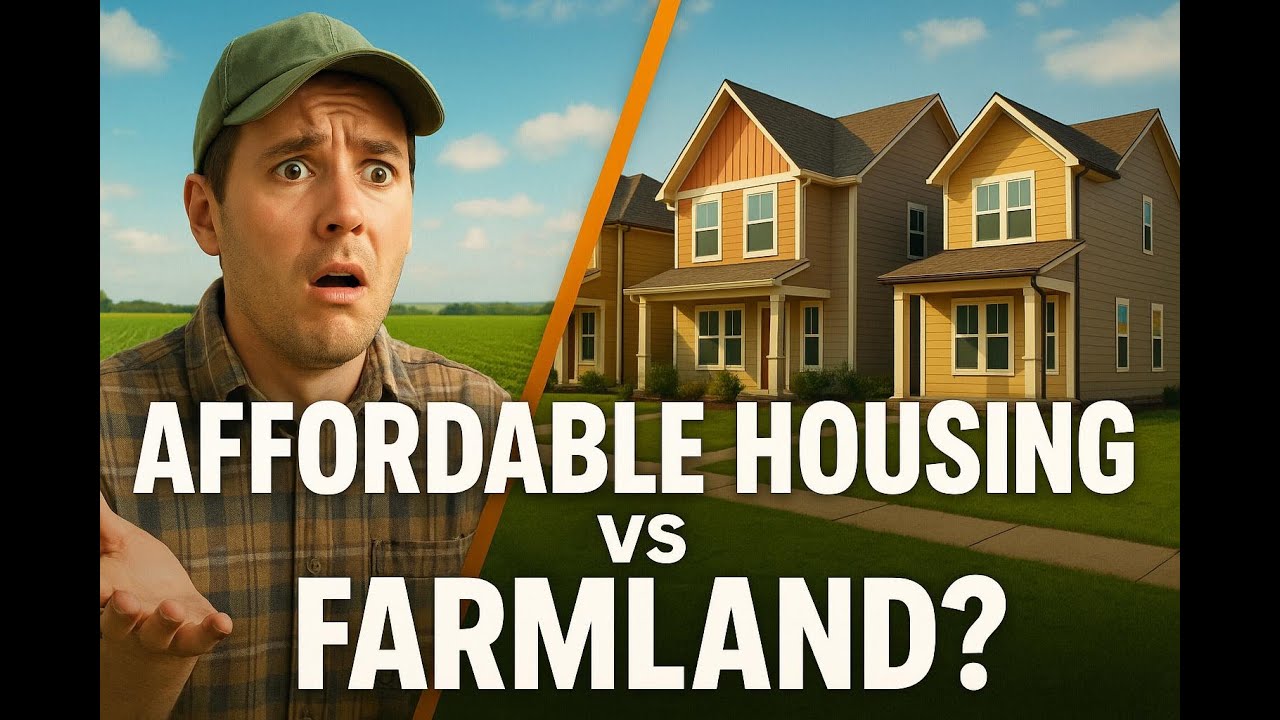
PEI Land Clash: Housing Crisis vs Farmland Protection | Sleepy Hollow Tiny-Home Debate
Benefits of Investing in Farmland
The benefits of investing in farmland, and more specifically the benefits of farmland investing that show up consistently in the NCREIF and USDA ERS data, come down to five things — each backed by a number above rather than a general claim:
🌟 The Five Benefits, With Their Supporting Data
- Return that has historically beaten equities: 11.0% annualized (1992-2020) vs 8.0% for the S&P 500 over the identical period — NCREIF Farmland Index.
- Lower volatility: 6.84% standard deviation vs 16.9% for stocks over the same period — roughly a third of the swing, for a return that was higher, not lower.
- Near-zero correlation to equities: -0.06 between 1994 and 2024, meaning farmland’s return pattern has been effectively independent of the stock market’s — the core diversification argument.
- A recurring income stream: the 2025 income return of 3.05% came in even as total return went flat, showing the rental/crop-revenue component holds up when appreciation doesn’t.
- Exposure to a structurally constrained input: arable land supply doesn’t expand the way equity issuance or bond supply can, which is the structural argument behind long-run appreciation even through slow periods like 2020-2025.

MENA Economic Outlook: Game-Changing Trends for Growth, AgTech & Food Security
The diversification case rests on the correlation figure, not the return figure. A -0.06 correlation to equities over three decades (1994-2024, NCREIF) means farmland has, historically, zigged when stocks zagged closely enough to smooth portfolio-level volatility — independent of whether farmland’s own return in any given year was high or low.

How Satellite Tech & AI Are Powering Agricultural Growth | Farmonaut Insights
📢 Monitoring the Land You Own
- 🌐 Satellite-based monitoring tools let investors track crop condition, soil moisture and field-level productivity remotely rather than relying solely on a farm manager’s report.
- 🖥 Farmonaut’s platform provides real-time crop, soil and climate insights that help both direct landowners and fund-level farmland investors track whether the operations behind their income return are performing as expected.
- 🔗 For ESG-linked farmland mandates specifically: Farmonaut’s Carbon Footprinting Solution tracks and reports on-farm carbon impact.
Risks of Farmland Investing
The risks of farmland investing are the other half of the same dataset, and the 2025 slowdown above is itself an example of one of them. Five risk categories account for most of the variance between the 11.0% long-run average and any given year’s actual result:
⚠ The Five Risk Categories
- ⚡ Weather and climate volatility:
- Drought, flooding and off-season weather events hit crop yields directly, which flows straight into the income-return component of total return.
- The Dust Bowl remains the historical extreme case; USDA’s disaster-declaration and crop-progress reporting is the way to track current-season exposure by county.
- 💸 Commodity price volatility:
- Land rents and crop revenue move with corn, soybean and wheat prices. Current per-bushel futures and USDA WASDE projections are not part of the long-run property-value data this article draws on, and change too fast to quote reliably here — check the CME futures curve or USDA WASDE report directly for a live number.
- 📜 Regulatory and policy changes:
- Shifts in farm-program subsidies, land-use zoning or estate and property tax rules directly change the after-cost return a landowner realizes, independent of the underlying farmland’s productivity.
- 🔒 Liquidity risk:
- Farmland cannot be sold in a day. Even in an active local market, closing a farmland sale typically takes months, and that illiquidity is part of why the reported volatility is lower — infrequent appraisal-based pricing smooths the number, it doesn’t eliminate the underlying risk of needing to exit fast.
- 👨🌾 Operational and appreciation risk:
- The 2025 data above is the clearest illustration: a positive 3.05% income return was nearly wiped out by negative appreciation, producing a 0.20% total return. Poor farm management, tenant turnover or a soft land market can each independently erase a year’s income gain.
Satellite monitoring doesn’t remove commodity-price or policy risk, but it narrows the operational-risk category by giving landowners and fund managers an early read on crop stress, soil erosion or irrigation failure before it shows up in a season-end yield report.

Farmonaut: Transforming Farming in 40+ Countries with Satellite Technology
Farmland ROI Calculator
Use your own acreage, purchase price and expected income/appreciation split — sourced from NASS QuickStats or your own farm’s data — to estimate a blended return rather than relying on the 11.0% historical average as a stand-in for your specific deal.
Estimated results:
Assumptions: income and appreciation rates are simple annual estimates you supply, not projections from Farmonaut. The calculator does not account for property taxes, financing costs, closing costs, insurance or management fees, all of which reduce net return. Default values reflect the 2025 NCREIF income-return figure (3.05%) with appreciation set to zero, matching the near-flat 2025 total return — adjust both fields to model your own market and period.
How to Check Current Farmland Returns Yourself
Every figure in this article carries a date because farmland returns move year to year, and a number quoted without its vintage is close to useless for underwriting a real decision. Here is the durable method for pulling a current figure rather than relying on this article's snapshot:
- National return benchmark: Go to the NCREIF Farmland Index page and pull the latest quarterly or annual total return, income return and appreciation return figures — the same three components used above for 2025.
- National and historical land values: Go to USDA ERS Farmland Value, which maintains inflation-adjusted farmland value series back to 1950 and links to a downloadable "Farm Real Estate Statistics 1950-1995" dataset for the pre-digital era.
- State and county-level detail: Query USDA NASS QuickStats for annual land values and cash rent by state and year back to the 1990s — this is the source to use before treating a national average as true for a specific state or county.
- Compare against your own holding period: Match the reporting period (calendar year, five-year CAGR, or full-cycle average) to your own investment horizon rather than mixing a single-year figure with a multi-decade average.
Neither NCREIF nor USDA ERS publishes named, deal-level case studies of individual farmland investment returns — those figures typically live in paid institutional research or private fund reporting. What is publicly available and verifiable is the aggregate index data cited throughout this article: apply the same NCREIF income/appreciation split and USDA ERS regional values to model a specific parcel rather than relying on an anecdotal case study.
Satellite and AI Tools for Farmland Investors
Farmonaut offers satellite imagery, AI-driven analytics and blockchain traceability tools that are directly useful once the decision to hold farmland has been made — they don't change the historical return data above, but they narrow the operational-risk category discussed earlier. For farmland investors, landowners and managers, the platform is built to:
- 🛰️ Monitor crop health, soil quality and water resources in real time across a portfolio of parcels, supporting land acquisition and ongoing management decisions.
- ⚡ Flag early signs of drought stress, pest pressure or soil degradation before they show up in a season-end yield or income report.
- 🔗 Provide blockchain-based agricultural traceability, useful where buyers or lenders require supply-chain transparency — see Product Traceability.
- 🌿 Track carbon and environmental impact via carbon footprinting tools, relevant for ESG-mandated farmland allocations.
- 🤝 Support credit and insurance verification through satellite-powered crop loan and insurance verification, reducing fraud risk for lenders financing farmland purchases.
- 🚜 Manage large-scale operations with Fleet Management and the Large Scale Farm Management tools.
Access is available via  , API Access, and the API Developer Docs, alongside land-use context in Farmonaut's land classification guide.

Unlocking the Hidden Importance of Land Classification: Why It Matters More Than You Think!

Farmonaut Introduction - Large Scale Usage For Businesses and Governments
Where Farmland Fits in a Portfolio
The data supports a specific, bounded claim rather than a blanket one: over 1992-2020, U.S. farmland returned more than equities (11.0% vs 8.0%) with less volatility (6.84% vs 16.9%) and close to zero correlation to the stock market (-0.06, 1994-2024). It does not support the claim that farmland returns 11% every year — 2025's 0.20% total return, on a still-positive 3.05% income return, is the clearest recent counterexample, and the 2020-2025 five-year CAGR of 5.8% nominal sits well under the long-run average.
The risks that produce that gap between the long-run average and any single year — weather, commodity prices, policy, illiquidity and operational execution — are the same five categories to check before any farmland purchase, regardless of how strong the historical headline number looks. The durable approach is the one laid out in the "how to check" section above: pull the current NCREIF total, income and appreciation returns, cross-check USDA ERS's regional values and NASS QuickStats for the specific state or county, and model income and appreciation separately rather than as one blended figure.







Frequently Asked Questions
What are the historical returns of farmland investing?
U.S. farmland returned 11.0% annualized from 1992 to 2020, per the NCREIF Farmland Index, versus 8.0% for the S&P 500 over the same period. Returns varied significantly by decade — around 14% annualized during the 2000-2010 commodity boom, and just 0.20% total return in 2025 (3.05% income return offset by a decline in land appreciation). Pull the current figure from the NCREIF Farmland Index rather than relying on the long-run average alone.
What is the ROI on farmland investment?
Farmland investment ROI has two components: income return (cash rent or crop revenue) and appreciation (land value change). In 2025, NCREIF recorded a 3.05% income return and a 0.20% total return, meaning appreciation was roughly negative 2.85%. Over 1992-2020 the blended annualized return was 11.0%. Use the calculator above with your own purchase price and expected income/appreciation split to estimate a specific deal's ROI.
What are the risks of farmland investment?
The five main risks are weather and climate volatility (drought, flooding), commodity price volatility (crop prices drive rents), regulatory and policy changes (subsidies, land-use rules, tax treatment), liquidity risk (farmland sales typically take months to close), and operational risk (management quality, tenant turnover). The 2025 NCREIF data — positive income return nearly offset by negative appreciation — is a direct illustration of appreciation risk in a single year.
Why is farmland considered a portfolio diversifier?
Farmland's return correlation to equities was -0.06 between 1994 and 2024, per NCREIF — close to zero, meaning its returns have historically moved largely independently of the stock market. Combined with lower volatility (6.84% vs 16.9% for the S&P 500, 1992-2020), that low correlation is the core diversification argument, separate from whether farmland's absolute return in any given year is high or low.
Where can I find current farmland investment data instead of historical averages?
Three sources, all free: the NCREIF Farmland Index for national quarterly and annual returns; USDA ERS Farmland Value for inflation-adjusted historical values back to 1950; and USDA NASS QuickStats for state and county-level land values and cash rents back to the 1990s.
Treat the 11.0% long-run average as a ceiling reference, not a forecast — 2025's 0.20% total return shows how far a single year can sit below it. Check the NCREIF and USDA ERS links above for the current figures before underwriting any specific farmland purchase.

 Kubota
 Grow Indigo
 FFBS
FFBS Jontra
 Kalustyan
 Tucor
Tucor Geno
Geno Hayleys Agriculture
 Linx Agritech
 Adinet
 Save Your Soils
 Grandstream Algérie
 XOS Realty
 Geospatial Lab Africa
 Agro La Gándara
 HIPSAC
 ZOL Zimbabwe
 Juligerm
