

Critical minerals ETFs · Fund comparison
Critical Minerals ETFs Compared: Holdings and Fees
SETM, PICK, XME and BATT compared on index rules, holdings, expense ratios (0.35% to 0.65%) and assets, using dated October 2026 data. Facts only, with a fee calculator and charts of what the funds hold.
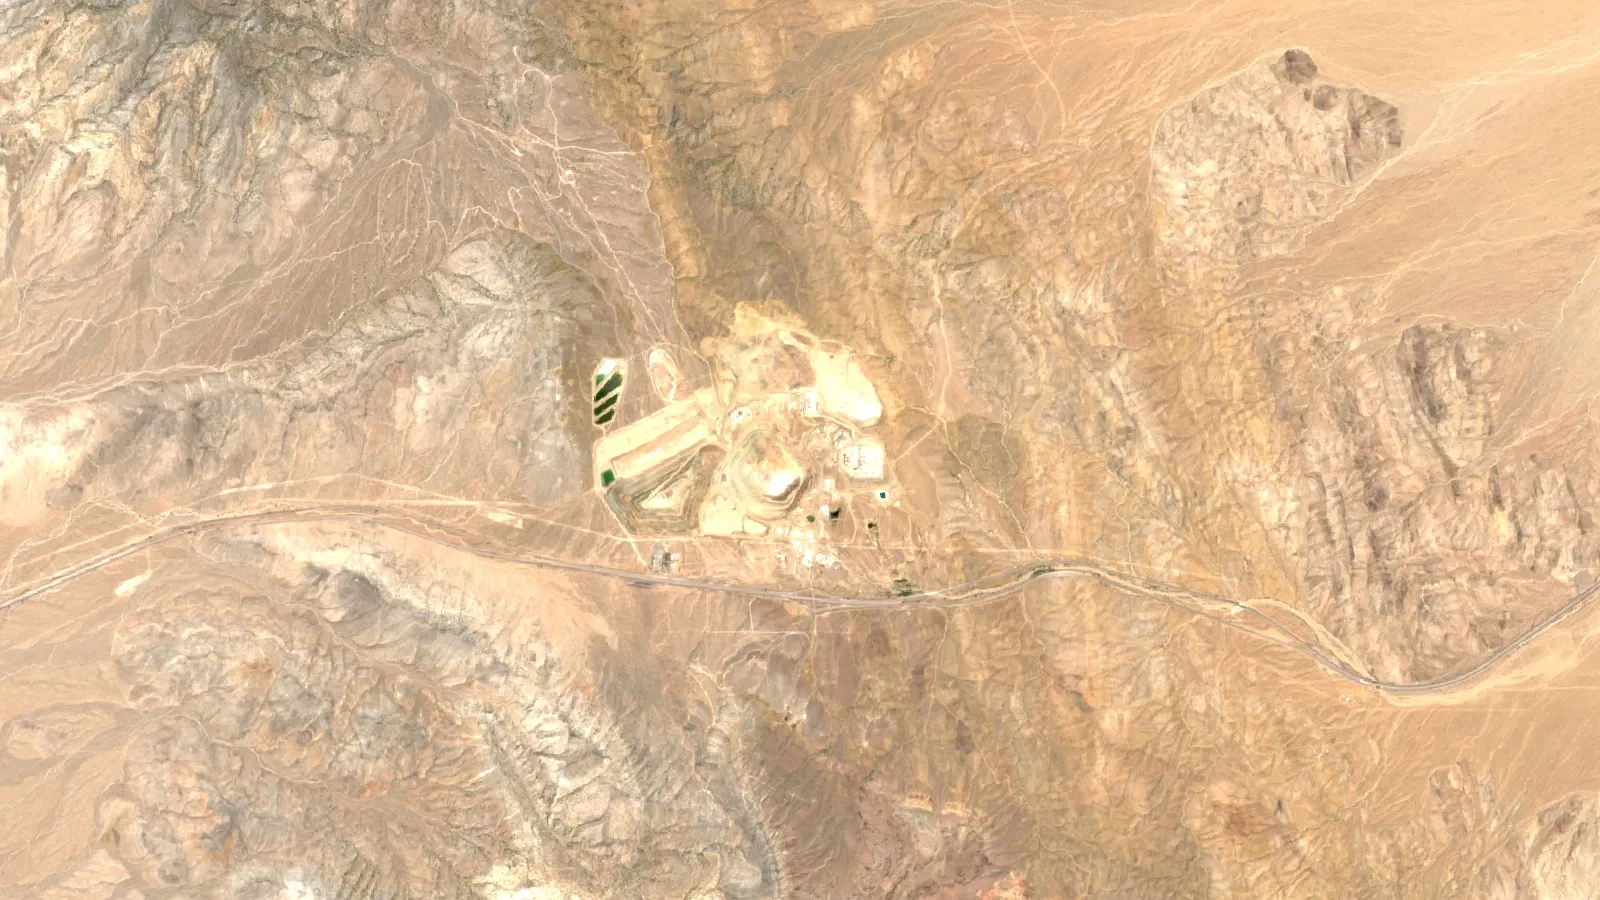
Key takeaways
- The final 2025 USGS list names 60 critical minerals and added copper, silver and uranium (USGS, November 2025).
- Expense ratios of the four funds run from 0.35% (XME, gross) to 0.65% (SETM) and assets from US$108 million (BATT) to US$3.9 billion (XME), mid-October 2026.
- Freeport-McMoRan is in the top ten of all four funds; steelmakers are in PICK and XME, uranium and rare earth miners in its top holdings (SETM).
- The top ten holdings make up 39.58% of SETM, 48.79% of PICK, 52.72% of XME and 48.05% of BATT (StockAnalysis and Amplify, October 2026).
- This page gives holdings, fees and assets with dates. It is not investment advice.
In this article
- Critical minerals ETFs compared: four broad funds side by side
- How we chose these funds
- What counts as a critical mineral
- What each fund holds
- Where the four funds overlap and where they differ
- Fees, size and concentration
- Fee calculator: what an expense ratio costs over time
- How to check a critical minerals ETF in 6 steps
- Risks that come with metals and mining funds
- What sits behind the shares
- Frequently asked questions
No single US-listed fund owns “all the critical minerals”. The broad funds that come closest are the Sprott Critical Materials ETF (SETM), the iShares MSCI Global Metals & Mining Producers ETF (PICK), the State Street SPDR S&P Metals & Mining ETF (XME) and, for the battery slice, the Amplify Lithium & Battery Technology ETF (BATT). In mid-October 2026 their annual expense ratios ranged from 0.35% (XME) to 0.65% (SETM), and assets from about US$108 million (BATT) to about US$3.9 billion (XME). This page sets out what each fund holds, what it costs and where the holdings differ from the label. It reports facts with dates and gives no buy or sell view.
Critical minerals ETFs compared: four broad funds side by side
An exchange-traded fund (ETF) is a fund whose shares trade on a stock exchange all day. It holds a basket of shares, here mining and metals companies. The table below uses issuer pages for XME and BATT and the StockAnalysis data service for SETM and PICK. Every figure carries its date, because holdings, fees and assets change.
| Item | SETM | PICK | XME | BATT |
|---|---|---|---|---|
| Fund name | Sprott Critical Materials ETF | iShares MSCI Global Metals & Mining Producers ETF | State Street SPDR S&P Metals & Mining ETF | Amplify Lithium & Battery Technology ETF |
| Exchange | Nasdaq | Cboe BZX | NYSE Arca | NYSE Arca |
| Index followed | Nasdaq Sprott Critical Materials Net Total Return | MSCI ACWI Select Metals & Mining Producers ex Gold & Silver IMI | S&P Metals & Mining Select Industry Index | EQM Lithium & Battery Technology Index |
| Holdings | 167 | 279 | 40 | 53 |
| Top 10 share of fund | 39.58% | 48.79% | 52.72% | 48.05% |
| Expense ratio | 0.65% | 0.39% | 0.35% | 0.59% |
| Net assets | US$490.63 million | US$2.44 billion | US$3,935.95 million | US$107.62 million |
| Launched | 1 February 2023 | 31 January 2012 | 19 June 2006 | 6 June 2018 |
| One-year total return | -9.11% | 29.83% | -6.68% | 6.00% |
Dates and sources: SETM, PICK and XME holdings counts and top-10 shares, the one-year return of all four funds, and (for SETM and PICK) assets are from StockAnalysis fund pages as of the 15 October 2026 close, with holdings updated 14 October 2026. XME assets and expense ratio are from the State Street fund page (14 October 2026; the 0.35% is the gross ratio). BATT assets, holdings, launch date and expense ratio are from the Amplify fund page (14 October 2026), and its top-10 share is the sum of the ten weights shown there on 15 October 2026. One-year return is total return to 15 October 2026 as reported by StockAnalysis, and past performance does not predict future results.
How we chose these funds
We looked for US-listed ETFs whose holdings are mostly miners or producers of metals on the US critical minerals list, and that are broad rather than tied to one metal. That excludes funds built around a single metal, which are covered on separate pages: see our lithium ETF list and our rare earth ETF list. The four funds are not ranked, and the table order is not a preference. A fund can be broad and still hold few critical minerals, as the XME section shows.
The criteria were: a US listing, more than one metal in the holdings, a published index, and holdings and fees readable on a dated public page. Funds listed outside the US, funds that write options on a metals basket and funds that hold physical metal were left out. The four funds are a selection, not a full census of every broad metals fund.
What counts as a critical mineral
The US Geological Survey (USGS) maintains the official US list. The final 2025 list names 60 minerals and added ten: boron, copper, lead, metallurgical coal, phosphate, potash, rhenium, silicon, silver and uranium (USGS, 14 November 2025). The USGS says the list will be updated at least every two years.
Chart
US net import reliance, selected critical minerals
Per cent of US apparent consumption met by net imports, 2025 estimate (rare earths: compounds and metals)
That matters for fund labels. Before the 2025 update, copper, silver and uranium were not on the list. A fund called “critical minerals” can now legitimately hold copper, silver and uranium miners, which is what the SETM top holdings show. The funds also differ because “critical” is a US government term, while each index provider sets its own rules for which companies count.
Dependence on imports is the reason these metals are on the list. The chart shows how much of US apparent consumption of selected metals came from imports in 2025, according to the USGS. Apparent consumption means production plus imports minus exports, adjusted for stock changes.
The 2025 figures are USGS estimates. The USGS puts net import reliance for graphite and manganese at 100% (graphite), for cobalt at 79% (cobalt) and for copper at 57% (copper). Import reliance says something about supply risk. It describes the US market and does not say anything about the return on a share.
▶ Explains what mining contributes to economies. · 5:03
What each fund holds
SETM: Sprott Critical Materials ETF
SETM launched on 1 February 2023 and follows a market-cap-weighted index of US and foreign companies selected on revenue from the materials. It held 167 companies on 14 October 2026. The largest were Freeport-McMoRan (5.68%), Cameco (5.10%), Lynas Rare Earths (4.37%), Kazatomprom (4.06%) and Teck Resources (3.71%), according to the StockAnalysis holdings list.
Chart
SETM top 25 holdings by main metal
Per cent of fund net assets held in each metal group (top 25 holdings only)
Grouping the top 25 holdings by their main metal (our grouping, from that list) gives a picture of the mix. Copper producers make up about 23% of the fund, uranium about 19%, lithium about 10%, silver about 9% and rare earths about 7%. The chart above shows the split. Other holdings, including gold-silver producers and diversified miners, are outside these five groups.
What to check: the fund holds companies listed in Canada, Australia, the United Kingdom and Poland, so currency moves and foreign tax rules affect results. It paid an annual dividend of US$0.45267 per share with an ex-dividend date of 18 December 2025.
PICK: iShares MSCI Global Metals & Mining Producers ETF
PICK follows a market-cap-weighted index of global metals and mining producers that excludes gold and silver miners. It held 279 companies on 14 October 2026 and had net assets of US$2.44 billion. BHP was 13.83% of the fund and Rio Tinto 8.91% across its London and Australian listings. Freeport-McMoRan (6.43%), Glencore (4.58%), Nucor (3.67%), Anglo American (3.66%) and Vale (3.11%) follow, per the StockAnalysis holdings list.
What to check: the holdings include steelmakers such as Nucor, ArcelorMittal, Steel Dynamics, Nippon Steel and POSCO, and iron ore producers such as Vale and Fortescue, which are not on the critical minerals list. The fund is “global metals and mining”, and copper, nickel and other critical metals are part of it rather than all of it. It pays distributions twice a year; the last ex-dividend date was 15 June 2026 at US$0.54228 per share.
XME: State Street SPDR S&P Metals & Mining ETF
XME follows the S&P Metals & Mining Select Industry Index. State Street lists NAV of US$99.90 per share and assets of US$3,935.95 million at 14 October 2026. StockAnalysis describes the index as equal-weighted and US-based, and shows 40 holdings, which is why the largest weights are close together: Cleveland-Cliffs 5.88%, Reliance 5.82%, Steel Dynamics 5.70%, Nucor 5.63% and Commercial Metals 5.35%. Freeport-McMoRan is 5.15%, Newmont 4.90% and Royal Gold 4.84% (StockAnalysis, 15 October 2026).
What to check: four steel producers (Cleveland-Cliffs, Steel Dynamics, Nucor, Commercial Metals) add up to 22.56% of the fund in that list, and gold and gold-royalty companies also appear in the top ten. XME is a US metals and mining fund first, and a critical minerals fund only in part. Its expense ratio of 0.35% is the lowest of the four, and it pays quarterly.
BATT: Amplify Lithium & Battery Technology ETF
BATT follows the EQM Lithium & Battery Technology Index with modified market-cap weights and a quarterly rebalance. Amplify’s allocation at 30 September 2026 was copper 23.26%, electric vehicles 18.70%, nickel 14.91%, battery technology 12.40% and lithium 7.89%, with cobalt at 4.27% and manganese at 1.86%. Top holdings on 15 October 2026 were Tesla (8.20%), BHP (7.11%), Freeport-McMoRan (6.43%), CATL (5.31%) and Bloom Energy (4.65%).
What to check: BATT mixes miners with battery makers and electric vehicle makers, so it behaves differently from a mining fund. It is the fund most tied to the battery supply chain and overlaps with lithium-specific funds, which we list separately.
Where the four funds overlap and where they differ
One company appears in the top ten of all four funds on the dates above: Freeport-McMoRan, a copper producer. It is 5.68% of SETM, 6.43% of PICK, 5.15% of XME and 6.43% of BATT. That single name is a reminder that these funds are not independent bets. All four funds hold copper producers, so copper share prices affect each of them.
Past that, the funds split by the type of exposure.
- Uranium and silver miners: these appear in the SETM list (Cameco, Kazatomprom, Hecla, First Majestic). XME also holds Uranium Energy (3.75%), Hecla (4.04%) and Coeur Mining (4.03%), outside its top ten. PICK leaves silver out by design.
- Rare earths: Lynas Rare Earths and MP Materials are in the SETM list. They are not in the top ten of the other three.
- Lithium: PLS, Albemarle and SQM are in the SETM list, and BATT holds lithium at 7.89% of assets by Amplify’s allocation.
- Steel: steelmakers appear in the PICK and XME top ten, not in SETM or BATT.
- Gold: Newmont and Royal Gold are in the XME top ten.
- Batteries and vehicles: Tesla, CATL and BYD sit in the BATT top ten.
So the answer to “which fund is the most critical minerals fund” depends on how you define the term. By index name, SETM refers to critical materials directly, and its top holdings include copper, uranium, lithium, silver and rare earth producers. By size and age, XME and PICK are the largest and oldest. By theme, BATT is the battery supply chain. These are descriptions of what the funds hold, not a view on which is better for a given portfolio.
Price history also differs, which is why a one-year return is not enough to compare them. The one-year total returns in the table run from -9.11% (SETM) to 29.83% (PICK) over the same dates, and the funds hold different mixes of metals and sectors. Three-year and five-year returns are on the issuer pages, for example Amplify’s BATT page, where 3-year annualised NAV return to 30 September 2026 is shown at 11.10% and the 5-year at -0.75%.
Fees, size and concentration
The expense ratio is the yearly fee taken from fund assets, shown as a percentage. A fee of 0.65% costs US$65 a year per US$10,000 invested, before brokerage commissions and the bid-ask spread. The Investor.gov ETF bulletin tells readers to compare fees and expenses and also to look at the median bid-ask spread and any premium or discount to net asset value that the fund publishes (Investor.gov, SEC staff).
Chart
Holdings count against top-10 concentration
Each dot is one fund, 14-15 October 2026
Chart
Net assets of the four funds
US$ million, 14-15 October 2026
Fund size affects how easily shares trade. The chart compares net assets on 14 October 2026.
Concentration is the other measure. A fund with 279 holdings can still have nearly half its value in ten names. The scatter chart plots the number of holdings against the top-10 share for the four funds: the fund with the most holdings (PICK) is not the least concentrated, because it is weighted by market value and BHP alone is 13.83%.
Fee calculator: what an expense ratio costs over time
The calculator below compares the yearly fee of two funds on the same amount. Enter your own amount and the two expense ratios from the table. It holds the balance constant, so it ignores growth, compounding, brokerage commissions and spreads.
Calculator
What does an expense ratio cost per year?
Enter your own amount and the two expense ratios to compare.
- Yearly fee, fund B: $35
- Difference per year: $30
- Difference over the years held: $300
Example values only, not a recommendation. Defaults are the SETM (0.65%) and XME (0.35%) ratios from the table above. The result holds the balance constant and leaves out growth, compounding, brokerage commissions and bid-ask spreads. Expense ratios change; check the fund page.
How to check a critical minerals ETF in 6 steps
- Read the index rule. The fund page names the index and its provider. Look for how companies qualify (a revenue share from the metals, a sector label or a market-cap screen).
- Open the full holdings file. Issuer pages publish the holdings. Count how many are miners of metals on the USGS list, and how many are steel, battery or vehicle makers.
- Check the top-10 weight. If ten names hold half the fund, a problem at one company moves the whole fund.
- Compare the expense ratio. Use the net ratio on the fund page, and note whether a fee waiver applies.
- Look at size and trading. Net assets, average volume and the median bid-ask spread show how costly it is to buy and sell.
- Read the prospectus. It sets out risks, how the index is rebalanced and how distributions are taxed. Investor.gov notes that the ETF website also shows premiums and discounts to NAV.
Risks that come with metals and mining funds
Metal prices swing. Prices for lithium, cobalt, copper and uranium move with demand, mine supply and policy. The USGS data in the chart above show how far some of these markets lean on imports, and trade rules can change fast.
Single-sector funds are more volatile than diversified funds. State Street’s own risk notice for XME says sector funds can be more volatile than broadly diversified funds and may trade at discounts in periods of market stress. Foreign listings add currency and tax effects. Index rules change too: BATT rebalances quarterly (Amplify), so the holdings in this article will differ in a few months.
What sits behind the shares
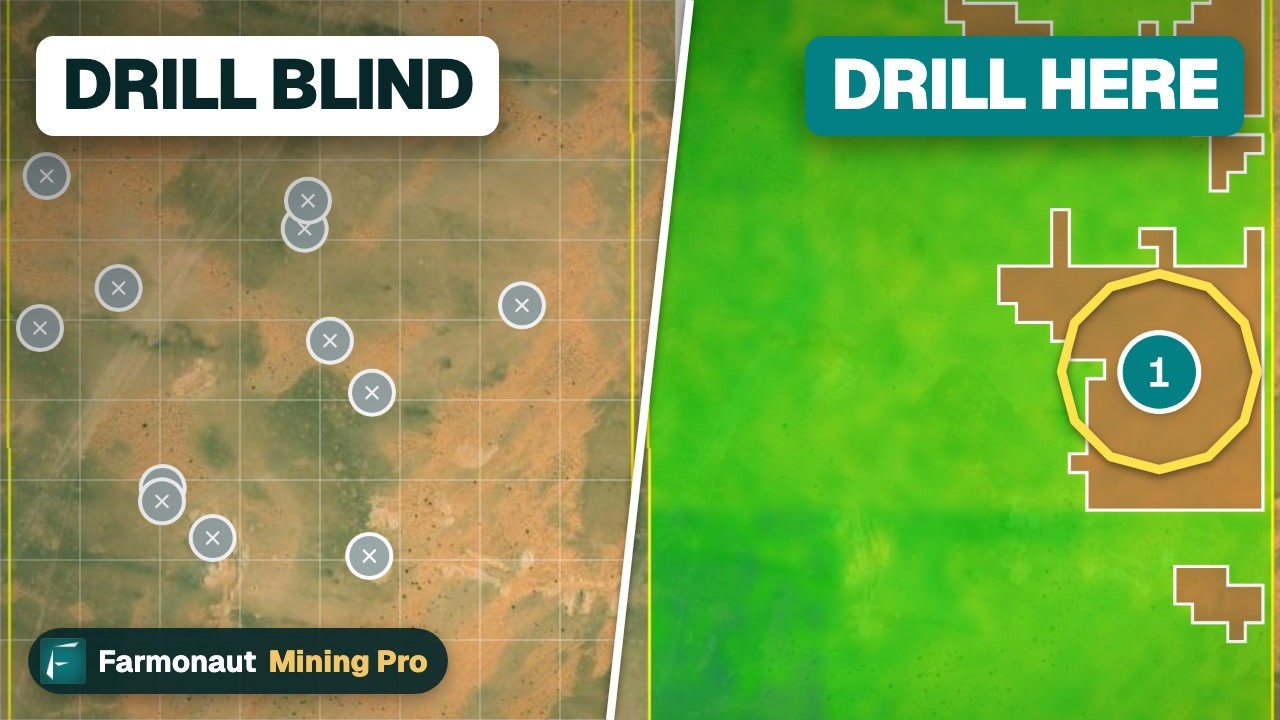
Every holding is a company with mines and projects. Whether a project can be built depends on grade, permits, power, water and cost, which a fund page does not show. Satellite imagery is one way exploration teams screen land for mineral targets before drilling. Farmonaut offers satellite mineral screening as an exploration target service, ahead of any resource estimate.
For a view on how exploration spending and listings fit together, see our pieces on mineral exploration spending in Canada and TSX, TSXV and CSE listing rules for miners, and our longer look at critical minerals ETF trends. If you hold a mineral licence and want to see what satellite data shows over it, use the quote form; for the method, see satellite-based mineral detection, or contact the team.
▶ Shows how satellite data is used to screen ground for mineral targets before drilling. · 4:26
For a closer look at a related question, see our guide: George Soros Uranium Holdings: What His 13F Shows.
If this topic matters to you, read Best Minerals to Invest In: 6 Compared With Data next.
Frequently asked questions
What is a critical minerals ETF?
It is an ETF that holds shares of companies producing or processing minerals that a government treats as critical. In the US that means the USGS list of 60 minerals. There is no single legal definition for the fund type, so each fund’s index rules decide what it holds.
Which ETFs are broad critical minerals funds?
This page compares SETM, PICK, XME and BATT. SETM is the one whose name and index refer to critical materials directly. The others are metals and mining or battery funds that hold many critical-mineral producers.
Which of these funds has the lowest expense ratio?
XME at 0.35% (gross, State Street, 14 October 2026), then PICK at 0.39%, BATT at 0.59% and SETM at 0.65%. The holdings of the four funds differ.
Are copper, silver and uranium critical minerals?
Yes, on the US list. The USGS added copper, silver and uranium, together with seven other minerals, in the final 2025 list.
Does PICK hold gold or silver miners?
No. Its index excludes gold and silver miners. XME does hold gold and gold-royalty companies, and SETM holds silver miners such as Hecla and First Majestic.
Why do the funds hold steel companies?
PICK and XME track metals and mining sectors, which include steel producers. Steel is not on the critical minerals list, so a share of these funds is not critical-mineral exposure.
Do these funds pay dividends?
Yes, at different intervals. SETM paid US$0.45267 per share on an ex-date of 18 December 2025 and PICK US$0.54228 on 15 June 2026. XME pays quarterly, most recently US$0.07284 with an ex-date of 21 September 2026 (StockAnalysis, 15 October 2026). Past payments do not set future ones.
What is the difference between price and NAV?
NAV is the value of the fund’s assets minus liabilities, divided by shares outstanding, calculated each business day. The market price can be above or below it, called a premium or discount (Investor.gov).
Where can I find current holdings?
On the issuer’s fund page. The sources used here are the State Street XME page and the Amplify BATT page, while holdings data for SETM and PICK come from StockAnalysis because StockAnalysis republishes the daily holdings of these two funds.
How do lithium and rare earth ETFs differ from these?
They are built around one group of metals. Our lithium ETF and rare earth ETF pages cover them.
Can satellite data help me judge a mining company?
Satellite data does not replace company filings. It can show land cover, rock alteration and access around a project, which helps frame questions for a company’s technical report. Farmonaut results are exploration targets, not resource estimates.
This page is for information only. It is not investment advice. It names funds and companies as facts, with dates, and does not recommend buying or selling any of them. Fees, holdings and assets change; check each fund’s current page and prospectus before deciding anything.
Farmonaut mining
See what satellites show over a mineral project
Farmonaut screens land for mineral exploration targets from satellite data, ahead of any resource estimate.

Mining Pro sample view, synthetic data
Keep reading


Sources
- USGS, Interior Department releases final 2025 List of Critical Minerals (14 Nov 2025): usgs.gov
- Investor.gov (SEC staff), Updated Investor Bulletin: Exchange-Traded Funds: investor.gov
- USGS, Mineral Commodity Summaries 2026: Graphite: pubs.usgs.gov
- USGS, Mineral Commodity Summaries 2026: Cobalt: pubs.usgs.gov
- USGS, Mineral Commodity Summaries 2026: Copper: pubs.usgs.gov
- USGS, Mineral Commodity Summaries 2026: Manganese: pubs.usgs.gov
- USGS, Mineral Commodity Summaries 2026: Silver: pubs.usgs.gov
- USGS, Mineral Commodity Summaries 2026: Rare earths: pubs.usgs.gov
- USGS, Mineral Commodity Summaries 2026: Nickel: pubs.usgs.gov
- State Street, SPDR S&P Metals & Mining ETF (XME) fund page (14 Oct 2026): ssga.com
- Amplify ETFs, BATT fund page (14-15 Oct 2026): amplifyetfs.com
- StockAnalysis, Sprott Critical Materials ETF (SETM) overview (15 Oct 2026): stockanalysis.com
- StockAnalysis, SETM holdings list (14 Oct 2026): stockanalysis.com
- StockAnalysis, iShares MSCI Global Metals & Mining Producers ETF (PICK) overview (15 Oct 2026): stockanalysis.com
- StockAnalysis, PICK holdings list (14 Oct 2026): stockanalysis.com
- StockAnalysis, State Street SPDR S&P Metals & Mining ETF (XME) overview (15 Oct 2026): stockanalysis.com
- StockAnalysis, Amplify Lithium & Battery Technology ETF (BATT) overview (15 Oct 2026): stockanalysis.com
Discussion
Questions, corrections or field experience? Share them below. First-time comments are reviewed before they appear, and your email is never published.
No comments yet. Be the first to add a question or your experience.

 African Venture Partners Holding
 Congo Mining Solutions
 Mining SARL
 SenGold Invest SAS
 Sania Corporation
 Sean Mining Limited
 NTS Group (Pty) Ltd
 Mine4Africa
 Lithspo Minerals Limited
 Tintina Mining Group
 Dalgety Minerals Pty Ltd
 Vortex Minerals Pty Ltd
 Faith At Work (Pty) Ltd
 Geotech Mining Solutions plc
 Vulcan International Limited
 Kidepo Associates
 GKY Mining
 Alkimy SARL
 Double A Trading
 GemSprout Metals Limited











