

Farm finance · Dated rate comparison
Farmland Loan Rates: FSA vs Bank, Farm Credit, Farmer Mac
The USDA Farm Service Agency charges 6.250% on direct farm ownership loans in October 2026, while Federal Reserve district surveys put bank farm real estate loans at about 6.7% to 7.1%. Here is how FSA, banks, Farm Credit and Farmer Mac compare, with dated sources.
Key takeaways
- FSA direct rates for October 2026: ownership 6.250%, joint financing 4.250%, down payment 2.250%, operating 5.375% (FSA release, 1 Oct 2026).
- The FSA ownership rate rose a quarter point from 6.000% in July and September 2026.
- On $750,000 over 25 years, 6.25% vs 7.1% is about $4,900 a year in payments.
- Farm Credit and Farmer Mac publish no national farmland rate; FSA guarantees bank farm loans up to 95% and up to $2,558,000.
- On $750,000 over 25 years, 6.25% vs 7.1% is about $4,900 a year in payments.
In this article
- Farmland loan rates at a glance
- How we checked the numbers
- USDA FSA direct loans: the published rates
- Commercial bank farmland loan rates
- Farm Credit System farmland loans
- FSA guaranteed loans and Farmer Mac
- FSA vs bank farmland loan rates compared
- What sets the rate you are offered
- Payment calculator: compare two farmland loan rates
- How to compare farmland loan offers in 6 steps
- What lenders ask you to bring
- Farmland lease rates are a different market
- Interest, taxes and tracking rates
- FAQ
Farmland loan rates in October 2026 start at 6.250% for a direct farm ownership loan from the USDA Farm Service Agency, according to the FSA October 2026 lending rates release. Commercial farm real estate loans cost more: lender surveys put them between about 6.7% and 7.1% in the Corn Belt. This page sets FSA, Farm Credit, bank and Farmer Mac financing side by side, with dates and sources for every number.
All rates here are published or survey averages, not quotes. Your own rate depends on your credit, down payment, the land and the lender. Use the tables and the payment calculator to see what a gap of half a point or a full point means on a real purchase, then take the numbers to your lender.
Farmland loan rates at a glance
The table lists the four main sources of money for buying farmland in the United States. Each row gives the latest rate we could find, the date of that rate and what kind of number it is. A published rate is the rate the lender charges every eligible borrower that month. A survey average is what banks reported charging, on average, in one Federal Reserve district.
| Lender type | Product | Rate | Date and basis |
|---|---|---|---|
| USDA FSA direct | Farm ownership loan | 6.250% | October 2026, published rate (FSA) |
| USDA FSA direct | Joint financing ownership loan | 4.250% | October 2026, published rate (FSA) |
| USDA FSA direct | Down payment loan | 2.250% | October 2026, published rate (FSA) |
| USDA FSA direct | Farm operating loan | 5.375% | October 2026, published rate (FSA) |
| Commercial bank | Fixed farm real estate loan, Minneapolis district | 7.07% | Q2 2026, survey average (Ag Proud summary of Fed surveys) |
| Commercial bank | Variable farm real estate loan, Chicago district | 6.79% | Q2 2026, survey average (same) |
| Commercial bank | Fixed farm real estate loan, Chicago district | 6.7% | Q1 2026, survey average (farmdoc daily) |
| Commercial bank | Fixed farm real estate loan, St. Louis district | 7.1% | Q1 2026, survey average (farmdoc daily) |
| Farm Credit System | Real estate mortgage | Not published | Quoted per borrower by each association |
| FSA guaranteed / Farmer Mac | Bank loan with guarantee or sold on | Set by lender | FSA caps guaranteed rates; Farmer Mac buys loans |
The short version: the FSA direct ownership rate sits about half a point to more than one point below the bank survey averages. The joint financing and down payment rates are far lower, but they cover only part of the price and come with strict rules.
How we checked the numbers
We took FSA rates only from FSA’s own monthly news releases, which give the rate for each direct loan product and the date it takes effect. For banks we used the Federal Reserve district lender surveys. University of Illinois farmdoc daily reports the Chicago and St. Louis district surveys; its review of agricultural credit conditions in Illinois in the first quarter of 2026 gives fixed farm real estate loan rates. For the second quarter of 2026 we used a trade summary of the district surveys from Ag Proud. Farm Credit associations and Farmer Mac do not publish one national rate, so we explain how they price loans instead of printing a number that would not apply to you.
We did not use lender ads, rate-comparison sites or “as low as” offers. Those show the best case for the best borrower. We also kept loan types apart. An operating loan for seed and fuel is priced differently from a 30-year mortgage on land, so we never compare one with the other.
USDA FSA direct loans: the published rates
FSA lends its own money through direct loans and resets the rates at the start of each month. The rates for October 2026, effective October 1, are:
- Farm operating loans (direct): 5.375%
- Farm ownership loans (direct): 6.250%
- Ownership loans, joint financing: 4.250%
- Down payment ownership loans: 2.250%
- Emergency loans (actual loss): 3.750%
- Commodity loans under one year: 5.250%
- Farm storage facility loans, three-year term: 4.500%
Rates went up this autumn. In the FSA September 2026 rate release the direct ownership rate was 6.000% and the operating rate 5.250%. In July the ownership rate was also 6.000% and the operating rate 5.125%, per the FSA July 2026 rate release. So the October move was a quarter point on ownership loans in one month.
What the FSA products are for
Direct ownership loans pay for land, buildings and major improvements. Joint financing means FSA lends part of the price and a commercial lender lends the rest; the FSA part carries the low rate. Down payment loans help beginning and some underserved farmers cover part of a down payment; the buyer still puts in cash and the rest is financed. Operating loans cover a season’s costs, livestock and equipment, not land.
Best for: farmers who cannot get a commercial loan on reasonable terms, beginning farmers and buyers who can use joint financing to blend a lower rate into the deal. FSA direct loans have eligibility rules and loan limits, so ask your local USDA Service Center what you qualify for before you plan around these rates.
Chart
FSA direct loan rates, October 2026
Published interest rate by loan product, effective 1 October 2026
Commercial bank farmland loan rates
Banks set their own rates. The best public guide is the quarterly survey that several Federal Reserve banks run among agricultural lenders. In the second quarter of 2026, rates in the surveyed districts ranged from 6.79% for variable-rate real estate loans in the Chicago district to 7.9% for variable-rate operating loans in the Dallas district, according to Ag Proud’s summary of the Q2 2026 district reports. In the Minneapolis district, fixed-rate real estate loans rose to 7.07% from 6.8% in the first quarter.
Chart
FSA direct ownership and operating rates
Published rate, %, selected months of 2026
The Chicago and St. Louis district surveys give a fixed-rate view. In the first quarter of 2026, fixed farm real estate loans averaged 6.7% in the Chicago district, down from 7.1% a year earlier, and 7.1% in the St. Louis district, down from 7.6% a year earlier, according to farmdoc daily. Rates are below their 2023 peaks but still high by pre-COVID standards.
Best for: buyers who want speed, a local relationship and a loan that also covers non-farm needs. Banks can also offer FSA guaranteed loans, which we cover below.
Farm Credit System farmland loans
The Farm Credit System is a network of borrower-owned lenders that focus on agriculture and rural areas. It is large. In 2025 the System made 310,821 loans worth $150.2 billion, and it had $429.3 billion in loans outstanding at the end of the year, according to the Farm Credit Administration report on young, beginning and small farmer lending. Of the loans made in 2025, 175,068 went to young, beginning or small farmers.
Farm Credit associations do not publish one national farmland rate. Each association quotes a rate for each borrower, often with a choice of fixed and variable periods. Because they are cooperatives, many pay part of their profit back to borrowers each year (a patronage refund), which lowers the real cost below the quoted rate. Ask any Farm Credit lender how much patronage it paid in recent years and how it is paid out.
Best for: full-time and larger operations, long fixed-rate terms and borrowers who value a lender that only does agriculture.
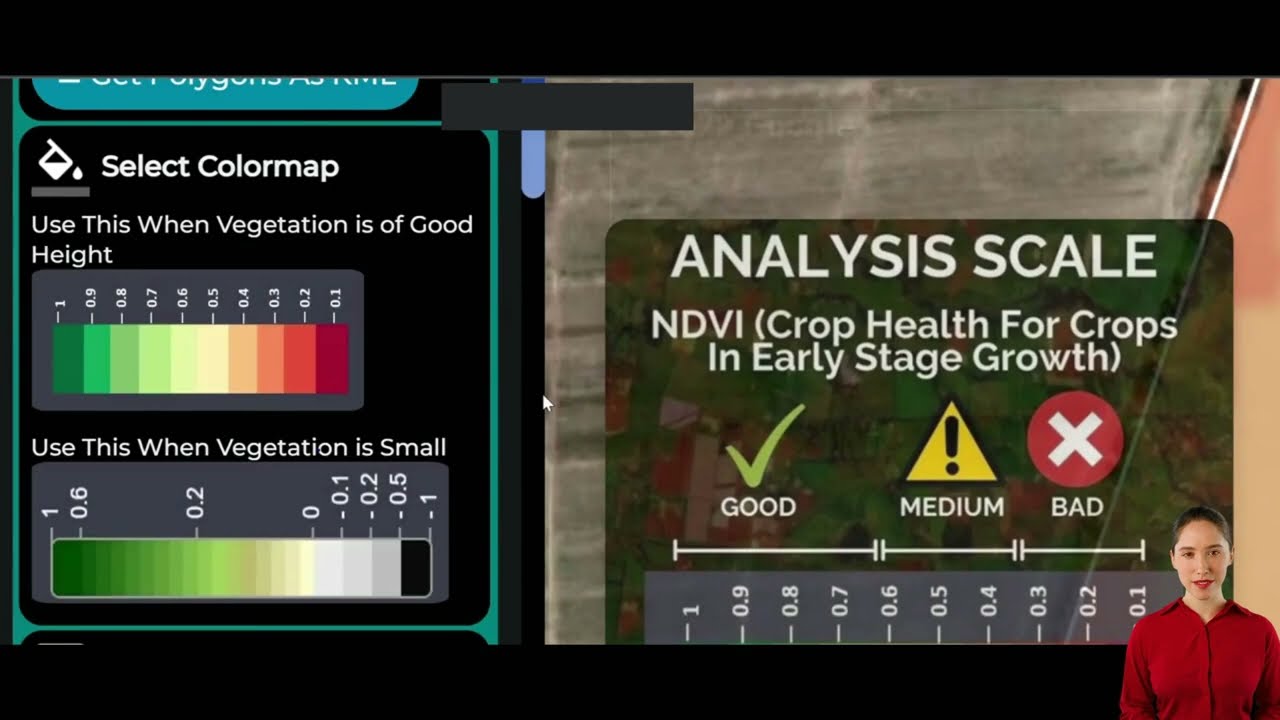
▶ A tour of Farmonaut’s web app and how to read satellite crop data for your fields. · 10:16
FSA guaranteed loans and Farmer Mac
Two programmes sit behind many commercial farmland loans without the borrower always seeing them.
FSA guaranteed loans. A bank or Farm Credit lender makes the loan and sets the rate, and FSA guarantees up to 95% of the loss of principal and interest. FSA can guarantee farm loans up to $2,558,000, according to its guaranteed farm loans page. The guarantee lowers the lender’s risk, which can help a borrower who would not qualify alone. The rate is negotiated with the lender, within limits FSA sets.
Farmer Mac. The Federal Agricultural Mortgage Corporation was created in 1988. It runs a secondary market for agricultural real estate mortgages, rural housing loans, rural cooperative loans and USDA-guaranteed farm and rural development loans, as described by its regulator on the Farm Credit Administration’s Farmer Mac page. Farmer Mac does not lend to farmers directly. It buys qualifying loans from lenders, which lets banks offer long fixed-rate terms they might not keep on their own books.
Best for: bank customers who want a long fixed rate (ask if the loan can be sold to Farmer Mac) and borrowers who are a little short of a lender’s standards (ask about an FSA guarantee).
Questions to ask your lender about these programmes: Will this loan carry an FSA guarantee, and does the guarantee fee change my cost? Can the loan be sold to Farmer Mac, and does that let you offer a longer fixed rate? If rates fall, can I refinance, and what penalty applies? Written answers make it much easier to compare a bank offer with a Farm Credit or FSA offer on equal terms.
FSA vs bank farmland loan rates compared
Here is how the main options line up for a buyer. The rates are from the sources above; the other rows describe how each lender usually works.
Chart
FSA direct ownership rate vs bank survey averages
Interest rate, %; FSA published rate (Oct 2026) and bank fixed farm real estate survey averages
| Feature | FSA direct | Bank | Farm Credit |
|---|---|---|---|
| Rate basis | Published monthly | Quoted per borrower | Quoted per borrower |
| Latest guide | 6.250% (Oct 2026) | About 6.7% to 7.1% (surveys) | No national figure |
| Who qualifies | Must meet FSA rules | Lender’s credit standards | Lender’s credit standards |
| Speed | Slower, more paperwork | Often fastest | Varies |
| Extras | Joint financing, down payment loans | FSA guarantee, Farmer Mac sale | Patronage refunds |
The gap matters most on large, long loans. On a $750,000 loan paid yearly over 25 years, 6.25% costs about $60,100 a year. At 7.1% it costs about $64,900 a year. That is roughly $4,900 a year, or about $122,000 over the life of the loan, before fees. Run your own numbers in the calculator below.
What sets the rate you are offered
Every lender builds a farmland rate from the same parts:
- Cost of funds. FSA rates follow the government’s own borrowing cost. Bank and Farm Credit rates follow wider credit markets and Federal Reserve policy.
- Risk premium. Lenders add a margin for your credit history, the farm’s income and their own risk. This is why two farms in one county can get different quotes.
- Term and rate type. Long fixed terms usually cost more than short or variable ones, because the lender carries the rate risk.
- Down payment. A bigger down payment means a lower loan-to-value ratio and less risk for the lender.
- The land itself. Soil quality, water rights, access and buildings shape the appraisal, and the appraisal shapes the loan.
Land prices also matter because they set the size of the loan. US farm real estate averaged $4,500 an acre in 2026, up 3.4% on 2025, and cropland averaged $6,020 an acre, according to the USDA NASS Land Values 2026 Summary. Pasture averaged $2,000 an acre.
Payment calculator: compare two farmland loan rates
Enter a loan amount, a term and two rates, for example an FSA direct rate and a bank quote. The calculator shows the yearly payment at each rate and the total extra cost of the higher one. The starting values are examples only.
Try the numbers for your own farm below.
Calculator
What does a higher farmland loan rate cost you?
Enter your loan, term and two rates.
- Yearly payment at lower rate: $60,071
- Yearly payment at higher rate: $61,486
- Extra per year: $1,415
Example values only, not a quote or an offer. Assumes a fixed rate and equal yearly payments over the full term; ignores fees, insurance, taxes and rate changes. Rates come from your lender. This is general information, not financial advice.
How to compare farmland loan offers in 6 steps
- Check FSA first. Ask your local USDA Service Center whether you qualify for a direct, joint financing or down payment loan. Even if you do not, ask about a guaranteed loan.
- Get at least three quotes. Ask a local bank, a Farm Credit association and one more lender for written terms on the same loan amount and term.
- Compare like with like. Line up the rate type (fixed or variable), the fixed period, the term, fees and any prepayment penalty.
- Ask about patronage. For Farm Credit, ask how much was returned to borrowers in recent years and whether it is cash or stock.
- Test the payment. Use the calculator to see the yearly payment and check it against a cautious farm income plan, not your best year.
- Get advice. Have an agricultural lender, accountant or attorney review the offer before you sign.
This page gives general information, not financial or legal advice. Rates, rules and eligibility change, so check the current figures with the lender and get professional advice for your own situation.
What lenders ask you to bring
FSA, banks and Farm Credit lenders ask for much the same paperwork:
- Balance sheet, income statements and tax returns for recent years
- A cash flow plan for the farm, with crops, livestock and costs
- A schedule of current debts
- A legal description of the land: acres, soil, water rights and buildings
- Yield or production history
- An appraisal, usually ordered by the lender
Clear field records help here. A field boundary and a history of crop health can back up the yield history you give the lender. Farmonaut Satellite + AI Farm Monitoring System keeps satellite crop maps for each field you draw, which can support that record. The final rate and terms are still the lender’s decision.
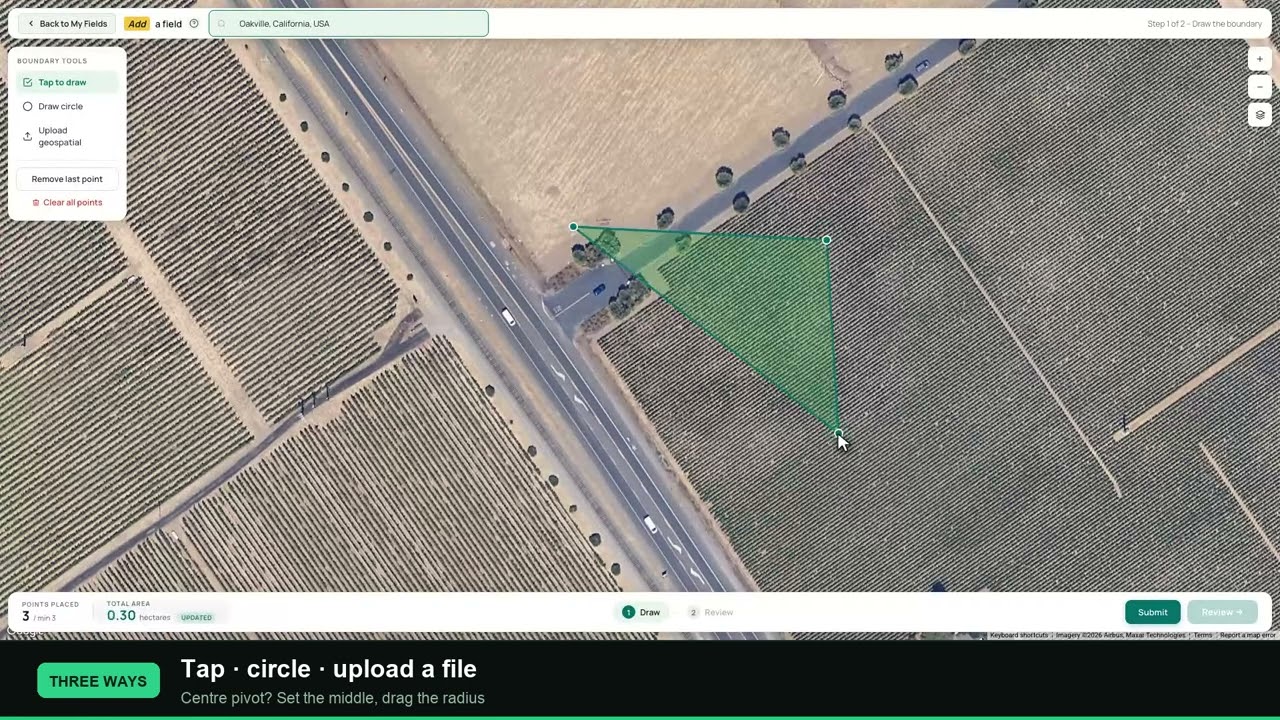
▶ How to draw or upload a field boundary, the first step to keeping satellite records for each field. · 2:21
Farmland lease rates are a different market
Renting land is the main alternative to buying it, but cash rent is not an interest rate. It is a payment per acre set by local land productivity, crop prices and demand from other farmers. USDA NASS publishes county cash rents each year.
As an example from the Corn Belt, the average cash rent for cropland in Illinois was $261 an acre in 2026, down from $264 in 2025 and $269 in 2024, according to farmdoc daily’s review of Illinois cash rents. The authors note that tight margins have pushed rents down, and a mid-year survey of farm managers expected slight further declines for 2027.
- Cash rent: a fixed payment per acre; easy to budget but the tenant carries the price and yield risk.
- Crop share: the owner takes a share of the crop and some costs; risk is shared.
- Flexible rent: a base rent plus a bonus tied to price or yield, agreed in the lease.
To compare renting with buying, set the yearly loan payment per acre from the calculator against local cash rent. Remember that owners also pay property tax and build equity, and renters keep their cash free for machinery and inputs.
Chart
Average cash rent for Illinois cropland
US dollars per acre, USDA NASS averages
Interest, taxes and tracking rates
Interest on a loan used in your farming business is generally a deductible farm expense, as explained in IRS Publication 225, Farmer’s Tax Guide. The rules on prepaid interest and loans used for both farm and personal purposes are detailed, so ask a tax adviser how they apply to you.
To keep these numbers fresh:
- FSA direct rates: FSA posts a new release at the start of each month. Search its news page for the current month’s lending rates.
- Bank rate surveys: the Chicago, Kansas City, Minneapolis, Dallas and St. Louis Federal Reserve banks publish quarterly agricultural credit surveys.
- Land values and rents: USDA NASS publishes land values each summer and county cash rents each year.
Related pages on our site: loan options to buy farm land, farm land loans in Texas, crop loan and insurance verification, carbon footprinting, fleet management, product traceability, API developer docs and the agro admin app.

▶ The Farmonaut Agro Admin app for managing large farms and field teams. · 7:27
FAQ
What is the USDA farm ownership loan rate right now?
For October 2026, the FSA direct farm ownership loan rate is 6.250% and the direct operating loan rate is 5.375%. FSA resets rates each month, so check the latest release before you apply.
Are FSA loans always cheaper than bank loans?
The published FSA direct rate has been below the bank survey averages we found, but not every buyer qualifies, and FSA loans have limits. A bank or Farm Credit loan with patronage refunds or an FSA guarantee may be the better deal for you.
Does Farm Credit publish its farmland loan rates?
No single national rate is published. Each Farm Credit association quotes rates per borrower and many pay patronage refunds that lower the net cost.
What does Farmer Mac do for farmland buyers?
Farmer Mac buys qualifying farm real estate loans from lenders. This helps banks offer long fixed-rate loans. You apply through your lender, not to Farmer Mac.
Is cash rent the same as a lease interest rate?
No. Cash rent is a payment per acre set by the local land market. Compare it with the yearly loan payment per acre when you weigh renting against buying.
Farmonaut crop monitoring
Keep a satellite record of every field
Draw your fields once and Farmonaut shows satellite crop health maps for them through the season, on web, Android or iOS.




Sources
- USDA FSA, USDA Announces October 2026 Lending Rates for Agricultural Producers (1 Oct 2026): fsa.usda.gov
- USDA FSA, USDA Announces September 2026 Lending Rates for Agricultural Producers (1 Sep 2026): fsa.usda.gov
- USDA FSA, USDA Announces July 2026 Lending Rates for Agricultural Producers (1 Jul 2026): fsa.usda.gov
- USDA FSA, Guaranteed Farm Loans: fsa.usda.gov
- farmdoc daily, Agricultural Credit Conditions in Illinois: First Quarter 2026 (June 2026): farmdocdaily.illinois.edu
- Ag Proud, Interest rates largely unchanged in Q2 reports (2026): agproud.com
- Farm Credit Administration, FCA board receives 2025 annual report on the Farm Credit System’s young, beginning and small farmer mission performance: fca.gov
- Farm Credit Administration, About Farmer Mac: fca.gov
- USDA NASS, Land Values 2026 Summary (31 Jul 2026): nass.usda.gov
- farmdoc daily, Illinois Cash Rents in 2026 and Outlook for 2027 (15 Sep 2026): farmdocdaily.illinois.edu
- IRS, Publication 225 (2025), Farmer’s Tax Guide: irs.gov
Discussion
Questions, corrections or field experience? Share them below. First-time comments are reviewed before they appear, and your email is never published.
No comments yet. Be the first to add a question or your experience.

 Krishify
 TVS Electronics
 BW Pipelines
 WICO
 Gen Chayat
 Chimera Innovation
 SkyHarvest
 Polaris Digitech
 Teledarbas
 Wild Oak Farm
 SFX
 BACF Africa
 Doodlakine
 Exurbia Geospatial
 FieldZero

 Licence holder · Niger · Gold










