

Real Estate Farming Tools: Land Value Data & Reform Guide
Reviewed August 2026 against USDA NASS (Land Values and Cash Rents; Tenure, Ownership, and Transition Survey) and USDA Farm Service Agency Conservation Reserve Program data.
Try it: Enter your numbers above to compare. →
“Real estate farming” tools are the data feeds, calculators, and monitoring platforms that real estate agents, landowners, and investors use to price farmland, forecast rental income, and plan land transfers. The starting numbers: US average farm real estate value hit $4,170 per acre in 2024, cropland alone averaged $5,570 per acre, and 348 million acres of US farmland — 79% of it owned by landlords who don’t farm it themselves — are currently rented out, according to USDA’s National Agricultural Statistics Service (NASS). This guide walks through what those numbers mean for agents working farm listings, for investors evaluating rented ground, and for families navigating a land transfer, and it includes a calculator you can run against your own acreage.
Introduction: What “Real Estate Farming Tools” Actually Cover
In real estate, “farming” a market usually means systematically prospecting a defined geography for listings. Applied to actual farmland, that geography is a rural county or set of townships, and the “listings” are parcels whose value depends on soil class, water rights, lease status, and government program enrollment — none of which show up in a standard MLS comp. Real estate farming tools for agricultural land therefore need to do three things a residential CMA doesn’t: track publicly reported land-value benchmarks, monitor which parcels are rented versus owner-operated, and flag land nearing a generational transfer, since ownership change is one of the most reliable predictors of a farm parcel coming to market.

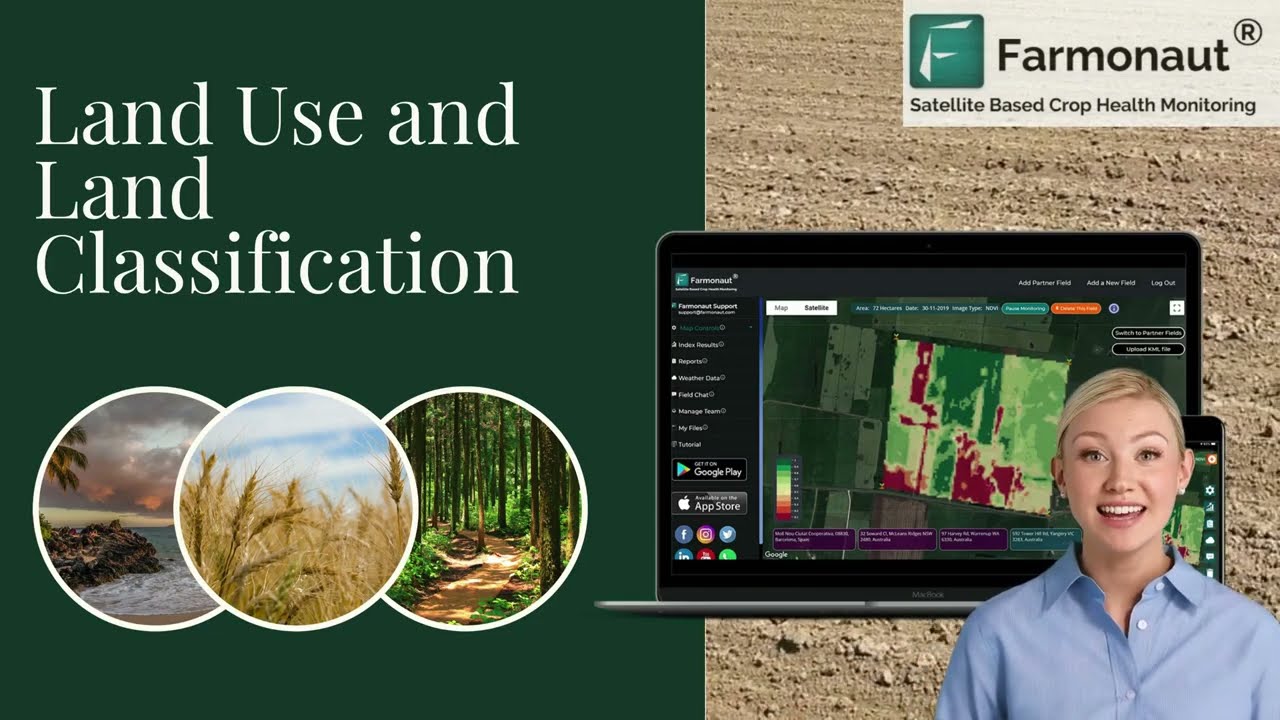
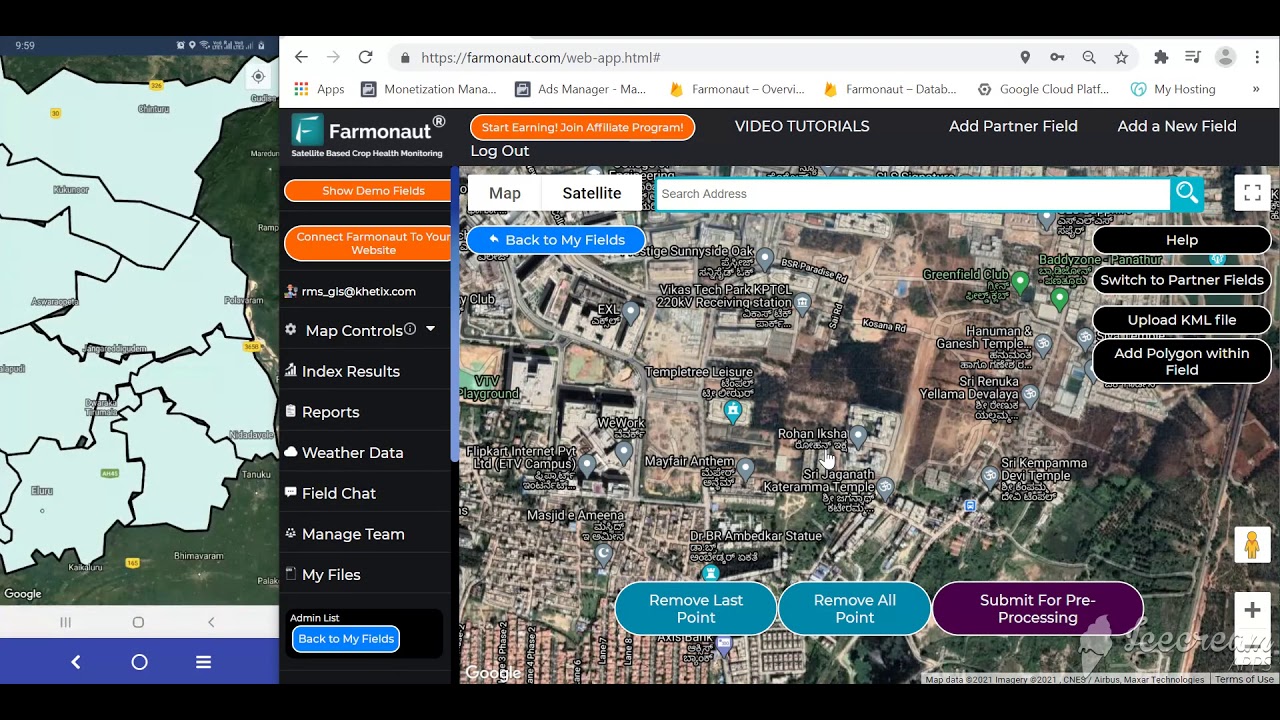
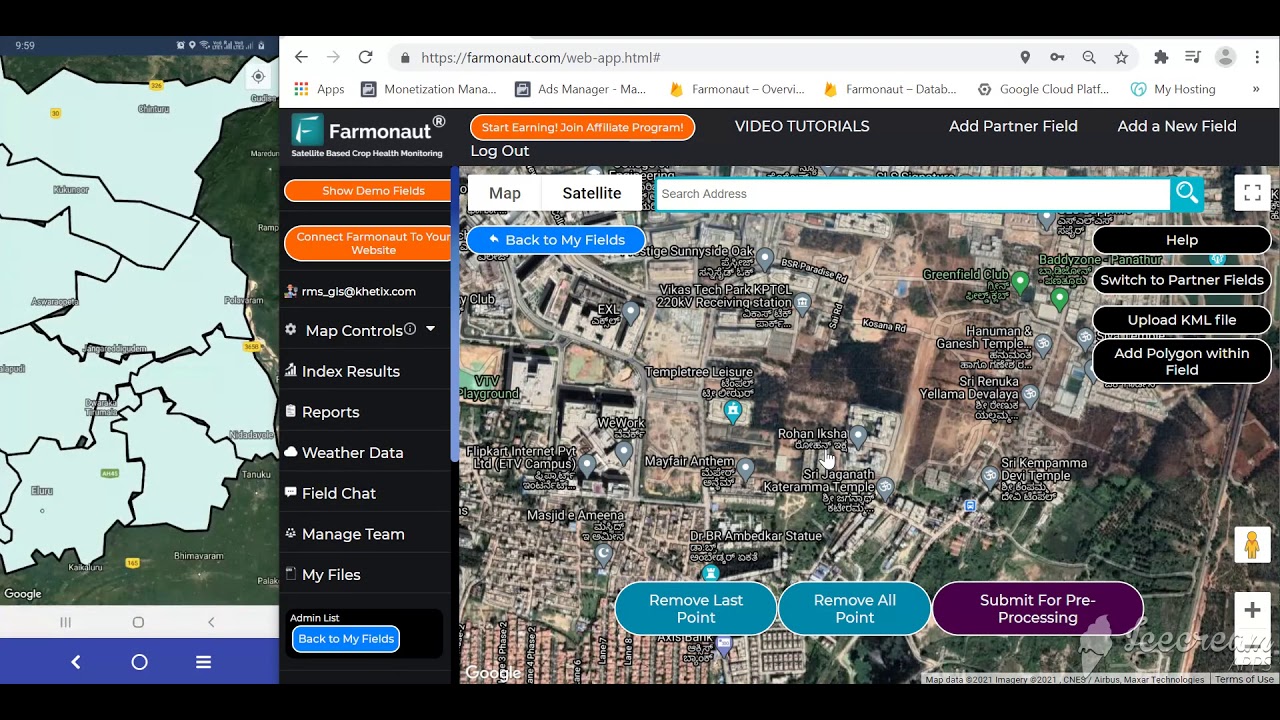
Open Farmonaut’s Web App to monitor a parcel’s crop health and soil signal before you list or buy it.
US Farmland Values: The Numbers Behind Every Listing
USDA NASS publishes the only nationally consistent farmland benchmark, and the 2024 figures set the baseline every farm real estate tool should be checking listings against. Average US farm real estate value — which blends cropland, pasture, and associated buildings — reached $4,170 per acre in 2024, up 5.0% from 2023, per the USDA NASS 2025 Land Values and Cash Rents summary. Break that composite figure apart and the spread is wide: cropland averaged $5,570 per acre in 2024, while pastureland averaged just $1,830 per acre, a roughly 3-to-1 ratio that any agent pricing a mixed-use parcel needs to apply line by line rather than blending into one number.
These are national averages, not comps for any specific county — NASS’s full report breaks values down by state, and state-level cropland can run several multiples of the pastureland figure above depending on irrigation access and commodity mix. NASS republishes this report annually, in August, at nass.usda.gov/Publications/Highlights; before quoting a value to a client, pull the current-year edition rather than reusing the 2024 figures above, since the year-over-year change itself (5.0% in the most recent release) tells you whether the market you’re farming is still appreciating at that pace or has slowed.
Why the Composite Number Misleads Agents
- ✔ Cropland vs. pasture spread: $5,570 vs. $1,830 per acre in 2024 — treating a parcel as “farmland” without specifying which type under- or over-prices it by thousands per acre.
- ✔ Year-over-year context: the 5.0% national increase from 2023 to 2024 is itself a data point worth quoting to clients deciding whether to sell now or hold.
- ⚠ State variation not shown above: the national averages hide state-by-state differences; always pull the state table in the NASS PDF before pricing a specific parcel.
- ✔ Buildings matter: “farm real estate value” includes structures, while “cropland value” and “pastureland value” are bare-land figures — know which one a client is asking about.
Farming Neighborhoods: Reading Local Land Markets
“Farming” a neighborhood in real estate means building repeat familiarity with a defined area’s inventory, ownership patterns, and turnover triggers. In agricultural land, the equivalent unit isn’t a subdivision — it’s a set of townships or a county’s rented-land base, and the single most useful indicator of upcoming inventory is how much of that land is rented rather than owner-operated. Nationally, 348 million acres of US farmland were rented out in 2024, and landlords who don’t farm themselves — non-operator landlords — own 79% of that rented acreage, per NASS’s 2024 Tenure, Ownership, and Transition (TOTAL) Survey.
That combination matters for anyone farming a rural market: land controlled by a non-operating landlord changes hands through a different process than owner-operated ground, usually a sale of the underlying fee title with the tenant’s lease surviving the closing, or a landlord-initiated listing once the lease term ends. The rented parcels in a given neighborhood, not the owner-farmed ones, are where most transactional opportunity sits — and their landlords are reachable by mail or through the tenant of record, not by canvassing the operator actually driving the tractor.
What the Rented-Land Base Tells You
- ✔ 348 million acres of US farmland are rented out (2024, NASS TOTAL Survey) — that acreage, not owner-operated ground, is where non-owner-occupant sales originate.
- ✔ 79% of that rented acreage is owned by non-operating landlords, meaning the person deciding whether to sell is very often not the person you’d meet standing in the field.
- ✔ $1.6 trillion — the total value of rented farmland including buildings in 2024, per NASS — is the scale of the asset base agents “farming” rural land are ultimately prospecting within.
- ⚠ State and county detail is not yet published: NASS’s TOTAL Survey summary at the national level doesn’t break the 79% figure out by state; the source notes detailed state tables were not available online as of March 2026 — check the NASS TOTAL Survey release for updates as more granular tables are published.

Real Estate Agent Farming: Working Rented and Transitioning Land
For an agent, farming rented agricultural ground is a rental-income underwriting exercise as much as a listing-prospecting one. US farmland landlords collected a combined $34.1 billion in annual rental income in 2024, according to the NASS TOTAL Survey — income that underpins the cash-rent comps agents use to justify an asking price to a landlord considering a sale versus a continued lease. An agent who can show a landlord what their parcel’s rent compares to against the state and national averages in the same NASS report has a stronger listing conversation than one quoting only a per-acre sale price.
The other number agents should be tracking is landlord age. The average age of non-farming principal farmland landlords was 69.2 years in 2024, per NASS — a figure that signals a meaningful share of the 79% non-operator-owned rented base is approaching a transfer decision within a normal actuarial horizon, whether through sale, gift, or inheritance. Combined with NASS’s finding that 43 million acres of US farmland are expected to transfer ownership within five years (2024–2029), this is the single most actionable prospecting statistic in the whole survey: it identifies a five-year window, not a vague “someday,” for a defined slice of national acreage to change hands.
Sourcing Transitioning Land
- ✔ $34.1 billion total 2024 rental income to US farmland landlords (NASS) — use this to benchmark a specific parcel’s cash rent when advising a landlord on hold-vs-sell.
- ✔ 43 million acres of US farmland are projected to change ownership in the 2024–2029 window (NASS TOTAL Survey) — treat parcels in this bucket as your highest-priority farming list.
- ✔ 69.2 years average age of non-farming principal landlords (2024, NASS) — succession conversations, not purchase offers, are usually the right first outreach with this group.
- ⚠ Succession and loan detail is incomplete: NASS’s 2022 Census of Agriculture tracks operator age and succession planning, and USDA’s Farm Service Agency runs Beginning Farmer direct and guaranteed loan programs, but neither publishes the granular borrower counts or average loan sizes needed to size the beginning-farmer acquisition pipeline precisely — for a specific program’s current terms and local office data, go directly to your state FSA office rather than relying on a national estimate.

Real Estate Farming Automation: What Can and Can’t Be Automated
“Automation” in agricultural real estate farming means replacing manual comp-pulling and windshield-time inspection with data feeds and remote monitoring — but only certain parts of the workflow are actually automatable today. What can be automated reliably: pulling the annual NASS land-value release the moment it posts each August, flagging parcels whose lease terms are approaching renewal, and monitoring crop condition and field boundaries by satellite instead of driving out to inspect. What can’t be automated from public data alone: identifying which specific landlord in a county is nearing a transfer decision, since NASS’s tenure figures are aggregated at the national and (eventually) state level, not published as a searchable parcel-owner database.
That gap is exactly where satellite monitoring tools add value a spreadsheet can’t: they don’t tell you who owns a parcel, but they do tell you, continuously and without a site visit, whether that parcel is being actively farmed, what condition the crop or pasture is in, and whether recent management changes (a new operator, a shift from row crop to pasture) are visible from imagery — all useful signals for an agent trying to time outreach to a specific landlord.
A Practical Automation Checklist
- Calendar the NASS release: Land Values and Cash Rents publishes annually in August; set a recurring check against nass.usda.gov/Publications/Highlights rather than relying on last year’s PDF.
- Track CRP enrollment against its cap: USDA FSA’s Conservation Reserve Program has a legislated national enrollment cap of 27 million acres; enrollment is updated monthly and tracked at the FSA Conservation Reserve Program page — a parcel near the cap or newly enrolled changes its short-term income profile.
- Monitor field condition remotely instead of scheduling repeat drive-bys, using satellite vegetation and soil data to flag changes worth a phone call.
- Flag lease-renewal windows from your own client records, since public tenure data isn’t parcel-searchable — automation here means your own CRM, not a government feed.
- Re-check foreign-ownership disclosures annually: USDA’s AFIDA reports on foreign holdings of US agricultural land are published yearly, with 2024 data released in January 2026 — expect the next update in late 2026.
Land Reform in the US Context: CRP, Succession, and Tenure Policy
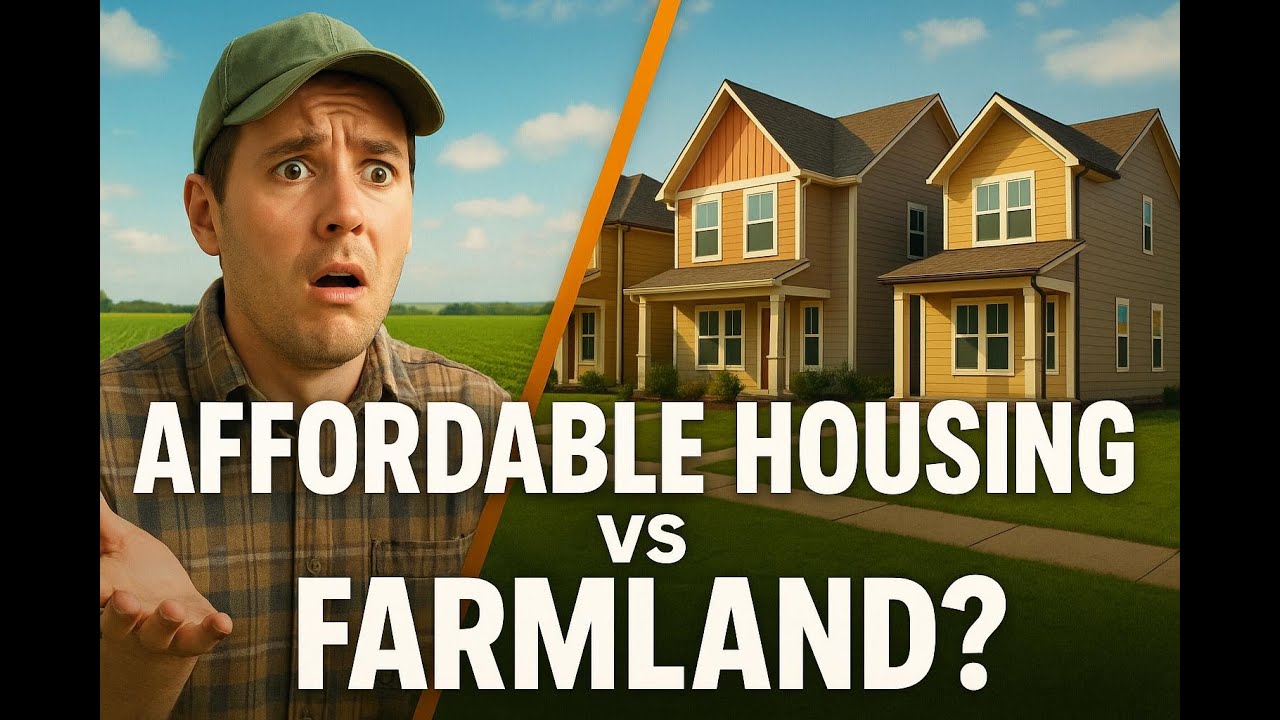
“Land reform” in the US doesn’t mean land redistribution as it does in some other countries — it refers to the policy levers that shape who holds farmland and on what terms: conservation set-asides, succession and estate-transfer rules, and beginning-farmer credit access. The most concrete of these is USDA’s Conservation Reserve Program, which caps national enrollment at 27 million acres under USDA Farm Service Agency rules — land enrolled in CRP is taken out of active production for a contract term in exchange for an annual rental-type payment, directly competing with cropland and pastureland for the same acres this article’s value figures cover.
The succession side of US land-tenure policy is where the 43-million-acre five-year transfer figure and the 69.2-year average landlord age (both above) become policy-relevant: a large share of US farmland sits with an aging, often non-operating ownership class, and federal programs — from FSA’s Beginning Farmer and Rancher loan guarantees to state-level agricultural land trusts — exist specifically to smooth the transfer of that land to the next generation of operators rather than to non-farm buyers. NASS’s TOTAL Survey is the best current national picture of this transition; it does not yet publish a full historical trendline of farm consolidation or state-by-state succession-planning detail, so anyone modeling this for a specific state should treat the national figures as context and check FSA’s local office data for program specifics that apply to their county.
Key US Land-Tenure Policy Facts
- ✔ 27 million acres — CRP’s national enrollment cap under USDA FSA rules; enrollment is tracked monthly at the FSA CRP page linked above.
- ✔ 43 million acres of US farmland projected to transfer ownership between 2024 and 2029 (NASS).
- ✔ 69.2 years average age of non-farming principal landlords in 2024 (NASS) — the demographic driver behind that transfer projection.
- ⚠ Comparative international figures are not in this brief: parallel land-reform statistics for Canada, the UK, or EU member states would need to come from Statistics Canada, Defra, or Eurostat respectively — none of those figures are cited here because they weren’t part of the verified research for this article.

Table: Farmland Value Categories Compared
| Category | 2024 US Average Value / Scale | Change vs. 2023 | Source |
|---|---|---|---|
| Farm real estate (all land + buildings) | $4,170 per acre | +5.0% | USDA NASS Land Values and Cash Rents, 2025 report |
| Cropland | $5,570 per acre | Not separately reported in this brief | USDA NASS Land Values and Cash Rents, 2025 report |
| Pastureland | $1,830 per acre | Not separately reported in this brief | USDA NASS Land Values and Cash Rents, 2025 report |
| Total rented farmland | 348 million acres; $1.6 trillion total value | Not reported in this brief | USDA NASS TOTAL Survey, March 2026 release |
| CRP enrollment cap | 27 million acres (national cap) | Cap is legislated, not annual — check FSA for current enrollment | USDA FSA Conservation Reserve Program |
| Land expected to transfer, 2024–2029 | 43 million acres | Five-year forward estimate | USDA NASS TOTAL Survey, March 2026 release |
Calculator: Rental Land Cash-Flow & CRP Comparison
Use your own acreage, local cash-rent rate, and a CRP payment estimate for your county to compare continued cash-rent leasing against CRP enrollment on the same ground — the calculator does the per-acre arithmetic against the national benchmarks cited above so you can see how your numbers compare.
Assumptions: uses the cash rent and CRP rates you enter, not a fixed national figure — your county's actual CRP rate is set per-contract by FSA and your cash rent is set locally, so check current rates for your county at your local FSA office before deciding. Excludes property taxes, input costs, and any multi-year CRP contract terms or renewal conditions.


Farmonaut: Satellite Data for Farm Real Estate Decisions
Farmland value and tenure statistics from USDA tell you the market you're operating in; they don't tell you the condition of a specific parcel you're pricing, listing, or underwriting. Farmonaut's satellite monitoring, Jeevn AI advisories, blockchain traceability, and resource-management tools fill that gap for farmers, brokers, lenders, and land investors. These tools let users:
- ✔ Monitor crop health and soil condition remotely, reducing the number of physical site visits needed before a listing or purchase decision.
- ✔ Track field-level history to support due diligence when a parcel is transferring ownership.
- ✔ Measure carbon footprint where a parcel's income potential includes conservation or carbon-market eligibility.
- ✔ Verify product and land-use traceability with blockchain records, useful in lending and insurance underwriting.
- ✔ Manage multi-parcel portfolios in one dashboard, whether the parcels are owner-operated, rented, or CRP-enrolled.
Download the app for enterprise, government, or individual use, and explore the Farmonaut API and developer documentation for integration with your own farm-real-estate or lending systems.

Frequently Asked Questions
Q1: What are the best real estate farming tools for agricultural land?
A: The core tools are USDA NASS's annual Land Values and Cash Rents report for pricing benchmarks, the NASS Tenure, Ownership, and Transition Survey for rental and succession data, USDA FSA's Conservation Reserve Program tracker for conservation-income comparisons, and satellite monitoring platforms like Farmonaut for parcel-level condition data that public statistics can't provide.
Q2: How does real estate agent farming work for rural and agricultural land?
A: Instead of prospecting a residential subdivision, agents track a rural market's rented-acreage base (348 million acres nationally, 79% non-operator-owned per 2024 NASS data), cash-rent comps, and landlord succession indicators — since land transfer, not curb appeal, drives most farmland listings.
Q3: What defines "farming neighborhoods" in a real estate context for farmland?
A: It's the practice of building repeat familiarity with a specific rural area's ownership and lease patterns — who owns what, who rents it, and when leases or landlord life-stage suggest a transfer is coming — rather than a literal residential neighborhood.
Q4: Can real estate farming for agricultural land be automated?
A: Partially. Pulling annual land-value data, tracking CRP enrollment against its 27-million-acre cap, and monitoring field condition by satellite can all be automated. Identifying which specific landlord is nearing a transfer decision cannot, because that detail isn't in a public searchable database.
Q5: What does "land reform" mean in the US, and how does it affect farmland real estate?
A: In the US, land reform refers to policy tools like the Conservation Reserve Program and beginning-farmer credit programs, not redistribution. CRP's enrollment cap (27 million acres) and USDA's finding that 43 million acres are expected to change hands by 2029 are the two figures that most directly affect farmland's real estate market.
Q6: Where can I find current US farmland values instead of last year's figures?
A: USDA NASS republishes Land Values and Cash Rents every August at nass.usda.gov/Publications/Highlights. Always check the current edition before quoting a value to a client.





Conclusion & Next Steps
Real estate farming tools for agricultural land work best when they combine three things: a current national value benchmark (USDA NASS's $4,170 per acre farm real estate average, $5,570 cropland, $1,830 pastureland — all 2024 figures, republished every August), a read on which parcels are likely to transfer (43 million acres nationally by 2029, concentrated among landlords averaging 69.2 years old), and parcel-level condition data that no government survey provides. None of the first two replace the third — a satellite view of a specific field's crop health and management history is what turns a landlord's aggregate statistic into an actionable listing or purchase decision.
- ✔ Check the current-year NASS Land Values and Cash Rents release before pricing any parcel.
- ✔ Prioritize outreach to non-operating landlords in the 348-million-acre rented base — they control the sales pipeline more than operators do.
- ✔ Compare cash-rent income against CRP payment rates for any parcel where conservation enrollment is a live option, using the calculator above with your own local figures.
- ✔ Track FSA's CRP enrollment against its 27-million-acre national cap and re-check AFIDA foreign-ownership data annually.
To start building a real-estate-farming workflow on current data, download the Farmonaut app, access the API, or read the developer documentation.

Discussion
Questions, corrections or field experience? Share them below. First-time comments are reviewed before they appear, and your email is never published.
No comments yet. Be the first to add a question or your experience.

 Global Agrifood
 Cazlv
 HIPSAC
 ZOL Zimbabwe
 Juligerm
 AdBio
 MISE Maroc
 Drift-Sense
 NWNS
 Red August Group
 Farm Inc
 WeMe Global
 Agrotoken
 Blue BearX
 Insignito
 Croptimum
 DnCubed
 Field Capacity
 Indosistim Teknologi

 Licence holder · Niger · Gold
 Licence holder · Nigeria · Gold + lithium










