

Copper Cobalt Exploration: Satellite Targets, Drill Hit
An exploration operator screened a focused copper-cobalt licence from orbit, took our ranked targets to the drill, and encountered mineralisation where the analysis said it would be. This is what a satellite screen looks like when the ground agrees with it.
The hardest question in copper cobalt exploration is not whether a licence contains mineralisation. It is whether the place you chose to put your first drill hole was the right one. This case study follows a project where that question got a clear answer: the operator drilled the targets our satellite analysis ranked highest, and mineralisation was encountered.
Between a prospectivity map and a drill result sits every reason exploration is difficult. Getting from one to the other — on a modest budget, on a compact licence, with two metals in play — is the outcome this article describes.
Most published remote-sensing case studies stop at the map, because most projects are still at that stage when they are written up. This one goes further, and that matters: a prospectivity surface is a hypothesis until a rig tests it. What follows is the full path from a licence-wide satellite screen through target ranking to a physical result in the rock — the sequence that a copper cobalt exploration programme is ultimately judged on.
What the client reported back to us
This client is not identified and did not provide a testimonial; no statement here is quoted from or attributed to them. Country, licence boundary, coordinates, exact area, dates and zone-level results are withheld. All outcome figures are banded responses to our own structured post-project feedback form. Imagery is illustrative and does not depict the client’s licence.

Why Copper Cobalt Exploration Suits Satellite Detection
Not every commodity is equally visible from orbit, and copper sits near the top of the list. That is the single biggest reason a project like this one works.
When copper sulphides weather near surface, they produce secondary copper minerals with some of the most recognisable colouration in all of geology — the emerald green of malachite and the deep blue of azurite. These are not merely visible to the eye; they carry diagnostic spectral absorption features that a calibrated multispectral or hyperspectral sensor can identify and map. Where copper has oxidised at surface, remote sensing has an unusually strong and unambiguous signal to work with.
That signal rarely stands alone, either. A weathering copper system typically leaves a gossan — an iron-oxide cap formed as sulphides break down — alongside clay and carbonate alteration, all of it localised by faults and fracture corridors that channelled the original mineralising fluids. Each of those is independently mappable. Where several coincide in the same place, the confidence in a target rises well above what any single indicator would justify.
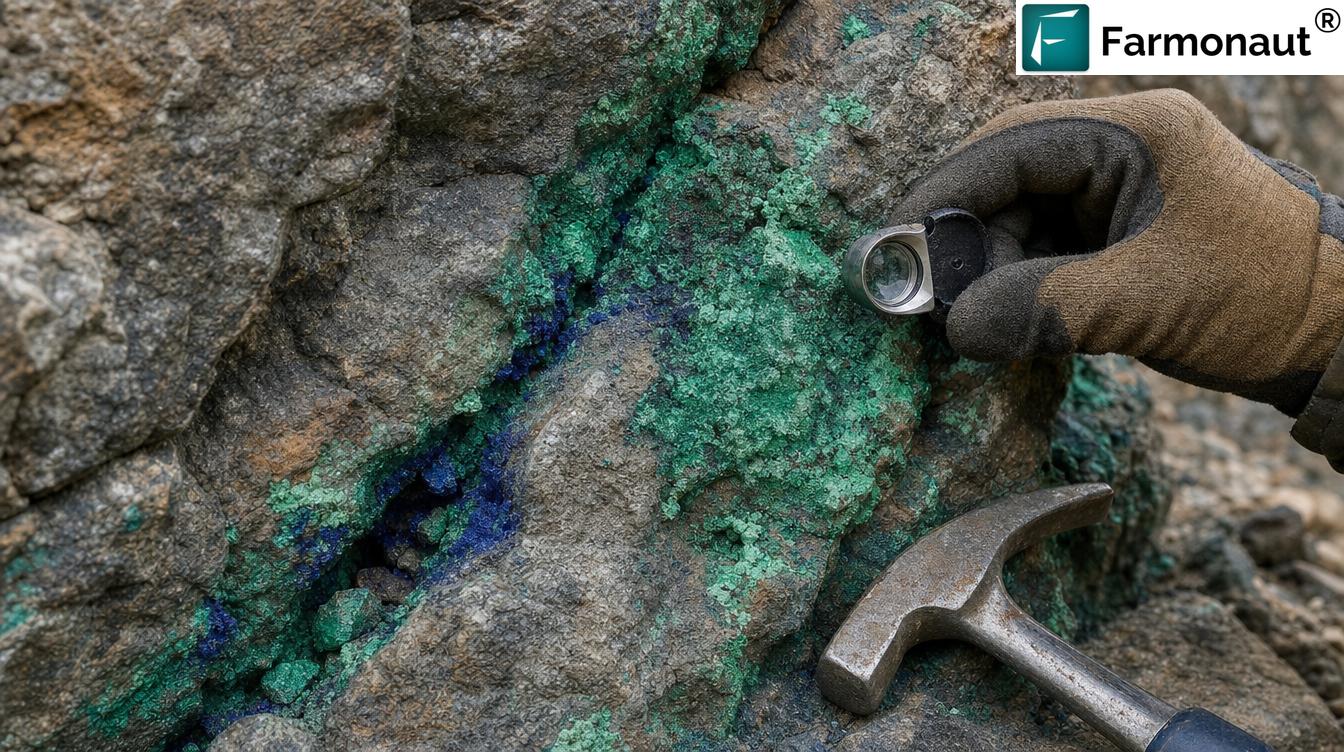
“Where copper has weathered at surface, satellites have one of the clearest mineral signals in all of geology to work with.”
Copper’s advantage is corroboration. Secondary copper colouration, gossanous iron staining, alteration mineralogy and structural control are four independent lines of evidence. A target where all four coincide is a fundamentally different proposition from one resting on a single spectral index — and it is the kind of target worth putting a rig on.
Request a quote for your licence, or draw your concession boundary yourself at mining.farmonaut.com.
The Project: A Focused Licence, Two Battery Metals
The licence was compact — under 100 hectares — and the targets were copper and cobalt together, a pairing that in practice usually indicates sediment-hosted or weathered-profile mineralisation where the two metals occur in the same system and are separated later during processing.
Compact licences carry a particular pressure. There is less room for error: an operator cannot afford to spend a drilling budget testing the wrong 10% of a small property, because on ground that size there may only be budget for one campaign. Precision matters more, not less, when the licence is small.
The commercial context sharpens it further. Copper and cobalt are both classified as critical minerals across major economies, driven by electrification and battery demand, and cobalt in particular carries supply-chain scrutiny that rewards operators who can document their ground properly. An operator holding prospective copper-cobalt ground has a genuinely valuable asset — provided they can demonstrate where the value sits.
Why copper and cobalt ground is worth characterising properly
Both metals sit on the critical-minerals lists of every major economy, and for the same underlying reason: electrification. Copper is the conductor of the energy transition — grids, motors, storage, charging infrastructure all consume it in quantity, and the intensity of copper use per unit of installed capacity is higher for renewable generation than for the thermal generation it replaces. Cobalt’s demand story runs through battery cathode chemistry, where it contributes to energy density and thermal stability.
What makes this commercially relevant to a licence holder is not the demand narrative itself, which is widely reported, but its consequence: capital is actively looking for well-characterised copper-cobalt ground. Processors want feedstock security. Battery manufacturers want traceable supply. Investors want assets with a documented technical basis rather than a geological anecdote.
Cobalt carries an additional dimension. Supply-chain provenance is scrutinised more closely for cobalt than for almost any other exploration metal, and operators who can demonstrate a formal, documented approach to characterising and developing their ground are better positioned with the counterparties who care about that scrutiny.
All of which means an early-stage copper cobalt exploration licence is a genuinely valuable asset — conditional on the holder being able to show where the value sits and on what evidence. That is what a satellite prospectivity study produces: an independent, structured technical record of the ground.
“Capital is looking for well-characterised copper-cobalt ground — not for geological anecdotes.”
How the Targets Were Ranked
Farmonaut has applied Earth observation and AI to mineral exploration since 2018, across 100,000+ hectares in 25+ countries for more than 20 mineral types. The workflow on this licence followed our standard four stages.
- Acquisition. We assembled a multi-date image archive over the licence rather than relying on a single scene, so any anomaly could be tested for persistence across seasons instead of trusted from one snapshot.
- Correction and decomposition. Raw radiance was atmospherically corrected, then spectrally decomposed to separate genuine mineralogical response from soil, shadow and vegetation contributions.
- Indicator mapping. We mapped secondary copper response, iron-oxide and gossan indices, clay and carbonate alteration, and the structural and stratigraphic architecture controlling fluid pathways.
- Ranking and delivery. Those layers were combined into a prospectivity surface, discrete zones were delineated and ranked, and the package was delivered as a report plus georeferenced GIS files — typically within 5–20 business days.
The client confirmed the outcome of that process directly: asked whether the analysis narrowed down where to explore or drill, they answered yes. They also reported saving up to 30 days of exploration time — on a licence small enough to walk, a month of compressed decision-making is a meaningful head start on a field season.
The Result: Drilled, and Mineralisation Encountered
This is the part of the story that most satellite exploration case studies never reach, because most projects are still at the map stage when they are written up.
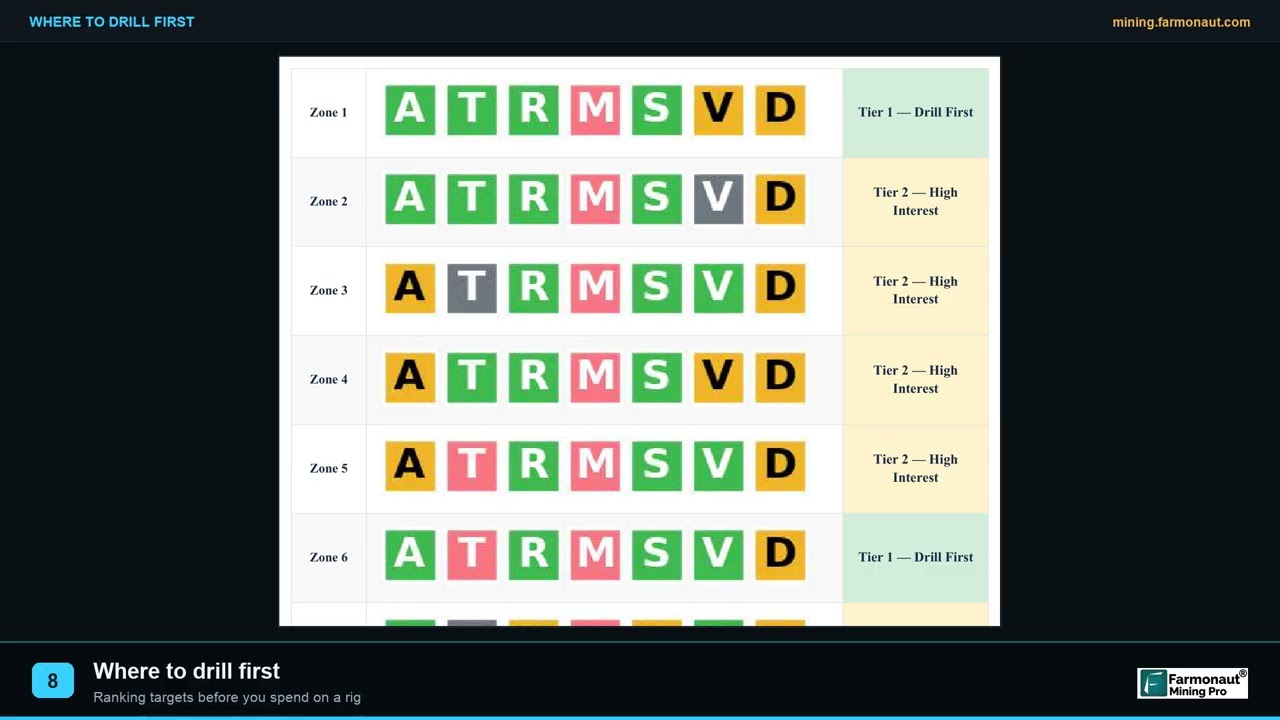
The client took the ranked targets to the drill. They subsequently confirmed to us that mineralisation was encountered. The prediction made from orbit was tested against physical rock, and the rock agreed.
For a remote-sensing analysis, that is the outcome that matters. Every prospectivity surface is a hypothesis until something is drilled through it, and a hypothesis that survives contact with a drill bit is in a different category from one that has not yet been tested.
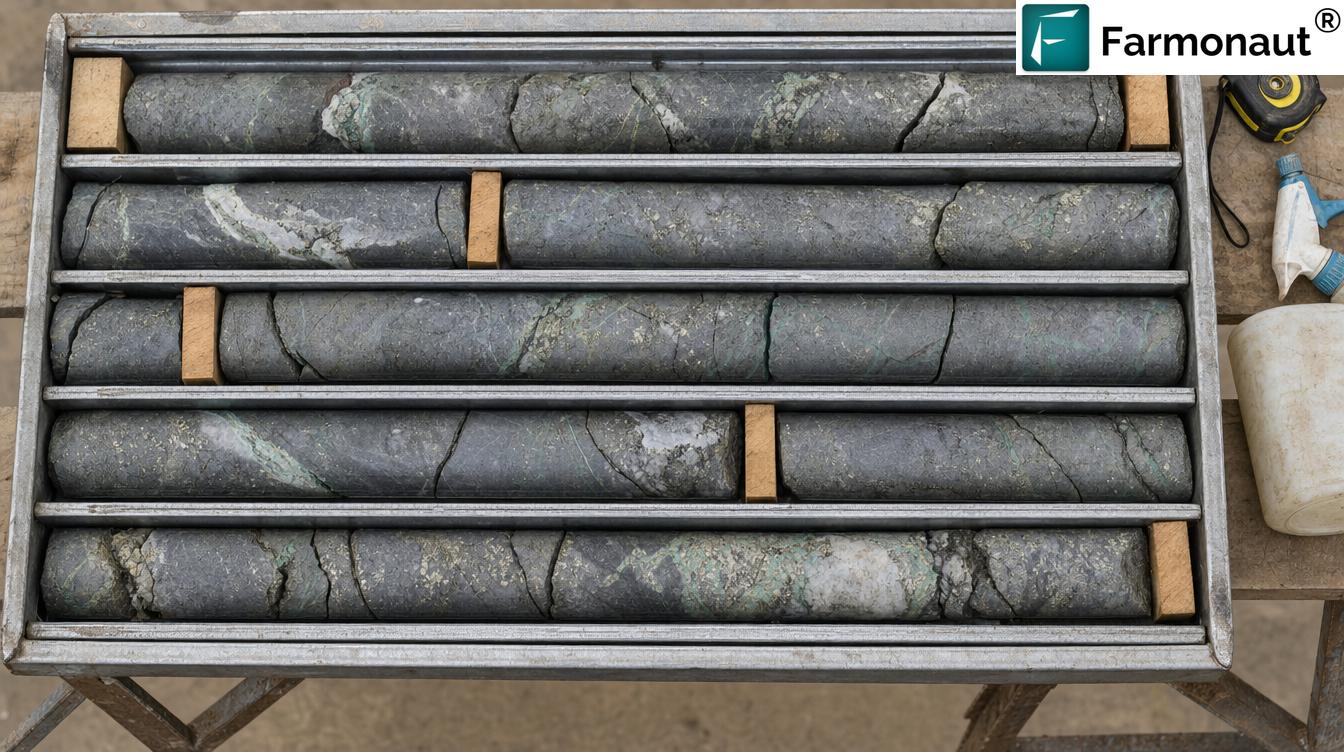
The next milestone on this project is laboratory assay, which had not yet been completed when the client reported back. Visible mineralisation in core establishes that the system is present where the analysis indicated; assay is what attaches grade figures to it. Both steps matter, and this project has cleared the first.
When assessing an early-stage licence, the sharpest question is simple: has anything here been physically tested, or is the whole story still a surface interpretation? A project where satellite targets have been drilled and mineralisation encountered sits at a materially different point on the risk curve from one that has never seen a rig.
What a Validated Target Unlocks
A drill result changes an exploration project’s standing in ways that a map, however good, cannot. It is worth being specific about what actually shifts once satellite targets have been physically tested and mineralisation encountered.
The geological model stops being theoretical. Before drilling, a prospectivity surface is a set of inferences about what surface response implies at depth. After a hole confirms mineralisation at a ranked target, the operator has evidence that the model’s logic holds on this ground. Every subsequent target derived from the same model inherits some of that credibility — which is why the second and third holes on a validated property are better-informed decisions than the first.
Follow-up work becomes far easier to justify. Exploration budgets are approved against evidence. “Our analysis ranks this zone highly” and “we drilled the highest-ranked zone and encountered mineralisation” are different propositions to a board, a partner or a lender, even at identical geological maturity.
The licence becomes describable. An operator seeking a joint-venture partner, an offtake discussion or finance needs a technical narrative with a physical result in it. A validated target provides the strongest possible version of that narrative available at this stage of exploration.
And the next steps become obvious rather than open-ended. Assay attaches grade to the intersection. Additional holes test continuity and geometry. Sampling extends the picture laterally. None of that sequencing requires a strategic decision — it follows directly from having a confirmed intersection to build outward from.
Once a satellite-derived target is drill-validated, go back to the prospectivity surface before planning the next hole. Knowing which score band and which combination of indicators produced a hit lets you re-rank the remaining zones against a locally calibrated benchmark rather than a generic one — often the single most valuable thing a first successful hole produces.
What Made This Work
Four things lined up on this project, and they are worth naming because they are the conditions worth reproducing.
- ✔ A commodity with a strong surface signal. Oxidised copper is among the most spectrally distinctive exploration targets there is. The analysis had good material to work with.
- ✔ Multiple corroborating indicators. Copper response, gossan, alteration and structure pointing at the same ground produces a far more robust target than any single index.
- ✔ A compact, well-defined licence. Concentrating a full indicator stack over a small area yields fine-grained ranking rather than broad regional zones.
- ✔ An operator who actually drilled. This is not a trivial point. A ranked target list only becomes a validated result when someone commits a rig to it — and this client did.
When you receive a prospectivity report, look for coincidence between independent indicator layers, not just the highest score on the composite surface. A moderate-scoring zone where copper response, gossan and a structural corridor all overlap is frequently a better first hole than a high-scoring zone carried by one indicator alone.
How this compares with our other validated projects
This is not an isolated result. We publish client-reported outcomes from completed projects, and the pattern across them is consistent on the point that matters most for copper cobalt exploration and precious-metals work alike.
On a 1,870-hectare gold licence in Niger, the operator drilled our ranked targets, completed laboratory testing and confirmed mineralisation, reporting three to six months and USD 50,000–100,000 saved. On a 300-hectare gold and lithium licence in Nigeria, the operator reported over six months saved and used the report to characterise the asset for stakeholders ahead of a planned drilling programme.
Across all three — on licences ranging from under 100 hectares to nearly 1,900, and across four different commodities — every client answered yes to the question of whether the analysis narrowed down where to explore or drill. Two of the three have taken those targets to a rig, and both encountered mineralisation. That consistency across scale and commodity is the strongest argument we can make for the method.
A note on cobalt specifically
One technical point deserves stating clearly, because it affects how a copper-cobalt report should be read. Copper — particularly oxidised secondary copper — is directly detectable. Cobalt is generally not. It rarely produces its own distinctive surface expression at exploration scale, and is instead inferred from its geological association with the copper system and host stratigraphy.
That is a legitimate and standard inference in this deposit style, and it is how copper-cobalt targeting works on the ground as well. But an operator should understand what they are buying: a directly evidenced copper target, with a geologically reasoned expectation that cobalt accompanies it. Sampling and assay are what convert that expectation into a number.
How Small Licences Benefit From Copper Cobalt Exploration Screening
There is a persistent assumption that satellite screening is only worthwhile over very large concessions. This project is a useful counterexample.
On a compact licence the benefit shifts from coverage to precision. The full indicator stack is concentrated over a small area, producing target ranking at a resolution that genuinely distinguishes one part of the property from another. Where an operator has budget for a single drilling campaign, knowing which corner of a small licence carries the strongest coincident signal is worth a great deal — arguably more than the same information across a property so large that several campaigns were always going to be needed.
| What a compact licence gains | How it shows up in practice |
|---|---|
| Fine-grained target ranking | Full indicator stack concentrated over a small area |
| Faster route to a drill decision | Time saving reported here: up to 30 days |
| Better use of a single campaign | One rig mobilisation aimed at the strongest coincident signal |
| Complete coverage from the first pass | Whole licence assessed on one consistent basis |
| No ground disturbance while screening | No tracks, pits or trenches during the speculative phase |
| Documentation for partners and finance | An independent technical record of where value sits |
Turning a compact licence into a well-documented one
There is a second benefit for small operators that has nothing to do with geology and everything to do with how exploration ground actually changes hands.
Small licences are frequently held by operators without an in-house technical department. That is not a criticism — it is the normal structure of early-stage exploration in most of the world. But it means the technical documentation supporting a licence is often thin, and thin documentation is a real obstacle when the holder wants to raise money, bring in a partner, satisfy a regulator’s work commitment, or sell.
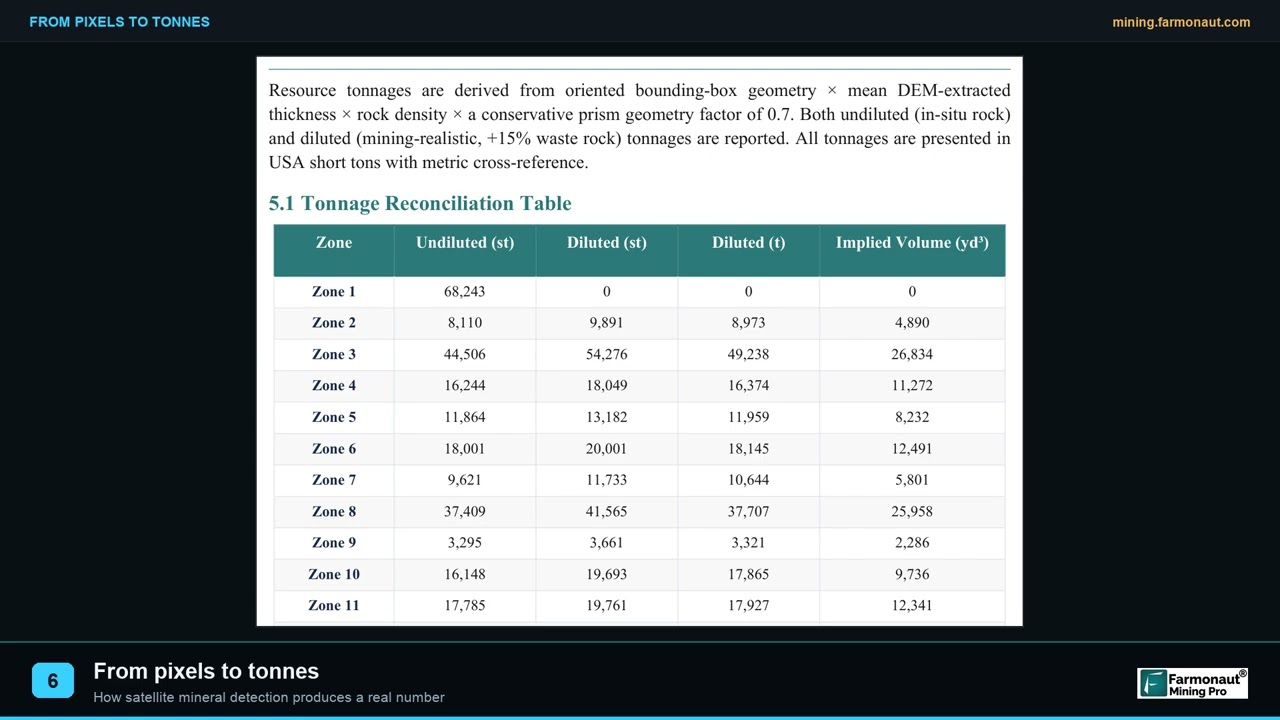
A satellite prospectivity study fills that gap in a way that is disproportionately valuable on a small property. It produces a structured, independent, third-party technical assessment covering the entire licence on one consistent basis, delivered with georeferenced GIS files that any competent geologist on the other side of a negotiation can load and interrogate for themselves. For an operator whose alternative was a verbal account and a licence map, that is a substantial change in position.
When the targets in that document have subsequently been drilled and mineralisation encountered — as on this project — the document stops being a plan and becomes a record of something that worked.
The screening phase involves no ground disturbance at all — no access tracks, no pits, no trenching, no drilling fluids. Ground that turns out not to warrant work is ruled out without ever being touched, and the rig goes only where the evidence points.
How to Run This on Your Own Licence
- Send the ground. Coordinates, KML/KMZ or a drawn polygon, plus country and every target commodity — not just the primary one.
- We select the sensor stack. Multispectral or hyperspectral, matched to area and mineral complexity, with multi-date coverage for seasonal validation.
- Analysis and delivery. Typically 5–20 business days, delivered as a report plus georeferenced GIS files you can load directly into your own systems.
- Optional Premium+ upgrade. Adds TargetMax™ Drilling Intelligence — drilling-angle recommendations, higher ore-intersection probability, and interactive 3D subsurface models.
- Then drill. As this operator did — and as every satellite target ultimately requires.
A short glossary
- Secondary copper minerals
- Copper compounds formed by near-surface weathering of primary sulphides — malachite and azurite among them. Their strong colour and diagnostic spectral features make oxidised copper a highly tractable remote-sensing target.
- Gossan
- An iron-oxide cap formed where sulphide mineralisation has weathered at surface. A classic and highly mappable indicator of a mineralised system below.
- Alteration halo
- Chemically altered rock surrounding a mineralising system, typically much larger than the ore body itself — which is exactly what makes it detectable from orbit.
- Prospectivity index
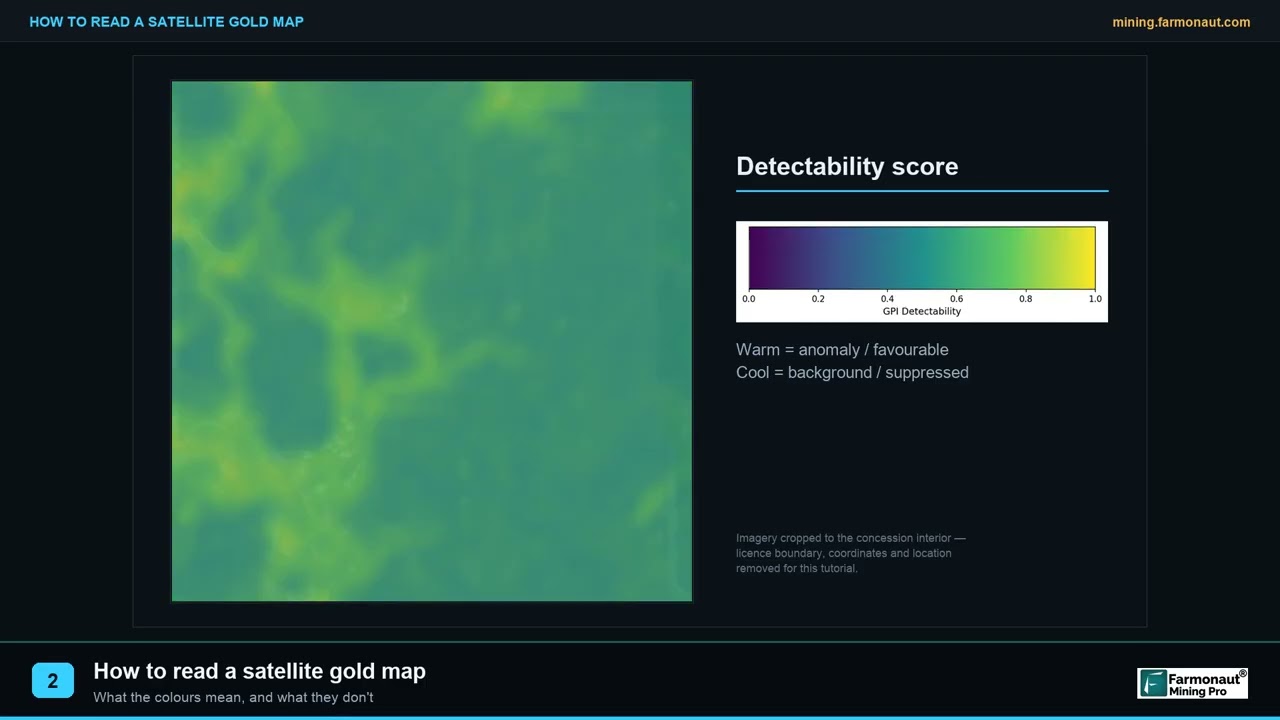
- A per-pixel composite score ranking relative favourability across a licence. A ranking, not a grade and not a probability.
- Mineralisation encountered
- A field observation that mineralised material was intersected in drilling — visible sulphides, oxides or alteration. The step that validates a target; assay is what attaches grade to it.
- Exploration target
- A deliberately cautious term for an estimate too speculative to be reported as a Mineral Resource. Always expressed as a range.
Put your first drill hole where the evidence points
Screen your whole licence, rank the ground, and commit your campaign to the strongest coincident signal.
Frequently Asked Questions
Did drilling confirm the satellite targets on this project?
Yes. The client drilled the targets ranked by the analysis and reported that mineralisation was encountered. Laboratory assay, which attaches grade figures to that observation, was the next step and had not been completed when they reported back. Visible mineralisation at a predicted target is the validation step that matters most for a remote-sensing analysis.
Why is copper well suited to satellite detection?
Because weathered copper produces secondary minerals — malachite and azurite — with strong, diagnostic spectral signatures, usually accompanied by a gossanous iron-oxide cap and associated alteration. Several independent indicators can be mapped and cross-checked against one another, which makes copper cobalt exploration one of the more reliable applications of spectral remote sensing.
Can satellites detect cobalt directly?
Generally no. Cobalt rarely produces a distinctive surface expression at exploration scale and is inferred from its geological association with the copper system and host stratigraphy. A copper-cobalt screen should be understood as a directly evidenced copper target carrying a geologically reasoned cobalt expectation, confirmed by sampling and assay.
Is satellite screening worthwhile on a small licence?
Yes — this project ran on a licence under 100 hectares. On compact ground the benefit is precision: the full indicator stack concentrated over a small area produces fine-grained ranking, which matters most when an operator has budget for a single drilling campaign and needs it aimed correctly.
How long does an analysis take?
Typically 5–20 business days depending on area size and mineral complexity, delivered as a report plus georeferenced GIS files. This client reported saving up to 30 days of exploration time against their planned approach.
Why is the client not named?
This client did not provide a testimonial and is not identified. Country, licence boundary, coordinates, exact area and dates are withheld to protect their commercial position. All figures come from banded responses to our structured feedback form, published without attribution.
Is satellite analysis valid for resource reporting?
No. Satellite-derived estimates are exploration targets, not Mineral Resources under JORC, NI 43-101 or equivalent codes. They cannot be reported as resources and do not replace drilling, sampling or a qualified person’s assessment. Their role is deciding where that work should happen — as it did here.
Published in anonymised form. The client is not identified and did not provide a testimonial; no statement in this article is quoted from or attributed to them. Country, licence boundary, coordinates, exact area, project dates and zone-level results are withheld. All outcome figures are banded responses to Farmonaut’s structured post-project feedback form. Mineralisation reported at drill targets was a client field observation; laboratory assay had not been completed at the time of reporting and no grade is claimed or implied. Imagery is illustrative and does not depict the client’s licence. Satellite-derived estimates are exploration targets and do not constitute Mineral Resources or Reserves under JORC, NI 43-101 or any equivalent reporting code.
Discussion
Questions, corrections or field experience? Share them below. First-time comments are reviewed before they appear, and your email is never published.
No comments yet. Be the first to add a question or your experience.

 Rains of Favour
 Tintina Mining Group
 Dalgety Minerals Pty Ltd
 Vortex Minerals Pty Ltd
 Faith At Work (Pty) Ltd
 Geotech Mining Solutions plc
 Vulcan International Limited
 Kidepo Associates
 GKY Mining
 Alkimy SARL
 Double A Trading
 GemSprout Metals Limited
 Qader Group
 Ileys General Trading
 SG Gold Mining LLC
 VRV Global Pte Ltd
 Omsri International FZE
 G.I.T.T.
 Jaunita Erss Ltd
 Almosi SARL
 SRK Consulting
 Berks Gold Limited
 Mwerezi Minerals Company Limited
