

Gold exploration · Structural geology guide
Shear Zone Gold: How to Spot Gold-Bearing Structures
A shear zone is a band of sheared rock that can act as the plumbing for gold. The USGS says ore typically sits in lower-order faults beside the main shear. We show how to find, read and rank these structures before drilling.
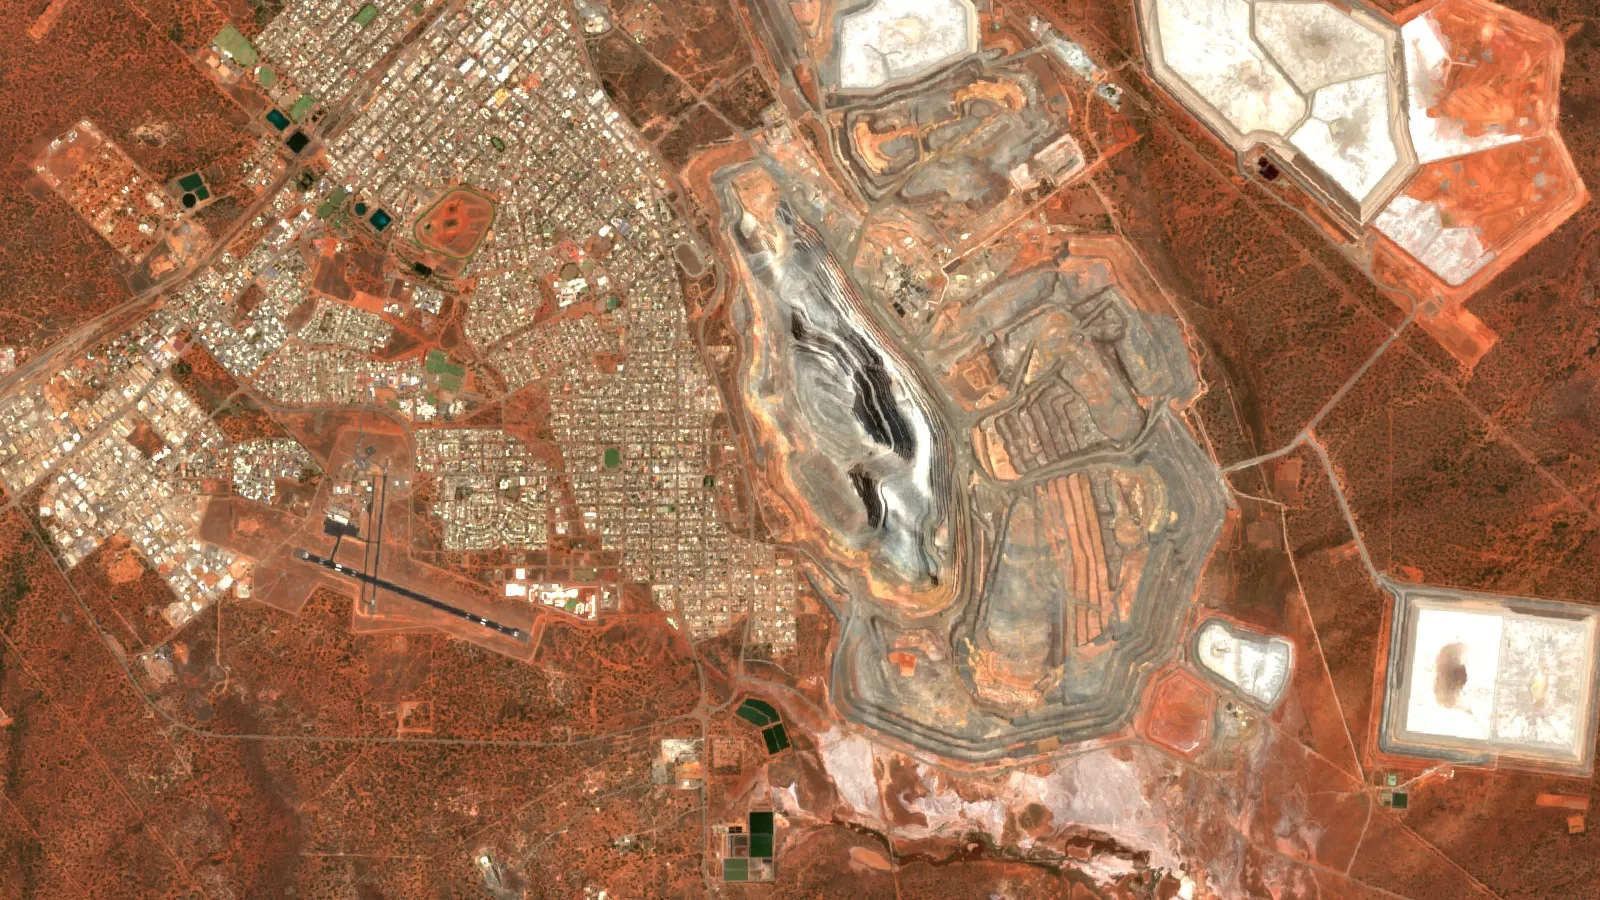
Key takeaways
- Orogenic gold forms along crustal-scale shear zones, but ore is typically in lower-order faults and traps beside them (USGS Data Report 1198).
- Two linked Western Australian shear systems cut similar rock: Boulder-Lefroy has produced over 1,500 t of gold, Bardoc only about 100 t (Morey and others, 2007).
- Look for splays, bends, fold hinges, strength contrasts and vein intersections, not just the main fault (Ayer, 2019; Morey and others, 2007; Hausel, 2002).
- Gold can be invisible, held inside pyrite or arsenopyrite, so assay the vein and the altered wall rock (USGS Data Report 1198).
- Aeromagnetic data and satellite imagery map candidate structures; field work and drilling confirm them.
In this article
- What a shear zone is and how it differs from a fault
- Why gold sits in shear zones
- Seven gold-bearing structures to look for
- What the gold numbers show: rich and poor shear systems
- How to identify gold veins and gold-bearing quartz in the field
- How to spot gold-bearing structures on maps, magnetics and satellite data
- How to rank structures before you drill
- Grade and size: a quick tonnage check
- Why many shear zones carry little gold
- Frequently asked questions
A shear zone is a band of rock where one block has slid past another and the rock in between has been crushed, stretched or smeared into a new fabric. It matters for gold because, in many of the world’s gold districts, these bands acted as the plumbing: the US Geological Survey (USGS) describes orogenic gold deposits (gold formed in mountain-building belts) as forming along crustal-scale shear zones that channel hot fluids upward, with ore typically sitting in smaller faults beside the main structure (USGS Data Report 1198). This guide shows which structures carry gold, how to recognise them in the field, on magnetic maps and on satellite imagery, and how to rank them before a drill rig moves.
Three terms first. Gold-bearing structure means any fault, shear, fold or vein system that held gold-rich fluid. Grade is the amount of gold in the rock, in grams per tonne (g/t). Strike length is how far a structure runs along the ground; true width is its thickness measured at right angles to its walls. For a deeper look at those last two, see our guide to strike length and true width.
What a shear zone is and how it differs from a fault
A fault is usually a single, sharp break. A shear zone is a wider band, from centimetres to kilometres across, where the rock has deformed more gradually. Deep in the crust, hot rock flows like stiff putty and forms a ductile shear zone with a layered, banded fabric. Nearer the surface, cold rock snaps and forms a brittle fault with crushed rock or breccia (angular fragments of broken rock). Between the two sits the brittle-ductile transition, where the rock does both. Orogenic gold is interpreted to have been deposited in that middle zone (Nassif and others, Scientific Reports, 2022).
In the field, geologists read a shear zone from a few clear signs:
- Foliation: the rock splits into thin sheets because its minerals have been flattened and aligned.
- Stretching lineations: grains or minerals drawn out in one direction on the foliation surface, which show which way the blocks moved.
- S-C fabrics: two sets of surfaces at a small angle to each other, which show the sense of movement (the Western Australian studies below use them to prove reverse movement on a gold-bearing vein).
- Granulated rock: the Wyoming State Geological Survey notes that shear zones consist of granulated rock, and that gold in them is often found with rust-stained quartz (Hausel, Wyoming State Geological Survey, 2002).
Why gold sits in shear zones
The short version: heat from mountain-building squeezes water and carbon dioxide out of buried rock; that fluid carries a little gold; shear zones give it a path up; and a change in pressure or chemistry makes the gold drop out. The USGS sets out each step.
- Source. Fluids and gold are released when rock is metamorphosed (cooked and recrystallised) at the greenschist to amphibolite transition. Bisulfide, a sulfur compound, carries the gold in solution (USGS Data Report 1198).
- Pathway. Crustal-scale shear zones link that deep source to the shallow site where gold is deposited. High-pressure fluid is channelled along these first-order structures during earthquakes (same USGS report).
- Trap. The mineralisation itself is typically in lower-order faults, where more efficient structural and chemical traps exist (same USGS report). Pressure swings from near-lithostatic (the weight of the rock above) to near-hydrostatic (the weight of a water column) help the gold precipitate.
- Chemistry. Iron-rich rocks and carbon-rich rocks strip the sulfur from the fluid. Pyrite forms and the gold falls out of solution with it (same USGS report).
A 2022 study of the Garrcon deposit in the Abitibi greenstone belt of Canada found that early vein quartz formed at near-lithostatic pressure, while the coarse native gold arrived late, at much lower pressure (Nassif and others, 2022). The same paper notes that orogenic gold deposits account for about one-third of world gold production. The practical lesson for a licence holder is that the main shear is the corridor, not the target. The gold is usually where the corridor does something awkward.

▶ How hot water and earthquakes gather gold into veins, explained in clay. · 4:16
Seven gold-bearing structures to look for
Every orogenic gold camp is different, but the same few structural settings keep coming up. This table lists them with what each looks like on the ground and where the evidence comes from. Treat it as a checklist for mapping, not a promise of gold.
| Structure | What it is | Why gold can concentrate there | Evidence |
|---|---|---|---|
| Main regional shear or fault | A first-order break that can run for hundreds of kilometres | It carries fluid from depth but is rarely the ore itself | The Larder Lake-Cadillac Break in Canada is a 250 km thrust that hosts seven mining camps (Ayer, Laurentian University, 2019) |
| Splay faults | Second- and third-order faults that branch off the main break | They are lower-order traps where fluid slows and reacts with wall rock | Dome, Hollinger, Hoyle Pond and Kirkland Lake sit on splays of regional faults (Ayer, 2019); Yilgarn deposits are commonly sited on second- or third-order faults that splay off first-order shears (Morey and others, 2007) |
| Fault bends, jogs and duplexes | Places where a fault steps sideways or bends, opening space | Strike-slip duplexes form where stress passes between fault tips, and mineral deposits may form there (USGS Open-File Report 03-077) | Gold is sporadic along a fault but can be continuous to great depth where it does occur (USGS Open-File Report 03-077) |
| Fold hinges and antiforms | The crest of an upward fold, often in competent volcanic rock | Folded stiff rock creates low-stress, high-permeability sites | Hollinger-McIntyre is an antiform linked to the Porcupine-Destor Fault, a setting like the Golden Mile at Kalgoorlie (Morey and others, 2007) |
| Rock contacts with a strength contrast | A boundary between stiff rock (basalt, dolerite) and soft rock (shale, schist) | Stiff rock fractures and opens; soft rock seals. Fluid localises in stiff units next to the contrast | Paddington gold ore is mainly in dolerite and basalt (Morey and others, 2007); Laurentian advises focusing on contacts between brittle, ductile and iron-rich rock (Ayer, 2019) |
| Vein intersections and breccia | Where two vein sets cross, or where a fault has shattered the rock | Many veins carry sporadic gold, with ore shoots 100 to 1,000 times the vein average, often at fold closures and vein intersections (Hausel, 2002) | Gold may sit in the limonite-stained matrix of fault breccia (Hausel, 2002) |
| Extensional shear zones | Shears that formed while the crust was stretching, not squeezing | They carry gold too, with deep but narrow ore shoots parallel to the stretching direction | Examples at Leonora, Lancefield, Lawlers and Kunanalling in Western Australia (Geoscience Australia, AusGeoNews 100, 2010) |
For more on how these structures fit with the rock types that host them, see our guide to types of gold deposits and host rocks.
What the gold numbers show: rich and poor shear systems
Not every shear zone is rich, and the best natural experiment is in Western Australia. The Bardoc Tectonic Zone and the Boulder-Lefroy Shear Zone are physically linked along strike, are physically linked, and both are orogenic gold shear systems. Yet the Bardoc zone has produced about 100 tonnes of gold from more than 80 deposits, while the Boulder-Lefroy system has produced more than 1,500 tonnes, one order of magnitude more (Morey, Weinberg and Bierlein, Mineralium Deposita, 2007).
Chart
Linked shear systems, ten times apart in gold
Gold produced, tonnes; Boulder-Lefroy is shown at its stated minimum
Chart
Gold along Abitibi’s main fault systems
Million ounces (Moz), endowment as stated in the source; the bars overlap or come from different counts, so do not add them
The authors traced the difference to structure. The Bardoc zone is a broad belt, more than 5 km across, deformed in one dominant episode of reverse shearing and folding. The Boulder-Lefroy system is narrower (under 2 km across strike), more tortuous, linked to many small splay faults near large antiforms, and was reworked by several deformation events. Those features gave fluid more places to localise and more chances to reopen veins.
Read that as a screening rule: a simple, wide, once-deformed belt is a weaker target than a narrow, kinked and reactivated one, all else equal. It is not a guarantee, because the paper itself notes that other physical and chemical factors also control endowment. The first chart above shows the contrast; the second shows how large the gold camps of Canada’s Abitibi belt are along their main faults.
Abitibi is the textbook case. It holds an endowment of about 200 million ounces, and its two main structures are the Porcupine-Destor and the Larder Lake-Cadillac fault zones; the Larder-Cadillac Break alone hosts seven camps with about 100 million ounces (Ayer, Laurentian University, 2019). Timmins, described there as the world’s largest Archean orogenic gold camp, holds about 75 million ounces at an average of 6.5 g/t, much of it in veins in hanging-wall anticlines (Hollinger-McIntyre and Dome) beside the Porcupine-Destor Fault. Kirkland Lake has about 26 million ounces in a deposit 6 km long on the “Main Break” fault, which lies 2 km from the regional break. Our own guide to the Abitibi greenstone belt goes through the camps and targets.
How to identify gold veins and gold-bearing quartz in the field
People searching for gold-bearing quartz usually want to know whether the white rock in front of them is worth sampling. Here is what the USGS and state geological surveys describe, in the order you would check it.
1. Start with the structure, not the quartz
Quartz is common and most of it is barren. Gold-bearing veins sit in a structural context: along a shear, a splay, a fold hinge or a contact. Find the structure on the geological map first, then walk it.
2. Look for rust and honeycomb rock
When pyrite weathers it produces rust and a gossan, the rusty, oxidised cap over a sulphide-bearing vein. The Wyoming State Geological Survey says pyrite gossans are typically reddish-brown and arsenopyrite gossans greenish-yellow (Hausel, 2002). Boxwork, a vuggy, honeycomb rock with pores where sulphides used to be, is a good place to look because gold is inert and may stay in place after the sulphide is leached away. Rust alone proves nothing, though: it says sulphide was present, not that gold was.
3. Check the mineral set
Low-sulphide gold-quartz veins contain no more than about 2 to 3 per cent sulphide by volume, mainly pyrite, in rocks that have been metamorphosed to greenschist grade. Wall rocks hold abundant carbonate, sulphide, quartz and sericite (fine white mica), and arsenic and antimony are enriched in the alteration halo (USGS Open-File Report 95-0831, model 36a). The USGS deposit model lists quartz, carbonates, albite, sericite and pyrite as the main minerals, with minor tourmaline, arsenopyrite, scheelite and molybdenite, and says no significant copper, lead or zinc occurs. Intense carbonate alteration is always present (USGS Open-File Report 03-077). Carbonate in the host rock, a pale rim around the vein, is therefore a strong clue.
4. Do not expect to see the gold
Gold in these deposits may be native, may occur as gold telluride, or may be invisible, held as nanoinclusions or locked inside sulphide crystals such as pyrite or arsenopyrite (USGS Data Report 1198). A vein with no visible gold can still assay well, and a vein with a few specks can be a poor target. Only an assay tells you the grade, so sample the vein and the altered wall rock on both sides.
5. Find the shoots
Many veins have sporadic gold with local ore shoots, and the Wyoming survey says shoots can run 100 to 1,000 times the average vein value. It recommends looking for places where pressure dropped: fold closures and vein intersections (Hausel, 2002). Record the plunge of any shoot, because that tells you which way to step out. Our guide to gold vein mining covers grades and lode claims, and the gold identification in rocks page lists hand-sample checks.
Prospecting safety: get the landowner’s or licence holder’s permission before you sample, and never use mercury. The USGS notes that mercury amalgamation is a serious health hazard and contamination source, and that weathering arsenopyrite can release arsenic (USGS Open-File Report 95-0831).
How to spot gold-bearing structures on maps, magnetics and satellite data
Structures leave signatures that survive under soil, scrub and cover. Use them in this order, cheapest first.
- Geological maps and old workings. Government survey maps show mapped faults, shear zones and contacts. Old pits often line up along the structure; Hausel shows a shear in the Southern Cross district of Australia that has been prospected almost end to end.
- Aeromagnetic surveys. Flight-line magnetic data show faults, shears and their intersections as linear breaks and offsets. A 2024 study in central Tanzania ran line detection and the Centre for Exploration Targeting method on high-resolution aeromagnetic data, found that most faults, shears and fracture systems trend north-east to south-west, north-south or north-west to south-east, and flagged structural intersections as targets. The result matched known gold workings, including the Shanta Gold Mine (Pius and Msabi, Tanzania Journal of Science, 2024). Alteration can also destroy magnetite, so a vein halo may show as a magnetic low where the host rock contained some magnetite (USGS Open-File Report 95-0831).
- Resistivity and electromagnetic surveys. Silicified rock and carbonate along veins raise density and resistivity, which lets ground surveys pick out sulphide-bearing wall rock (USGS Open-File Report 95-0831).
- Satellite imagery. Optical and radar images map straight valleys, ridge offsets and drainage kinks that follow faults, and spectral bands can map iron-oxide staining, clay and mica minerals that mark alteration. Satellites map surface and near-surface signatures; sampling and drilling confirm what is below. For how sensors compare, see our remote sensing sensor guide.
The rule that keeps this honest: a lineament (a straight line on an image) is only a candidate. Confirm it as a real fault or shear with a field visit, then check whether it bends, splays or crosses another structure. For a wider view of how Farmonaut uses imagery for early screening, see satellite-based mineral detection.

▶ What satellites can and cannot see: the rock around a deposit, including long straight cracks left by hot water. · 4:25
How to rank structures before you drill
If you hold a licence with several candidate structures, a simple scorecard keeps the choice honest. Score each structure from 0 to 2 on the points below, write down the evidence, and drill the highest scorers first.
- Is it a real structure? Mapped on the geological map or seen in outcrop, not just a lineament on an image.
- Does it have the right neighbours? Sits on or next to a regional break, as a splay or branch (Morey and others, 2007; Ayer, 2019).
- Is there a geometric trap? A bend, jog, duplex, fold hinge or intersection where fluid could slow down.
- Is there a strength contrast? Stiff rock against soft rock beside the structure.
- Does the alteration fit? Carbonate, sericite and sulphide along the structure, and the arsenic-antimony halo if you have geochemistry.
- Is there gold in the ground? Soil or rock-chip assays, old workings or artisanal pits along strike.
- Is it big enough? Strike length and width that could hold a mineable tonnage (use the calculator below).
Then plan holes across the structure, not along it. Drill from the side that cuts the dip at a good angle, so the core shows true width. Many dry holes come from drilling the right structure at the wrong angle or in the wrong place along strike; see our guide to why exploration holes come up dry. A satellite and magnetic screen is cheapest at this stage, because it narrows the ground before any rig is booked. Farmonaut’s satellite mineral report is built for that step: you send a licence boundary, and the report maps alteration, faults and fractures as exploration targets in 5 to 20 business days. You can see what such a report contains in our mineral exploration report sample.
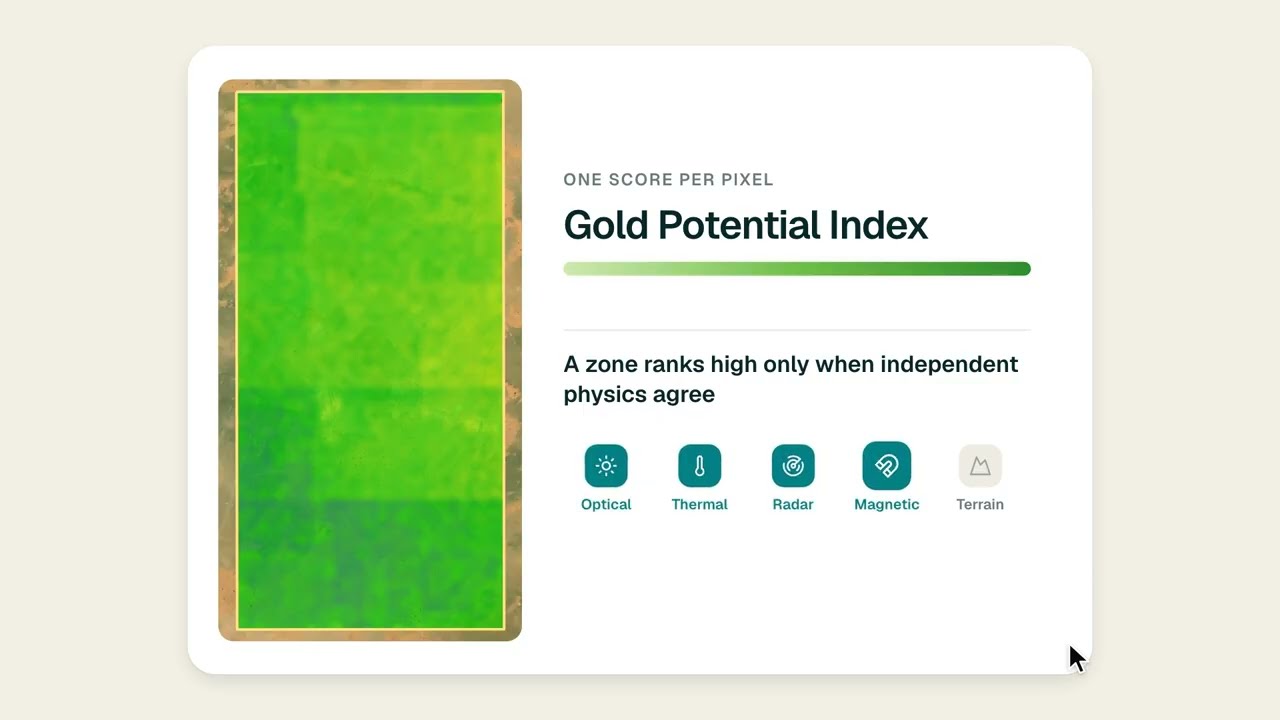
▶ Where on a licence to drill first, screened from orbit before a rig moves. · 1:46
Grade and size: a quick tonnage check
Many gold-bearing structures are long and narrow. The grade of an orogenic deposit is generally above 1 to 2 g/t and commonly above 10 g/t, compared with under 1 g/t for the lower-grade intrusion-related systems of the same Yukon-Alaska province (USGS Scientific Investigations Report 2007-5289). The chart below plots four selected deposits from that province that USGS describes as orogenic or as fault- or thrust-hosted: Donlin Creek holds the most gold at a modest grade, while Pogo and Cleary Hill grade 19 to 34 g/t on smaller endowments.
Chart
Grade against size, selected orogenic and fault-hosted deposits
Four lode gold deposits of the Tintina Gold Province, Alaska and Yukon: Donlin Creek and Pogo (orogenic per USGS), Cleary Hill and True North (fault- or thrust-hosted in schist)
The calculator below turns three structural measurements into a rough tonnage and ounce figure. It is arithmetic on your own numbers, an exploration target and not a resource, and it needs true width, so measure width across the structure and not along a drill hole.
Calculator
How much gold could this structure hold?
Enter your own measurements for one candidate structure; the page starts with example numbers.
- Ore tonnes in the target: 224,000
- Contained gold in kilograms: 1,120
Example values only, not a benchmark and not a resource: an exploration-target sum from length, true width, depth, rock density and grade. The ore share is an assumption because gold in veins is sporadic (Wyoming State Geological Survey). 2.8 t per cubic metre is a typical example density for hard rock.
Why many shear zones carry little gold
A shear zone is a necessary host, not a sufficient one. Common reasons for a barren or weak structure:
- No fluid. Without a deep source of gold-bearing fluid, the best structure stays empty.
- Simple structure. The Bardoc example above shows a broad, once-deformed belt with ten times less gold than its linked neighbour.
- Wrong chemistry. The fluid needs iron-rich or carbon-rich rock to react with; otherwise gold stays in solution and moves on (USGS Data Report 1198).
- Wrong timing. Gold must arrive after the structure forms. Morey and others found that later faults at Bardoc cut and post-dated the gold.
- Erratic distribution. Even in a good vein, grade is sporadic, so one poor hole does not kill a structure and one good hole does not prove it.
Resources and results: everything on this page describes exploration targets and geological reasoning. A mineral resource under JORC, NI 43-101 or SAMREC needs drilling, assay data and a qualified person.
Frequently asked questions
What is a shear zone in geology?
A shear zone is a band of rock where deformation has been concentrated by sliding of one block past another. It can be centimetres to kilometres wide and often shows foliation and stretching lineations. Unlike a single sharp fault, it records gradual flow of the rock.
Why does gold occur in shear zones?
Shear zones act as pathways for gold-bearing fluids that rise from deep, metamorphosed rock. According to the USGS, the gold is deposited mainly in lower-order faults and traps beside the main structure, where pressure drops and iron- or carbon-rich rock strips sulfur from the fluid.
What is orogenic gold?
Orogenic gold is gold that formed in veins and shear zones during mountain-building. Researchers estimate such deposits account for about one-third of world gold production (Nassif and others, 2022). Examples include Timmins and Kirkland Lake in Canada and Kalgoorlie in Western Australia.
How do you identify gold veins in the field?
Find a structure first, then look along it for quartz veins with rust stains, boxwork, carbonate alteration and sulphides such as pyrite or arsenopyrite. Gold may be invisible, so take channel or chip samples of the vein and the altered wall rock and send them for assay.
How to find gold veins on your own land?
Check the geological survey map for faults and contacts, walk the outcrop for gossan and quartz float, and sample along strike. Get permission or a licence first. If you hold a licence and want a desk screen, a satellite mineral report can map alteration and structures across the whole area before you spend on fieldwork.
What does gold-bearing quartz look like?
It is usually milky white to grey, often with rust-stained fractures and small amounts of pyrite or arsenopyrite. Many gold-bearing veins carry only 2 to 3 per cent sulphide (USGS Open-File Report 95-0831). Visible gold can be absent, so appearance alone is not a test.
Do all shear zones contain gold?
No. In Western Australia, two linked shear systems cut similar rocks, yet one produced more than 1,500 tonnes of gold and the other about 100 tonnes (Morey and others, 2007). Geometry, deformation history and fluid supply all matter.
What is the difference between a gold-bearing shear and a quartz vein?
The shear is the host structure; the veins are what fills the openings inside it. Many orogenic deposits are complex quartz vein arrays formed by fluid flow along transcrustal fault zones (Nassif and others, 2022). A vein can occur without a large shear, but the largest deposits sit on one.
Can satellites detect shear zones?
Satellites can map the surface expression of structures: lineaments, drainage offsets and alteration minerals such as iron oxide and clay. They cannot see gold, and a lineament must be confirmed on the ground. Aeromagnetic data often sharpen the picture of structures hidden under cover.
How wide is a gold-bearing shear zone?
It varies widely. The Boulder-Lefroy system in Western Australia is under 2 km across strike, while the Bardoc zone spreads over more than 5 km (Morey and others, 2007). The ore itself usually sits in narrow veins and lodes, often only metres wide, inside those corridors.
Which minerals travel with gold in a shear zone?
Pyrite and arsenopyrite are the usual companions, with carbonate, sericite and sometimes tourmaline or scheelite. Arsenic and antimony are enriched in the alteration halo, and base metals are generally absent (USGS Open-File Reports 95-0831 and 03-077).
Not investment advice.
This page is for information only. It is not investment advice. Results described are geological examples and exploration targets, not resources or reserves. Always get the landowner’s or licence holder’s permission before prospecting, and never use mercury.
Farmonaut mining
Screen your licence for structures before you drill
Send a licence boundary and we will quote a satellite mineral report that maps alteration, faults and fractures as exploration targets.

Mining Pro sample view, synthetic data
Sources
- USGS, Critical Minerals in Orogenic (Gold) and Coeur d’Alene-Type Mineral Systems (Data Report 1198): pubs.usgs.gov
- Nassif and others, Formation of orogenic gold deposits by progressive movement of a fault-fracture mesh, Scientific Reports (2022): ncbi.nlm.nih.gov
- Morey, Weinberg and Bierlein, Structural controls of gold mineralisation within the Bardoc Tectonic Zone, Mineralium Deposita (2007): link.springer.com
- Ayer, Laurentian University, Tectonic Setting and Timing of Gold in the Superior Province (2019): merc.laurentian.ca
- Wyoming State Geological Survey, Searching for Gold in Wyoming (Information Pamphlet 9, 2002): wsgs.wyo.gov
- USGS, Low Sulfide Au Quartz Veins, model 36a (Open-File Report 95-0831): pubs.usgs.gov
- USGS, Low-Sulfide Quartz Gold Deposit Model (Open-File Report 03-077): pubs.usgs.gov
- Pius and Msabi, Ikungi-Manyoni aeromagnetic study, Tanzania Journal of Science (2024): tjs.udsm.ac.tz
- Geoscience Australia, Archean gold mineral systems in the eastern Yilgarn Craton, AusGeoNews 100 (2010): ga.gov.au
- USGS, Geology and Origin of Epigenetic Lode Gold Deposits, Tintina Gold Province (SIR 2007-5289-A): pubs.usgs.gov
Discussion
Questions, corrections or field experience? Share them below. First-time comments are reviewed before they appear, and your email is never published.
No comments yet. Be the first to add a question or your experience.

 Klusetic Mining Investments
 Mine4Africa
 Lithspo Minerals Limited
 Tintina Mining Group
 Dalgety Minerals Pty Ltd
 Vortex Minerals Pty Ltd
 Faith At Work (Pty) Ltd
 Geotech Mining Solutions plc
 Vulcan International Limited
 Kidepo Associates
 GKY Mining
 Alkimy SARL
 Double A Trading
 GemSprout Metals Limited
 Qader Group
 Ileys General Trading
 SG Gold Mining LLC
 VRV Global Pte Ltd
 Omsri International FZE
 G.I.T.T.
 Jaunita Erss Ltd
 Almosi SARL
 SRK Consulting
 Berks Gold Limited
 Mwerezi Minerals Company Limited











