

US geology data · Map guide
Geological Map of the USA: USGS and State Maps
The best national geological map of the USA is the USGS State Geologic Map Compilation, which joins 48 state maps at scales from 1:50,000 to 1:1,000,000. Use state survey maps for claim-scale detail.
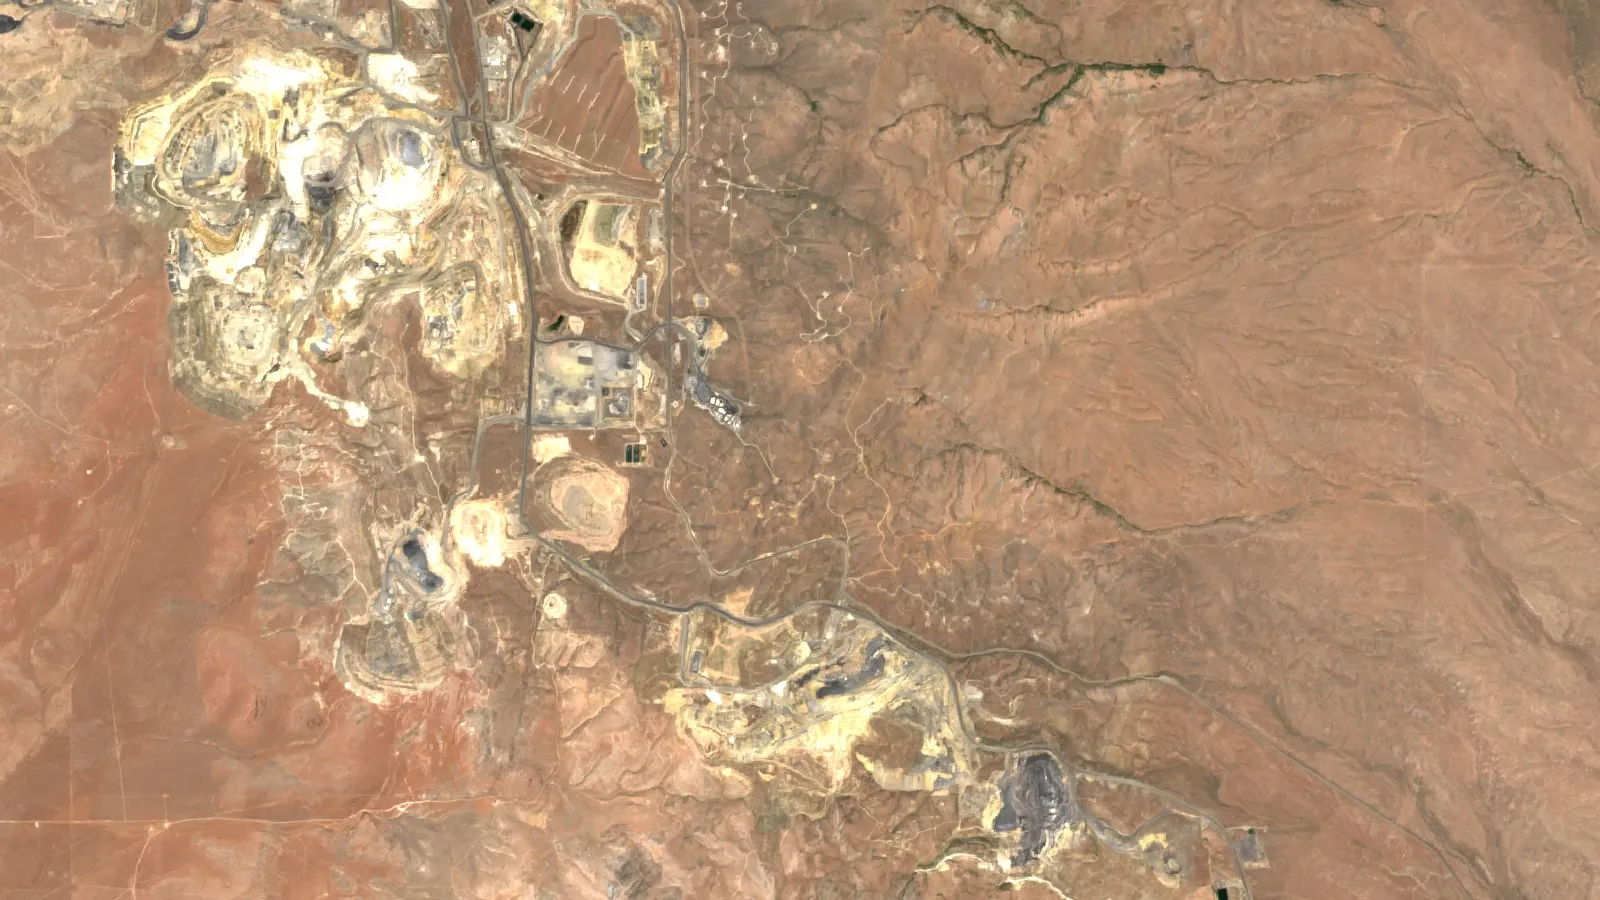
Key takeaways
- The USGS State Geologic Map Compilation joins 48 state geologic maps into one database; its units are not matched across state lines (USGS, Data Series 1052).
- Scale decides use: 1 cm on a 1:500,000 map covers 5 km, so a vein 3 m wide cannot be drawn to true width.
- Open the USGS state map viewer or NGMDB MapView for an interactive geologic map; state surveys such as Utah and Washington run newer portals.
- Statewide maps differ in age: Nevada’s 1:500,000 map dates from 1978, Idaho’s 1:750,000 map from 2012 (state survey records).
- A geologic map does not show claims; check BLM’s Mineral and Land Records System before planning fieldwork.
In this article
- Which geological map of the USA should you use?
- Interactive geologic map: where to open one
- The USGS State Geologic Map Compilation explained
- NGMDB, Geolex and TopoView: finding the detailed map
- State geologic maps and survey portals
- Map age matters more than most people expect
- How to read a US geologic map
- Convert a map measurement to ground distance
- From geologic map to mineral targets
- US copper mine output, a map-driven industry
- Check claims on federal land before you rely on a map
- Adding satellite data to a geologic map
- Neighbours and other countries
- Common mistakes when using US geologic maps
There is no single geological map of the USA. The country is covered by a stack of maps made at different scales by different agencies, and the right one depends on your question. For the whole country, the best digital starting point is the USGS State Geologic Map Compilation, which joins 48 state geologic maps into one database. For one county or one claim block, you need the state geological survey’s own map, often at 1:24,000 scale. This guide lists every national and state map worth knowing, shows where to open each as an interactive map, and explains how an explorer or claim owner reads them.
The USGS (United States Geological Survey) publishes the national maps and data. The 50 state geological surveys, which are separate state agencies, publish most of the detailed work. A geologic map shows the types and ages of rocks and younger deposits found at or near the surface, plus faults and folds. That is different from a mining map, which shows where mines are. If you want active mines by state, see our US mining map guide; this page is about the rock map underneath.
Which geological map of the USA should you use?
Match the map to the size of the area you care about. Small-scale maps show the whole country on one sheet but cannot show a single mine. Large-scale maps show detail but cover only a small area. The table lists the national maps in order from the coarsest to the most detailed.
| Map or database | Scale | Publisher | Best for |
|---|---|---|---|
| Geologic Map of North America (Reed and others, 2005; GIS version USGS Data Series 424) | 1:5,000,000 | Geological Society of America; USGS | Continent-wide context and teaching |
| Geologic Map of the United States, exclusive of Alaska and Hawaii (King and Beikman, 1974) | 1:2,500,000 | USGS | One-sheet view of the lower 48 states |
| Geologic map of Alaska (Wilson and others, 2015) | 1:1,584,000 | USGS | Statewide Alaska geology with a digital database |
| State Geologic Map Compilation (SGMC) | Source maps from 1:50,000 to 1:1,000,000; typically 1:500,000 | USGS | GIS work across several states: lithology, age and stratigraphy |
| NGMDB map catalog and MapView | Mostly 1:24,000 to 1:500,000 | USGS with state surveys (AASG) | Finding the most detailed published map for a place |
| State survey maps and portals | 1:24,000 up to 1:1,000,000 | State geological surveys | County and claim-scale work |
The oldest map in the table is still useful. The 1974 King and Beikman map was published at 1:2,500,000 on two plates, and the USGS later turned it into a digital layer with the same scale. The USGS warns that its national geology layers are meant for the study of large areas and are not suitable for detail at a specific locality (USGS Mineral Resources Online Spatial Data, Geology). That warning applies to every small-scale map on this page.
The Geologic Map of North America sits at the far end of the range. It was compiled at 1:5,000,000 and the USGS database notes topology problems appear when the data are viewed at scales far more detailed than 1:5,000,000 (USGS Data Series 424). Use it to understand which belts of rock run from Canada into the United States, not to judge a claim.
Interactive geologic map: where to open one
You can open a geologic map of the USA in your browser without installing GIS software. Four places are worth bookmarking.
- USGS state geologic map viewer. The USGS Mineral Resources Online Spatial Data site has an interactive map of the conterminous US and a separate one for Alaska, built on the State Geologic Map Compilation. The same data is offered as WMS, WFS and WMTS web services, so you can add it as a layer in QGIS or ArcGIS (USGS, Geologic maps of US states).
- NGMDB MapView. The National Geologic Map Database runs MapView, which at the time of writing is a beta version. It lets you filter maps by scale bin (500K, 250K, 125K, 100K, 62K, 48K and 24K) and promote bedrock or surficial maps on screen. It lists maps from the USGS and the state surveys (NGMDB MapView).
- State portals. Utah, Washington, Idaho, Oregon, Wyoming, Alaska and several other states run their own viewers. They are the only source for the newest field mapping. The table below links each one.
- Macrostrat. This web explorer shows a stratigraphic column, a stack of named rock units, for the place you click. It is a quick way to learn what formations sit under a point before you look at a detailed map (Macrostrat).
A practical tip: start in MapView, set the scale filter to 24K or 100K, and see whether a detailed map exists for your area. If it does, download that map from the state survey, because the national compilation will have simplified it.
The USGS State Geologic Map Compilation explained
The SGMC is the nearest thing to a single digital geological map of the lower 48 states. It is one continuous spatial database of 48 state geologic maps, drawn from sources at scales between 1:50,000 and 1:1,000,000. The USGS standardised the data from each state so you can analyse lithology (rock type), age and stratigraphy (the order of rock layers) at national scale (Horton and others, USGS Data Series 1052).
There are three limits you should know before using it.
- Units are not matched across state lines. The authors state that the SGMC is not a truly integrated database, because geologic units were not reconciled across state boundaries. A formation can change name, colour or even type at the border simply because two survey teams described it differently.
- The scale is small. The USGS describes the scale as typically 1:500,000 (USGS geology data catalog). At that scale, 1 cm on the map covers 5 km on the ground.
- Alaska, Hawaii and Puerto Rico are separate. Alaska has its own compilation. Hawaii has a detailed map database that is not arranged like the state compilation, and Puerto Rico has its own geology data. Data for the District of Columbia is bundled with Maryland.
On the download side, the USGS offers the full set as a file geodatabase (about 415 MB), as shapefiles (about 634 MB), as CSV attribute tables and as a KML file, plus a zip file per state (USGS, Geologic maps of US states). Each state is also offered as a KMZ file you can open in Google Earth, which suits a quick check on a single area.
NGMDB, Geolex and TopoView: finding the detailed map
The National Geologic Map Database (NGMDB) is the catalogue behind most USGS geologic maps. It is supported by the National Cooperative Geologic Mapping Program, which works with state surveys. Each map has a product page with its title, authors, series number, publication date and scale, and often a PDF or GIS download. That is how you find the year of the mapping, which matters because geology that was mapped in the 1970s can differ from a modern map of the same ground.
Two companion tools help you read what you find.
- Geolex is the USGS national lexicon of geologic names. It is a compilation of names and descriptions of geologic units, searchable by unit name, state or geologic age. When a legend says “Kaibab Formation” or “Anaconda”, Geolex gives its description and age range (NGMDB Geolex).
- TopoView shows the historical USGS topographic map collection. The USGS began mapping the nation’s topography in 1879, so old quadrangles can show prospect pits, shafts and mill sites that modern maps no longer print (USGS TopoView).
For how scales, contacts and cross-sections work in general, our guide to geological mapping methods and scales goes into more depth than this page. For maps that show the loose sediments on top of the rock, see our guide to surficial geology maps.
State geologic maps and survey portals
State surveys do the field mapping. The Association of American State Geologists (AASG), founded in 1908, represents the state geologists of the states and Puerto Rico and links to every survey’s website (AASG). The table covers 15 states that matter most for mineral exploration. Statewide scales and years are as listed on each survey’s own pages.
| State | Survey | Statewide geologic map | What the portal offers |
|---|---|---|---|
| Nevada | Nevada Bureau of Mines and Geology | 1:500,000 map (Stewart and Carlson, 1978); 1:250,000 map (USGS Data Series 249, Crafford, 2007) | Open data site with web maps and streaming GIS layers; published maps and data packages; historical maps and records |
| Arizona | Arizona Geological Survey | Map 35 (2000), 1:1,000,000 | Mining data site with historic mine files, photographs and maps; directory of active mines; interactive Grand Canyon map |
| Alaska | Division of Geological and Geophysical Surveys | USGS Geologic map of Alaska (2015), 1:1,584,000 | Geologic map index of DGGS and USGS maps, geochemistry database, geophysics map and sample inventory |
| California | California Geological Survey | Geologic Map of California (2010), 1:750,000 | Online map service with faults, folds, rock types and unit labels |
| Idaho | Idaho Geological Survey | Geologic Map of Idaho (2012), 1:750,000, with digital download | Interactive map with geology, mines, geothermal, geochemistry and oil and gas; mines database search |
| Montana | Montana Bureau of Mines and Geology | Geologic Map 62 (2007), 1:500,000 | Map service with geologic lines, contacts and units at 1:500,000 |
| Wyoming | Wyoming State Geological Survey | Use the geologic map index to find WSGS and USGS maps | Interactive maps for mineral resources, geologic map index, hazards and more |
| Utah | Utah Geological Survey | 1:500,000 statewide map (1980) | Interactive Geologic Map Portal with about 800 maps at 1:500,000, 1:50,000 to 1:125,000 and 1:24,000; 2D and 3D views; GeoJSON export |
| Colorado | Colorado Geological Survey | Geologic Map of Colorado (Tweto, 1979), digitised by the USGS at 1:500,000 | Web maps and data for historic metal mining districts, radioactive mineral occurrences and mineral resource potential |
| New Mexico | New Mexico Bureau of Geology and Mineral Resources | Geologic Map of New Mexico (2003), 1:500,000 | PDF map and explanation as downloads; GIS data in a standard geodatabase schema; geologic highway map at 1:1,000,000 |
| Oregon | DOGAMI | Oregon Geologic Data Compilation (OGDC) | Interactive map showing part of release 6; geodatabases for releases 6, 7 and 8 |
| Washington | Washington Geological Survey | 1:100,000 surface geology for the state | Geologic Map Finder, geologic information portal, geodatabases, web services and Google Earth overlays |
| South Dakota | South Dakota Geological Survey | Geologic map of South Dakota (G-10, 2004), 1:500,000 | PDF map (10.3 MB) and GIS files (56 MB); online interactive maps and story maps |
| Minnesota | Minnesota Geological Survey | Geologic map of Minnesota, bedrock geology (S-21, 2011), 1:500,000 | State Map Series sheet catalogued in the NGMDB with download links; check the survey for newer county and quadrangle maps |
| Michigan | State of Michigan geology data | Bedrock geology drawn from the 1987 bedrock map of Michigan | GIS feature class of bedrock formations for the Upper and Lower peninsulas |
Several facts in the table change how you should use the maps. Montana’s statewide map and Michigan’s 1987 bedrock layer are meant for regional work. Utah’s survey says its maps’ positional precision runs from a few feet to more than 300 feet and tells users to verify accuracy before making important decisions (Utah Geologic Map Portal). Colorado adopted the USGS GeMS database standard for its mapping in 2020, which makes newer Colorado maps easier to load into GIS.
Map age matters more than most people expect
A statewide map is a compilation of earlier field work, so its age tells you how much new mapping, dating and geophysics it leaves out. Nevada’s main statewide map is from 1978 and Utah’s statewide map is from 1980, while Idaho’s was updated in 2012 using the research released since its 1978 predecessor. The chart plots the age and scale of eight statewide maps listed in the table, counted to 2026.
Chart
Age and scale of eight statewide geologic maps
Scale shown as the map’s denominator in thousands (500 = 1:500,000)
Newer is not always more detailed. California’s 2010 map and Idaho’s 2012 map are both at 1:750,000, which is coarser than the half-million-scale maps of Nevada, Utah, New Mexico, South Dakota and Montana. When you can, use the state map for orientation and then look for a 1:24,000 or 1:100,000 quadrangle map of your own ground.
How to read a US geologic map
A geologic map looks like a coloured patchwork, but it follows strict rules. Read it in this order.
Chart
Ground distance covered by 1 cm of map
Kilometres on the ground, at scales used by USGS and state surveys
- Check the scale and the date. The scale is printed on the sheet or in the database record. The date tells you what the compilers knew.
- Read the legend, called the map unit list. Each coloured area is a map unit: a body of rock or sediment that the mapper could follow across the ground. Units are usually listed from youngest at the top to oldest at the bottom.
- Decode the label. Most units carry a short letter code, and the first letters usually give the age. Q means Quaternary (the last 2.6 million years), K Cretaceous, J Jurassic, and so on. The USGS Geologic Names Committee publishes the standard divisions of geologic time (USGS Fact Sheet 2018-3054).
- Follow the lines. Contacts are the boundaries between units. Faults are drawn as heavier lines, often with symbols that show which side moved down. The federal geologic data committee has published a single national standard for these symbols (FGDC Geologic Data Subcommittee).
- Read the strike and dip symbols. Strike is the compass direction of a rock layer on a flat surface. Dip is how steeply it tilts. A small tick on the strike line points the way the layer tilts.
- Use Geolex for the names. If a unit name is unfamiliar, search it in Geolex to learn its rock type and age range.
Scale controls what you can see. A line drawn 0.5 mm wide on a 1:500,000 map covers about 250 m of ground, so a vein 3 m wide cannot appear at true width. The chart shows how much ground 1 cm of map covers at common scales, and the calculator converts your own measurements.
Convert a map measurement to ground distance
Use the calculator below when you measure a distance on a printed map or on screen. It also shows how wide a drawn line is on the ground, which tells you whether a small feature could even be shown at that scale.
Calculator
How far is that on the ground?
Enter the map scale, a distance you measured and the width of a drawn line.
- Ground distance in miles: 9.3 mi
- Ground width of the drawn line: 250 m
Example values only, not a benchmark. Ground distance = map distance x scale. 1 mile = 1.609344 km. Use the scale printed on your map.
From geologic map to mineral targets
A geologic map does not show ore. It shows the rock framework where ore can form. Explorers use it in a fixed sequence.
- Pick the host rocks. Different deposit types prefer different rocks. Look for the units that host the commodity you want, such as intrusive bodies for porphyry copper or certain sedimentary rocks for stratabound deposits.
- Trace the faults. Faults and folds often control where hot fluids moved. Mark where faults cross the host unit or where two fault sets meet.
- Overlay known mines and occurrences. The USGS Mineral Resources Data System (MRDS) describes metallic and nonmetallic resources with deposit name, location, commodity and references. The USGS says it stopped systematic updates to MRDS in 2011 and is building a new database for the conterminous US, so treat MRDS as a good historical record and check it against newer sources (USGS MRDS). For Alaska, the Alaska Resource Data File is the more complete record.
- Add the USMIN layer. The USMIN Mineral Deposit Database is a developing national-scale database of the most important mines, deposits and districts, and you can download records by commodity such as lithium, cobalt and graphite (USGS USMIN). A related USGS layer holds prospect pits, shafts, adits, quarries and tailings piles digitised from historical topographic maps in the western states (USGS topographic-map mine symbols).
- Add geophysics and new mapping. The USGS Earth Mapping Resources Initiative (Earth MRI), run with the state surveys, combines modern geologic mapping, airborne geophysical surveys and lidar elevation data to find areas that may contain undiscovered critical mineral resources (USGS Fact Sheet 2019-3007). Its data releases are one of the quickest ways to get recent magnetic and radiometric data over a state. The video below shows how a 3D geologic scene is built from terrain, depth and grade layers, using de-identified demonstration data.
- Check who owns the minerals and the surface. Rock type tells you nothing about land status. See the claims section below.
For the numbers behind the map, the USGS reports that Arizona accounted for about 70% of 2025 US copper mine output and Nevada for about 64% of gold, with Alaska next at about 22% (USGS Mineral Commodity Summaries 2026, copper; gold). Those shares follow the geology: the metals concentrate where the right rocks, faults and intrusions are. Copper is also mined in Alaska, Michigan, Missouri, Montana, Nevada, New Mexico and Utah, which lines up with the state surveys in the table above.
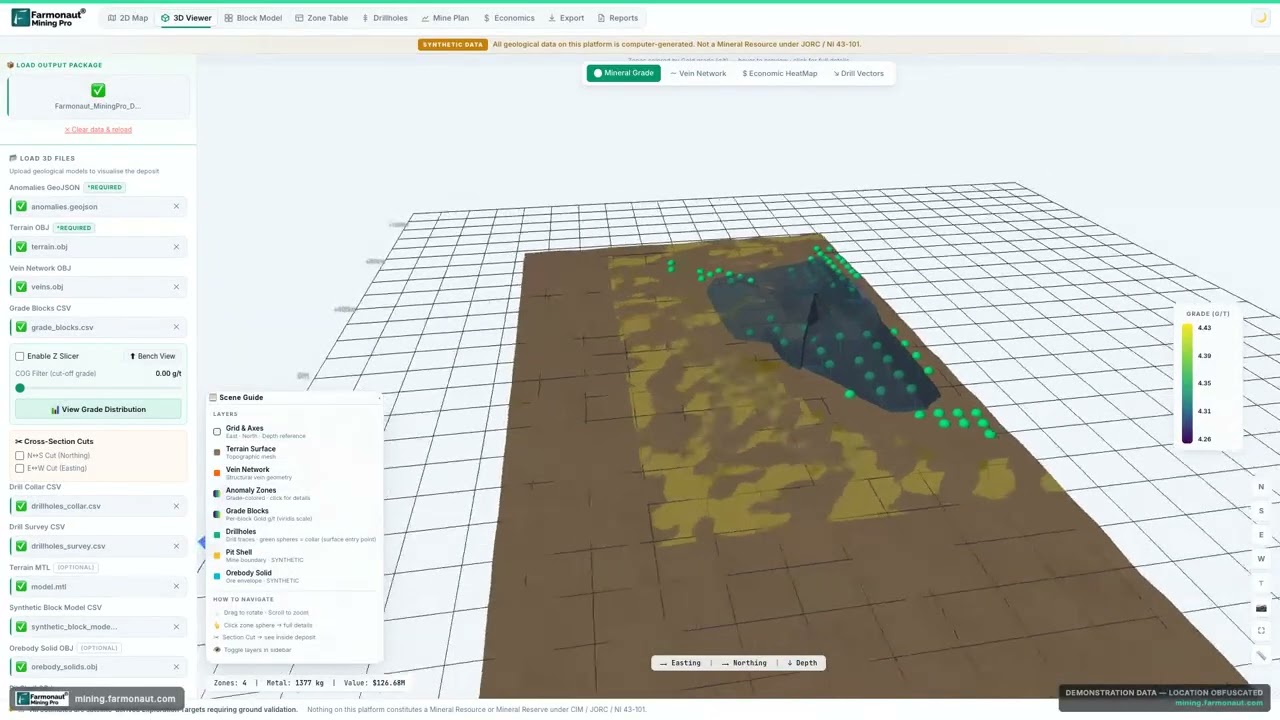
▶ A 3D geological scene built from satellite data, with terrain, depth and grade layers (de-identified demonstration data). · 5:12
US copper mine output, a map-driven industry
US copper output has drifted down in the USGS series. Recoverable mine production was 1.23 million tonnes in 2021 and 2022 and an estimated 1.0 million tonnes in 2025. The USGS notes that 26 mines produced copper and that 17 of them made more than 99% of the total. A short list of mines means a short list of geologic settings, which is why a detailed map of the right district can matter more than a national one.
Chart
US copper mine production, 2021 to 2025
Thousand metric tons of recoverable copper
For a worked example of how an exploration team reads rock units in three dimensions, see our guide to 3D geologic maps and how to read depth from dip.
Check claims on federal land before you rely on a map
A geologic map does not show land status. Whether you can stake, buy or explore a piece of ground depends on who owns the surface and the minerals. On federal land, claims are recorded by the Bureau of Land Management (BLM) in the Mineral and Land Records System (MLRS). BLM states that MLRS replaced and integrated several older systems, including LR2000, and covers mining claims, solid minerals, geothermal and other case types (BLM, Mineral and Land Records System). BLM’s page also points mining claimants to its guides and a help centre.
A sensible order is: choose a target on the geologic map, check land status and existing claims in MLRS, then confirm permission and rules with the BLM state office or the state agency before any site work. For a plain-English walk-through of what owning a claim does and does not give you, the video below covers the 1872 mining law and how to check the ground first.
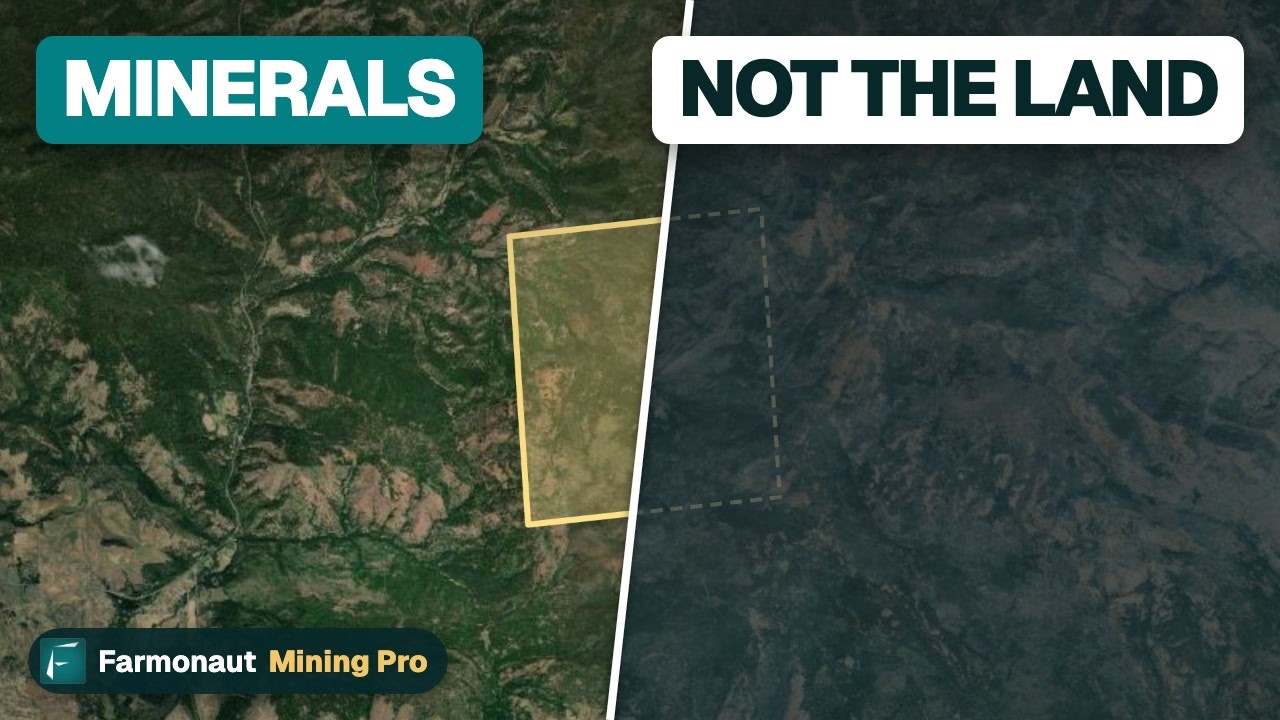
▶ Owning a claim is not owning the land: the 1872 mining law and how to check ground before you buy. · 3:19
Adding satellite data to a geologic map
Geologic maps are drawn from field visits, so the rocks between traverses are interpreted. Satellite imagery gives a second, independent view of the surface: iron-oxide staining, clay and mica alteration minerals, silica and lineaments that look like faults. Satellites map surface and near-surface signatures, and sampling and drilling confirm them. An explorer can place those signatures on top of the state geologic map to see whether they follow a favourable rock unit or fault.
Farmonaut Mining prepares a satellite mineral report for a licence or claim boundary you supply as a KML, KMZ or polygon, delivered in 5 to 20 business days. Results are exploration targets, not a JORC, NI 43-101 or SAMREC resource. To compare satellite methods with ground methods, see satellite vs geochemistry vs geophysics.
Neighbours and other countries
If your project crosses the border or you compare US data with Canada, two of our guides cover the main public geoscience portals: the Ontario Geological Survey, MINFILE and SIGEOM guide and the guide to the BC Geological Survey and other agencies. For a world view, see our world mineral deposits map guide.
Common mistakes when using US geologic maps
- Using a small-scale map for a site decision. A half-million-scale map is for regional ideas. For a claim, use 1:24,000 or 1:100,000 where it exists.
- Crossing a state line without checking. SGMC units are not reconciled across borders, so a unit boundary that stops at the state line may be a mapping choice, not geology.
- Trusting an old map as current. Check the publication year in the NGMDB record or on the survey page.
- Reading a coloured unit as ore. A unit that hosts deposits elsewhere is only a starting point. You still need samples, geochemistry and geophysics.
- Ignoring the map’s own caveats. State surveys and the USGS say their small-scale data are for regional study, not for site-specific decisions.
Frequently asked questions
Where can I find a geological map of the USA?
The USGS State Geologic Map Compilation (SGMC) is the main digital geological map of the lower 48 states, built from 48 state maps. You can view it in the USGS interactive map at mrdata.usgs.gov or download it as a geodatabase, shapefiles or KML. For a printed one-sheet view, the 1974 King and Beikman map at 1:2,500,000 covers the lower 48 states.
What is the best interactive geologic map?
For the whole country, use the USGS state geologic map viewer. To find the most detailed published map of a place, use NGMDB MapView and filter by scale. For the newest local mapping, use the state portal, such as the Utah Geologic Map Portal, the Washington Geologic Map Finder or the Idaho interactive map.
What scale is the United States geologic map?
It depends on the product. The King and Beikman map is 1:2,500,000, the Geologic Map of North America is 1:5,000,000, the SGMC is typically 1:500,000, and state and quadrangle maps run from 1:24,000 to 1:1,000,000.
Is there a United States geologic map for each state?
Yes. The SGMC includes 48 state maps, and Alaska has its own USGS map at 1:1,584,000. Each state survey also publishes its own statewide map and more detailed quadrangle maps. The AASG website links to every state geological survey.
What is the USGS geologic map?
The USGS publishes many geologic maps: national compilations, regional maps and thousands of detailed quadrangles. They are catalogued in the National Geologic Map Database, which also lists maps from state surveys. Search by place in MapView or by title in the catalogue.
What is the USGS mineral survey?
The USGS Mineral Resources Program studies the nation’s mineral supply and maps mineral resources. Its public products include the annual Mineral Commodity Summaries, the Mineral Resources Data System, the USMIN deposit database and the Earth MRI mapping and geophysics program.
Where do I find USGS geological survey maps for a single area?
Open NGMDB MapView, zoom to your area, filter by scale and open the product page of the map you want. For historical maps of the ground itself, use TopoView, which holds the historical USGS topographic maps.
Who runs the geological survey in each US state?
Each state has its own geological survey, such as the Nevada Bureau of Mines and Geology, the Arizona Geological Survey and the Utah Geological Survey. The Association of American State Geologists lists them all.
How do I use a geologic map to find minerals?
Identify the host rocks and faults that suit your commodity, overlay known mines and occurrences from MRDS and USMIN, add geophysical data such as Earth MRI releases, and check land status in BLM MLRS. The map narrows the search; sampling and drilling confirm what is there.
Can I download geologic map data for GIS?
Yes. The SGMC is offered as a geodatabase, shapefiles, CSV tables and KML, and as WMS, WFS and WMTS services. Many state surveys, including Washington, Oregon, New Mexico and Colorado, publish geodatabases or GIS packages.
Does a geologic map show mining claims?
No. A geologic map shows rocks and structures. Federal mining claims are recorded by BLM in MLRS, and state land has its own records. Check both before you plan fieldwork.
Which geologic map is best for gold or copper exploration?
Use the most detailed state or USGS map for your district, usually 1:24,000 to 1:100,000. Use the national maps to see the wider belts of rock that host the metal.
This page is for information only. It is not investment advice or legal advice. Confirm land status, permission and licensing with the landowner and the regulator before any site work.
Farmonaut mining
Put satellite data on top of the geology
Send a licence or claim boundary and request a quote for a satellite mineral report.
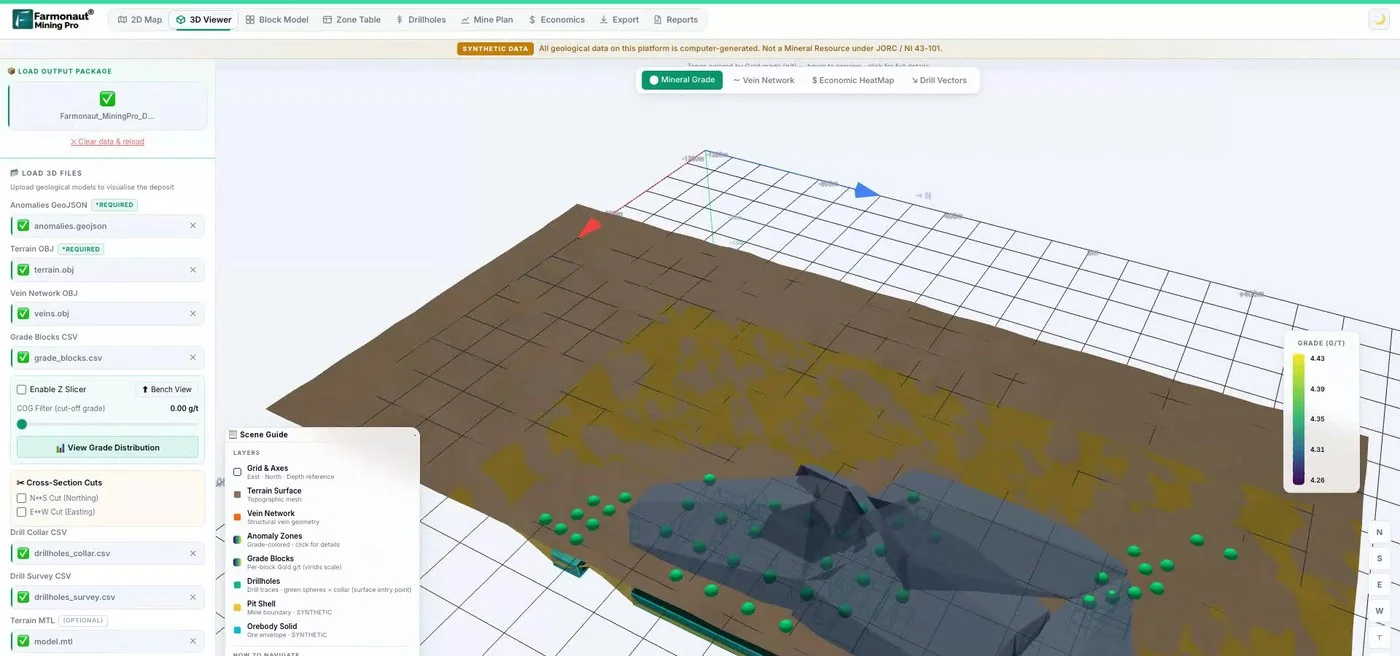
Mining Pro sample view, synthetic data
Sources
- USGS, State Geologic Map Compilation (SGMC) geodatabase, Data Series 1052: pubs.usgs.gov
- USGS, Geologic maps of US states (MRData): mrdata.usgs.gov
- USGS, Geology data catalog (MRData): mrdata.usgs.gov
- USGS, Geologic map of the United States, King and Beikman (1974): pubs.usgs.gov
- USGS, Database of the Geologic Map of North America, Data Series 424: pubs.usgs.gov
- USGS, Geologic map of Alaska, SIM 3340: pubs.usgs.gov
- USGS NGMDB, MapView: ngmdb.usgs.gov
- USGS NGMDB, Geolex: ngmdb.usgs.gov
- USGS NGMDB, TopoView: ngmdb.usgs.gov
- USGS NGMDB, FGDC Geologic Data Subcommittee: ngmdb.usgs.gov
- USGS, Mineral Resources Data System (MRDS): mrdata.usgs.gov
- USGS, USMIN Mineral Deposit Database: mrdata.usgs.gov
- USGS, Prospect- and mine-related features on topographic maps: mrdata.usgs.gov
- USGS, Earth MRI Fact Sheet 2019-3007: pubs.usgs.gov
- USGS, Divisions of Geologic Time, Fact Sheet 2018-3054: pubs.usgs.gov
- USGS, Mineral Commodity Summaries 2026: Copper: pubs.usgs.gov
- USGS, Mineral Commodity Summaries 2026: Gold: pubs.usgs.gov
- Association of American State Geologists: stategeologists.org
- BLM, Mineral and Land Records System: blm.gov
- Macrostrat: macrostrat.org
- Nevada Bureau of Mines and Geology: nbmg.unr.edu
- Nevada Bureau of Mines and Geology, Statewide geologic maps: nbmg.unr.edu
- Arizona Geological Survey, Geologic Map of Arizona: azgs.arizona.edu
- Alaska DGGS, Interactive maps: dggs.alaska.gov
- California Geological Survey, Geologic Map of California service: gis.conservation.ca.gov
- Idaho Geological Survey, Geologic Map of Idaho: idahogeology.org
- Idaho Geological Survey, Interactive map: idahogeology.org
- NGMDB, Geologic Map of Montana (Geologic Map 62): ngmdb.usgs.gov
- Montana Bureau of Mines and Geology, Geology 500k service: mbmgmap.mtech.edu
- Wyoming State Geological Survey, Interactive maps: main.wsgs.wyo.gov
- Utah Geological Survey, Interactive Geologic Map Portal: geomap.geology.utah.gov
- Colorado Geological Survey, GIS data and web map portal: coloradogeologicalsurvey.org
- New Mexico Bureau of Geology, Statewide geologic maps: geoinfo.nmt.edu
- DOGAMI, Geologic Map of Oregon: oregon.gov
- Washington Geological Survey, Geologic mapping: dnr.wa.gov
- NGMDB, Geologic map of South Dakota (G-10): ngmdb.usgs.gov
- NGMDB, Geologic map of Minnesota-bedrock geology (S-21): ngmdb.usgs.gov
- State of Michigan, Bedrock geology feature class metadata: mcgi.state.mi.us
- USGS, Geologic map of Colorado, Tweto (1979): pubs.usgs.gov
- USGS, Digital geologic map of Colorado, Open-File Report 92-507 Part B: pubs.usgs.gov
- USGS, Data Series 424 metadata: pubs.usgs.gov
Discussion
Questions, corrections or field experience? Share them below. First-time comments are reviewed before they appear, and your email is never published.
No comments yet. Be the first to add a question or your experience.

 GKY Mining
 Alkimy SARL
 Double A Trading
 GemSprout Metals Limited
 Qader Group
 Ileys General Trading
 SG Gold Mining LLC
 VRV Global Pte Ltd
 Omsri International FZE
 G.I.T.T.
 Jaunita Erss Ltd
 Almosi SARL
 SRK Consulting
 Berks Gold Limited
 Mwerezi Minerals Company Limited
 Mining SARL
 SenGold Invest SAS
 Sean Mining Limited
 NTS Group (Pty) Ltd

 Client · Oregon, USA · Gold










