

Reviewed September 2026 against USDA Economic Research Service, FAO Food Outlook, and the Irrigation Association.
Try it: Enter your numbers above to see an estimate. →
The Future of Farming Technology: What the Adoption Data Actually Shows

The future of farming technology is not a speculative headline — it is a measurable adoption curve already running through US Department of Agriculture (USDA) survey data. As of 2023, 27% of US farms reported using some form of precision agriculture practice, and on the largest crop operations that figure climbs past 70% for specific technologies like GPS autosteering. This article gives you the actual numbers behind that curve — by farm size, by technology type, and by region — plus a calculator to estimate what precision irrigation could save on your own acreage.
This is the frontier agriculture story in numbers rather than slogans: which technologies are already mainstream, which are still a minority practice, what they cost to run, and where the market is headed through the next decade.
Table of Contents
- US Precision Agriculture Adoption: The 2023 USDA Numbers
- Agriculture Precision Technology: Market Size and Growth
- Sustainable Food Technology: What “Efficient” Actually Means in Litres and Kilograms
- Global Food Production: The Supply Side of Food Security
- Precision Farming in South Africa and Eswatini
- AFGRI, Farmart, and Frontier Agriculture Ltd: Where Named Operators Fit
- Calculator: Precision Irrigation Savings Estimator
- Barriers to Adoption and How They’re Being Addressed
- Frequently Asked Questions
- Try it: Enter your numbers above to see an estimate.
US Precision Agriculture Adoption: The 2023 USDA Numbers
The USDA Economic Research Service’s Agricultural Economics and Land Ownership Survey (AELOS) is the most current benchmark for how much of US agriculture has actually adopted precision farming technology, and the 2023 figures show a clear size split rather than a uniform trend:
- 27% of all US farms used at least one precision agriculture practice in 2023.
- 52% of midsize crop farms used GPS guidance/autosteering systems.
- 70% of large-scale crop farms used GPS guidance/autosteering — more than double the all-farm average.
- 68% of large-scale crop farms used yield monitors and soil mapping.
- 31–37% of US corn, soybean, and winter wheat acreage was under variable rate technology (VRT) in 2023.
Source: USDA Economic Research Service, Charts of Note, chart 110550. USDA NASS refreshes this dataset through the AELOS survey, typically issued in December; check the same ERS chart page directly for whatever year’s release is current when you’re reading this, since the survey cadence means newer numbers may already exist.
The pattern here is unambiguous and durable regardless of what next year’s release shows: precision agriculture adoption scales with farm size, and GPS-guided steering is now a majority practice among midsize and large US crop operations, while whole-farm adoption of the full technology suite remains a minority (27%) practice. That gap — mainstream on large farms, minority everywhere else — is the actual state of “agriculture precision technology” in the United States, not the more sweeping claims often made about it. Costs and returns for specific tools are compared in an overview of precision farming solutions and ROI.
Agriculture Precision Technology: Market Size and Growth
Globally, the precision agriculture market was valued at $9.32 billion in 2024, and IMARC Group projects it will reach $21.47 billion by 2033 — a compound annual growth rate (CAGR) of 9.66% across 2024–2033. That is a market expected to more than double in under a decade, driven by GPS guidance, variable rate application, remote sensing, and farm management software.
Source: IMARC Group, Precision Agriculture Market Report. Market sizing firms including IMARC, GMInsights, Straits Research, BCC Research, and Fortune Business Insights republish these estimates annually — search “precision agriculture market size” plus the current year for the latest valuation and CAGR if you need a fresher figure than the one cited here.
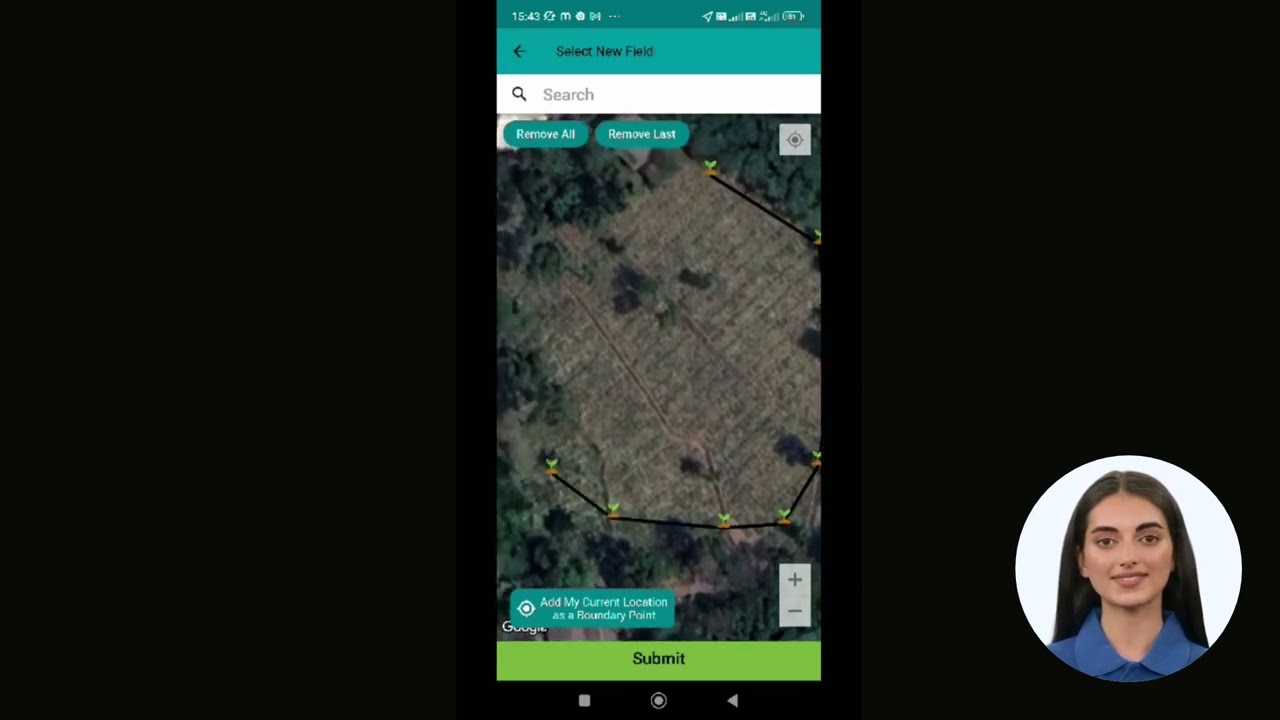
For context on why capital keeps flowing into this category: the technology categories driving that growth map directly onto what Farmonaut’s platform delivers to farm operators — satellite-based crop health monitoring, AI-driven advisory, and resource management — rather than requiring farmers to buy separate hardware for each function.
Farmonaut’s Technology Stack
- Satellite-Based Crop Health Monitoring: Multispectral satellite imagery delivers real-time insight into vegetation health, soil moisture, and other field-level metrics, supporting decisions on irrigation, fertilizer timing, and pest management without a farm visit.
- Jeevn AI Advisory System: An AI-driven advisory tool that delivers weather forecasts and crop management guidance tailored to a specific field’s conditions.
- Blockchain-Based Product Traceability: End-to-end visibility from farm to buyer, useful anywhere supply chain transparency affects market access or premium pricing.
- Fleet and Resource Management: Tools to track and optimize agricultural machinery usage across larger operations.
- Carbon Footprinting: Tracking tools for agribusinesses that need to monitor and report emissions relative to sustainability targets or buyer requirements.

Sustainable Food Technology: What “Efficient” Actually Means in Litres and Kilograms
“Sustainable food technology” is frequently invoked without a unit attached. The Irrigation Association’s technical analysis of US precision irrigation gives two of the few concrete, sourced figures available for what efficiency gains actually look like on the ground:
- 20–25% cost reduction from precision irrigation technology on US farms, relative to conventional irrigation scheduling.
- 31 kg per hectare reduction in nitrogen application achievable through precision irrigation, without a corresponding yield loss.
Source: Irrigation Association, Precision Agriculture and Irrigation: Current US Perspectives. These are the two hard, field-level numbers behind claims of input reduction from precision technology; broader claims about “water savings” or “emissions reduction” percentages beyond these two figures are not currently backed by a published field study we could locate, and should be treated as unverified until a primary source is found.
Two research gaps are worth naming plainly rather than papering over: there is no published, controlled-trial dataset quantifying crop yield improvement percentages specifically attributable to precision agriculture technology, and there is no published dollar figure for the capital cost US farmers face to adopt a precision ag technology stack (equipment, software, and training). If your operation needs either figure, the most reliable route is a direct cost quote from your equipment dealer or precision ag software provider for your specific acreage and existing machinery, compared against your own multi-year yield records before and after adoption — a farm-specific before/after comparison will always be more accurate than an industry average applied to your fields.
Global Food Production: The Supply Side of Food Security
Precision technology adoption connects directly to global food supply trends tracked by the Food and Agriculture Organization (FAO). Global crop production grew by 9.6 billion tonnes from 2000 to 2022, according to the FAO Statistical Yearbook 2024. Looking at the most recent season-level forecast, FAO’s Food Outlook projected the following volumes for the 2024–25 season:
| Commodity | Projected global production, 2024–25 season |
|---|---|
| Corn (maize) | 1,223.3 million tonnes |
| Wheat | 799.9 million tonnes |
| Rice | 551.5 million tonnes |
Source: FAO Food Outlook, published quarterly — check the current edition at the same URL for the next season’s forecast once it supersedes the 2024–25 figures above.
On food security specifically, USDA’s International Food Security Assessment found that 313 million fewer people in vulnerable countries were projected to be food insecure in 2024 compared with 2023, attributed to higher incomes and lower food-price inflation. USDA’s separate Global Food Assessment projects annual global grain production growth of 1.7% across 2024–2034.
Sources: USDA ERS Amber Waves, September 2024; USDA Global Food Assessment summary (GFA-35).
Precision Farming in South Africa and Eswatini
Comprehensive, sourced country-level adoption rates for South Africa and Eswatini comparable to the USDA AELOS dataset were not located in the research for this article — this is a genuine gap, not an oversight, and international bodies including FAO and the World Bank periodically publish regional agricultural technology assessments for Southern Africa that would be the right place to look for a current figure. Statistics South Africa and the country’s Department of Agriculture, Land Reform and Rural Development are the primary domestic sources to check directly for adoption survey data specific to South African commercial and smallholder farms.
What is documented, and remains true regardless of adoption-rate figures, is the mechanism by which satellite-based precision tools apply in these markets: multispectral crop health monitoring and AI-driven advisory do not require the farm to have installed sensor hardware in the field, which matters directly in regions where connectivity and capital constraints have historically limited precision ag uptake. The same platform-level approach that serves smallholder farmers elsewhere applies without modification to Southern African cropping systems, since the core input — satellite imagery — does not depend on local infrastructure.


AFGRI, Farmart, and Frontier Agriculture Ltd: Where Named Operators Fit
Search interest around specific agribusiness names — AFGRI, Farmart, Frontier Agriculture Ltd, and related “frontier agriculture” queries — typically comes from people evaluating agricultural input suppliers, grain handlers, or farm equipment dealers rather than looking for precision technology reviews specifically. We have no independent, sourced data on any of these three named companies’ technology adoption, partnerships, or operations, and will not speculate about them here. If you are researching a specific operator, the reliable path is that company’s own investor relations or corporate disclosures, plus national agricultural business registries in the relevant country, rather than a third-party summary.
What we can speak to directly is the technology category itself: “frontier agriculture,” in the sense of pushing the boundary of what farm technology can do, is precisely the adoption-curve story documented in the sections above — GPS autosteering at 70% of large US farms, a global market headed toward $21.47 billion by 2033, and measurable input savings in the 20–25% range on irrigation-heavy operations. That is the substantive, sourced version of “frontier agriculture” this article can responsibly cover.
Calculator: Precision Irrigation Savings Estimator
Using the Irrigation Association’s documented 20–25% cost reduction range and 31 kg/ha nitrogen reduction figure, estimate what precision irrigation could save on your own acreage and current input spend.
Enter your numbers above to see an estimate.
Assumptions: cost savings are calculated as a flat percentage of your entered current irrigation spend, using the Irrigation Association's documented 20–25% range for US precision irrigation adoption. The nitrogen figure applies the Association's 31 kg/ha reduction uniformly regardless of crop or soil type. This excludes equipment and software purchase costs, financing, installation, and any site-specific agronomic factors — treat the output as a starting estimate, not a quote.
Barriers to Adoption and How They're Being Addressed
The USDA adoption data above shows precision technology concentrated on large farms; the gap to midsize and small operations is driven by three recurring barriers, and Farmonaut's platform design responds to each directly:
1. Infrastructure and Connectivity
Real-time data transmission is difficult where rural internet access is limited. Farmonaut's mobile applications are built to work with minimal data requirements, store data offline, and sync automatically once connectivity returns.
2. Farmer Education and Training
Switching from established methods requires a usable interface and real support, not just software. Farmonaut invests in intuitive interfaces, structured training, and partnerships with local agricultural extension services to close this gap.
3. Initial Investment Costs
The dollar cost of adopting a full precision ag stack is not published as a single industry figure — see the gap noted above — but flexible pricing models, including pay-as-you-go options, and partnerships with microfinance institutions are the practical way smaller operations manage that cost without a large upfront outlay. Farmonaut's platform is built to scale from a single field to a full commercial operation, so an operation can start small and expand as measurable savings materialize.


A Durable Way to Track This: The Checklist That Won't Expire
Because adoption rates, market size, and even commodity forecasts update annually, the specific figures in this article will age. What won't age is the method for checking them yourself:
- Adoption rates: USDA NASS publishes AELOS technology-adoption tables, typically each December. Go to the ERS Charts of Note page (linked above) and search "precision agriculture" for whichever year's data is current.
- Market size and CAGR: Search "precision agriculture market size" plus the current year. IMARC, GMInsights, Straits Research, BCC Research, and Fortune Business Insights all republish annually — cross-check at least two before citing a figure, since methodologies differ.
- Global production forecasts: FAO's Food Outlook is issued quarterly. Use the same URL cited above; it will show whichever season is current.
- Input-cost savings (irrigation, fertilizer): The Irrigation Association's technical papers are the most rigorous public source for US figures; check for a newer edition before relying on the 2017 paper cited here.
This four-step check is the actual "future of farming technology" story: not a single headline number, but a small number of primary sources that update on a known schedule, cross-checked before you act on them.
Sustainable Agriculture Impact Comparison
| Metric | Conventional practice | With precision technology |
|---|---|---|
| Irrigation cost | Baseline | 20–25% lower (Irrigation Association) |
| Nitrogen application | Baseline | 31 kg/ha lower, no yield loss (Irrigation Association) |
| GPS autosteering use, large US crop farms | N/A | 70% adoption (USDA, 2023) |
| Variable rate technology, US corn/soy/wheat acreage | N/A | 31–37% of acreage (USDA, 2023) |
This table draws only on the two sourced, quantified studies located for this article — USDA's AELOS adoption survey and the Irrigation Association's technical analysis. Broader claims about carbon footprint reduction or soil health scoring are not backed by a comparable field study currently available and are omitted rather than estimated.
Case Study Context: Cocoa Farming in West Africa
West Africa, led by Ghana and Côte d'Ivoire, remains the world's largest cocoa-producing region, and it illustrates the same technology-adoption gap seen in the US large-farm-versus-smallholder data above, applied to tree crops. Satellite imagery can flag water stress or disease pressure across a plantation without a physical inspection, precision data on soil moisture and nutrients allows more targeted input use, and blockchain-based traceability tools give buyers the transparency increasingly required for premium and sustainably-sourced cocoa markets. The same technology stack applies to cash crops generally, not just staple grains.

Further reading:
Frequently Asked Questions
- What percentage of US farms actually use precision agriculture?
27% of all US farms used at least one precision agriculture practice in 2023, per USDA ERS. Adoption is far higher on large farms specifically — 70% use GPS autosteering — so the all-farm average understates the technology's penetration among commercial-scale operations. - How much can precision irrigation actually save?
The Irrigation Association documents a 20–25% cost reduction and a 31 kg/ha nitrogen application reduction without yield loss, based on US farm data. Use the calculator above to apply those figures to your own acreage and current spend. - How big is the precision agriculture market, and how fast is it growing?
$9.32 billion globally in 2024, projected to reach $21.47 billion by 2033 — a 9.66% CAGR — per IMARC Group. - Is there reliable adoption data for South Africa or Eswatini specifically?
Not in the sources reviewed for this article. Check Statistics South Africa, the national Department of Agriculture, Land Reform and Rural Development, and FAO's regional assessments for the most current country-level figures. - Does precision farming technology work in areas with limited internet connectivity?
Yes — Farmonaut's mobile applications are designed to work with minimal data requirements and store information offline, syncing when connectivity is available. - Can this technology be used for any crop?
Yes — satellite-based monitoring and AI advisory apply across staple grains and cash crops alike.
Ready to see this data applied to your own fields? Explore Farmonaut's subscription options below:
For developers integrating satellite and weather data directly, see the API and API Developer Docs.

Discussion
Questions, corrections or field experience? Share them below. First-time comments are reviewed before they appear, and your email is never published.
No comments yet. Be the first to add a question or your experience.

 Mostas Tech
 AgroStar
 Native Seeds
 Andex
Andex FCF India
 Unifrutti Gulf
 Deluxe Conseil
 TVS Electronics
 BW Pipelines
 WICO
WICO Chimera Innovation
 SkyHarvest
 Polaris Digitech
 Teledarbas
