

Reviewed August 2026 against USDA NASS Farm Production Expenditures, BLS Producer Price Index series, and USDA ERS Commodity Costs and Returns.
Farm Equipment Maintenance Software: What It Should Track, and What Repairs Actually Cost
Farm equipment maintenance software is a scheduling and record system that ties service intervals to engine hours or acres, stores parts and labour costs against each machine, and produces the repair history a lender, insurer or buyer will later ask for. The reason to run one is arithmetic: US farms and ranches spent $24.0 billion on farm supplies and repairs in 2024, and the producer price index for maintenance and repair services on agricultural, construction and mining machinery rose 67.9% between 2019 and the first half of 2026 — nearly twice the rate at which new farm machinery prices rose over the same span. A repair budget set from an old quote is structurally too small.
This page gives you the national benchmark figures, the method to check them against your own operation, a calculator that escalates your own repair rate to the published index, and an interval checklist that does not expire when the numbers do.

Table of Contents
Why repair costs outran machinery prices
The Bureau of Labor Statistics publishes a producer price index specifically for maintenance and repair services for agricultural, construction, and mining machinery (series PCU8113108113105, index Dec 2013 = 100). Annual averages: 117.9 in 2019, 120.9 in 2020, 131.3 in 2021, 159.4 in 2022, 171.3 in 2023, 180.2 in 2024, 193.5 in 2025, and 197.9 across January–June 2026 (preliminary).
Compare that with farm machinery and equipment manufacturing (PCU333111333111, Dec 1982 = 100): 222.9 in 2019 rising to 301.5 in the first half of 2026. Rebased to 2019 = 100, repair services reached 167.9 while new machinery reached 135.3. The gap is the whole argument for tracking service work as a line item rather than an afterthought — the cost of keeping a machine has been inflating faster than the cost of buying one.
Diesel adds volatility on top. The BLS commodity index for No. 2 diesel fuel (WPU057303) averaged 178.0 in 2020, spiked to 549.1 in 2022, fell to 301.6 in 2025, and averaged 443.3 across January–June 2026. Fuel burn is the fastest signal that an engine, injector set or transmission is drifting out of spec, which is why hour-meter and fuel logs belong in the same record as service work.
Where agricultural equipment maintenance sits in a US farm budget
USDA’s National Agricultural Statistics Service publishes the annual Farm Production Expenditures series from the Agricultural Resource Management Survey. Total US farm production expenditures were $477.6 billion in 2024, down 0.9% from $481.9 billion in 2023, with an average of $254,043 per farm (up from $196,087 in 2021), per the NASS total-and-average-per-farm data file.
Within that total, the ranked expenditure file puts farm supplies and repairs at $24.0 billion (5.0% of the total) — the eighth-largest line, ahead of agricultural chemicals ($21.7bn) and fuels ($15.4bn). Tractors and self-propelled farm machinery accounted for $21.0 billion, other farm machinery $8.3 billion, and trucks and autos $6.6 billion.
Two caveats matter before you benchmark against these. First, NASS “farm supplies and repairs” bundles repairs and maintenance of non-depreciated equipment with oils, lubricants and miscellaneous non-capital items — it is not a pure repair figure. Second, USDA ERS estimates the repairs line in its Commodity Costs and Returns series by a different route entirely: the documentation states repairs are derived from “an engineering formula used to determine annual repair cost based on machine, use, and State machine price,” amortised over the assumed ownership period, rather than from what farmers report paying. ERS last refreshed its cost-and-return files on 1 May 2026, with the next update scheduled for 1 October 2026 and the 2026F–2027F forecasts updated 18 June 2026.
What farm equipment maintenance software actually has to do
Most operations already have a maintenance system — it is a whiteboard, a glovebox notebook, or a spreadsheet. The question is not whether to have one but which capabilities you lose at each rung. This is where a general answer helps nobody, so here is the capability grid.
| Capability | Notebook / whiteboard | Spreadsheet | Standalone CMMS | Fleet + satellite platform |
|---|---|---|---|---|
| Interval triggered by engine hours, not calendar | Manual | Manual formula | Yes | Yes |
| Cost per machine per year, parts vs. labour split | No | Yes, if disciplined | Yes | Yes |
| Parts inventory and reorder point | No | Partial | Yes | Varies |
| Multi-operator access from the cab | No | Partial | Yes | Yes |
| Machine location and idle-time tracking | No | No | Rare | Yes |
| Field conditions that drive wear (wet spots, crop stress zones) | No | No | No | Yes |
| Tamper-resistant service log for resale or warranty | No | No | Yes | Yes, with blockchain |
| Exportable history for lender or insurer | No | Yes | Yes | Yes |
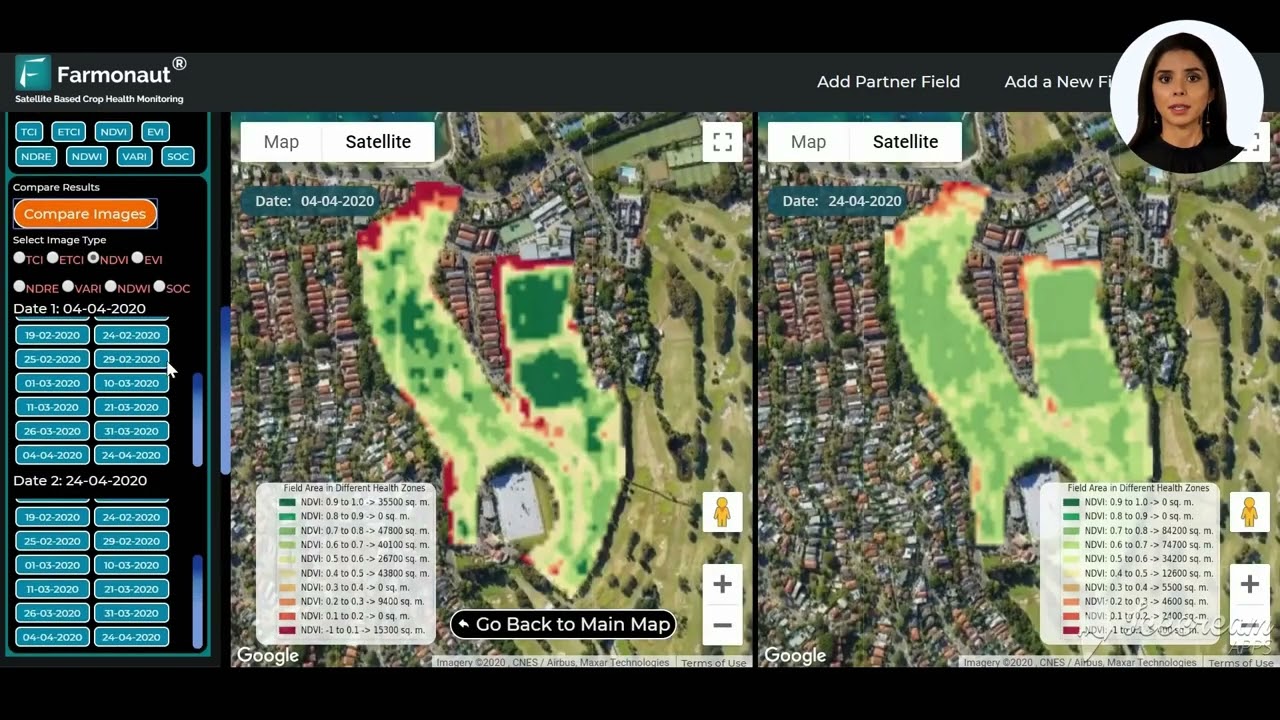
A dedicated computerised maintenance management system for agriculture covers the work-order and parts-inventory columns well. What it does not see is the field. Farmonaut’s fleet management module adds machine location, route and idle-time data, and its satellite layer flags the wet or stressed zones where a combine or cultivator will take the most punishment — the difference between scheduling by the calendar and scheduling by actual duty cycle.
Why last season’s maintenance budget under-books
Between 2021 and 2024 every machinery-related NASS category rose, but not by the same amount. Farm supplies and repairs went from $20.2bn to $24.0bn (+18.8%); tractors and self-propelled machinery from $17.6bn to $21.0bn (+19.3%); fuels from $12.9bn to $15.4bn (+19.4%); other farm machinery from $7.0bn to $8.3bn (+18.6%); trucks and autos from $5.2bn to $6.6bn (+26.9%).
Repair budget benchmark calculator
Enter your own figures to see how your repair spend compares with the 5.0% national share, and what the same repair rate costs once escalated to the published 2026 index level.
Run your own numbers
Assumptions: the 5.0% benchmark is farm supplies and repairs ($24.0bn) divided by total US farm production expenditures ($477.6bn) for 2024, USDA NASS. Escalation uses BLS series PCU8113108113105 annual averages against the January–June 2026 preliminary average of 197.9. Excludes depreciation, machinery purchases, interest, warranty recoveries, insurance claims and any regional wage differences. Defaults shown are the NASS 2024 per-farm average and 5% of it — replace both with your own figures.

A service-interval spine that does not expire
Index values change every month; the method does not. Use the manufacturer's interval as the authority, log against the hour meter rather than the calendar, and record the verification step so a second person can confirm the work happened. The table below is a starting frame for ongoing agriculture maintenance across the machine classes most US operations run — replace each interval with the figure in your own operator's manual, which supersedes any general table including this one.
| Machine | Task | Trigger | How to verify it was done right |
|---|---|---|---|
| Tractor | Engine oil and filter | Hour-meter interval in the operator's manual | Oil analysis report on file; filter part number logged |
| Tractor | Hydraulic and transmission fluid, filters | Manual interval, or after any contamination event | Pressure test against the manual's spec range |
| Combine / harvester | Concave clearance, sieve and rotor wear | Pre-season and mid-season | Grain loss pan count over a measured distance |
| Combine / harvester | Chain, belt and bearing lubrication | Daily during harvest | Grease-point checklist signed per shift |
| Cultivation / tillage tools | Shank, sweep, disc and bearing wear | By acres worked, not by weeks | Depth check across the full bar width |
| Planter / seeder | Meter calibration, seed disc and closing wheel | Every season and after any meter change | Bench test on a meter stand; seed spacing count |
| Fertilizer spreader / applicator | Rate calibration, corrosion, boom nozzles | Before each application window | Catch test; measured output vs. target rate |
| Sprayer | Nozzle flow, hoses, pressure regulator | Before each application window | Flow test on every nozzle; replace at 10% variance |
| Baler | Knotter timing, belts, pickup teeth | Pre-season and per 1,000 bales | Bale weight and density sample |
| Irrigation pump | Impeller, seals, intake screen | Start-up and monthly in season | Flow meter reading against pump curve |
Three habits make the difference regardless of the software: log the hour-meter reading with every entry, photograph the failed part before it goes in the scrap bin, and record the invoice number so the parts and labour split can be reconstructed later. Anything less and the file cannot answer the two questions that matter — what did this machine cost to keep, and is that number rising?

Sizing the farm equipment repair and maintenance services market
Searches for the "farm equipment repair and maintenance services market" — and its narrower cousins covering harvesting equipment or fertilizer equipment repair — usually land on paywalled forecasts. There is a free, official way to bound the number instead, and it produces a figure you can defend.
Start with the NASS expenditure categories that money must flow through: farm supplies and repairs ($24.0bn), tractors and self-propelled machinery ($21.0bn), fuels ($15.4bn), other farm machinery ($8.3bn) and trucks and autos ($6.6bn) sum to $75.3 billion of machinery-linked spending in 2024. The service-and-parts share sits inside that envelope, not outside it. Any market estimate substantially above $75.3 billion for US on-farm machinery service is counting something else — construction equipment, exports, or new-machine sales.
To narrow it further for your own state or crop, three free tools do the work: USDA NASS Quick Stats for state-level expenditure detail back to 1870; the 2022 Census of Agriculture Tables 44 and 45 for machinery counts and market values by county; and the ERS cost-and-returns files for the repairs line per planted acre by commodity and region. Note the denominator when you do: NASS reported on 13 February 2024 that the 2022 census counted 1.9 million farms and ranches, down 7% from 2017, averaging 463 acres across 880 million acres — a shrinking farm count spreading a growing repair bill over fewer, larger operations.
Right to repair, and why it changes your record-keeping
The American Farm Bureau Federation has signed right-to-repair memoranda of understanding with CNH Industrial (9 March 2023, covering Case IH and New Holland), AGCO and Kubota (both 17 May 2023), CLAAS of America (14 June 2023) and John Deere. AFBF states on its right to repair issue page that approximately three quarters of agricultural machinery sold in the United States is covered by these MOUs, which give farmers and independent shops access to error codes, specialty tools, repair information and the ability to buy diagnostic tools directly at a reasonable price.
The practical consequence for maintenance software: once you can legitimately pull diagnostic trouble codes yourself, the code, the date, the hour reading and the fix belong in your own record — not only in a dealer's system you may lose access to when you change brands or sell the machine. Recording it under your control is what turns a repair history into an asset at resale.
Sustainable agriculture equipment repair: rebuild or replace
The rebuild-versus-replace decision has shifted with the index gap shown above. New farm machinery prices rose 35.3% between 2019 and the first half of 2026; repair services rose 67.9%. Repair is no longer automatically the cheap option, and the honest comparison needs three inputs you already have: the remaining useful hours on the machine, the quoted rebuild cost, and the fuel-efficiency difference between old and new. Diesel at a January–June 2026 PPI average of 443.3 versus 301.6 in 2025 makes the fuel term larger than it was.
Emissions belong in the same calculation. A rebuilt component avoids the embodied carbon of a new machine; a machine running out of tune burns more fuel every hour. Farmonaut's carbon footprinting tools let you attach an emissions figure to machinery hours so the sustainability case is quantified rather than asserted, and blockchain product traceability can carry a verified service and parts history alongside the crop record for buyers running certification audits.
Farmonaut apps, API and fleet tools
Farmonaut is not a dealer, manufacturer or repair shop. It is a satellite-based farm management platform, and these are the parts of it that touch equipment maintenance:
-

Web app: field-level satellite monitoring, so you can plan machine deployment around the zones that are actually ready to work. -

Android app: log breakdowns, hour readings and service notes from the cab. -

iOS app: the same records on iPhone or iPad. - API: push satellite and weather data into your existing maintenance system via the Farmonaut API, with setup detail in the satellite and weather API developer docs.
- Multi-site operations: the Agro Admin App gives estates and cooperatives one view of equipment deployment and servicing across sites.

Frequently asked questions
What share of farm expenses should ag equipment maintenance be?
USDA NASS put farm supplies and repairs at $24.0 billion out of $477.6 billion total US farm production expenditures in 2024 — 5.0%. That category bundles lubricants and non-capital items with repairs, so treat 5% as an upper-bound benchmark for the supplies-and-repairs line, not a pure repair target. Compare your own ratio using the calculator above.
How much have agricultural repair costs risen?
The BLS producer price index for maintenance and repair services on agricultural, construction and mining machinery averaged 117.9 in 2019 and 197.9 across January–June 2026 (preliminary) — a 67.9% increase. New farm machinery prices rose 35.3% over the same period.
Can I get a repairs cost per acre for my crop?
Yes. USDA ERS publishes a repairs line in its Commodity Costs and Returns files for corn, soybeans, wheat, cotton, rice, sorghum, barley, oats, peanuts, milk, cow-calf and hogs, by region. The files were last updated 1 May 2026, with the next update scheduled for 1 October 2026.
Does Farmonaut repair or sell farm equipment?
No. Farmonaut provides satellite crop monitoring, fleet management and farm record software. Repairs, parts and warranty work stay with your dealer or independent shop.
Is a CMMS worth it for a single-tractor operation?
The capability grid above shows where the break point falls: below roughly three machines and one operator, a disciplined spreadsheet captures most of the value. Multi-operator access, parts reorder points and machine location tracking are what justify software, and those only bind once several people touch the same equipment.
Verify every figure on this page
- Expenditure totals and categories: NASS publishes Farm Production Expenditures each July for the prior calendar year. Check the ranked-category data file for a fresher year than 2024.
- Repair price inflation: BLS updates PCU8113108113105 monthly. Divide the newest monthly index by 117.9 to restate the increase since 2019.
- Per-acre repairs: ERS cost-and-returns files, updated 1 May 2026 and next 1 October 2026.
- Machinery counts and values: the Census of Agriculture runs every five years; the 2022 edition was released 13 February 2024, so the following census release is the next refresh point.
- Right-to-repair coverage: AFBF's issue page lists each signed MOU and its date as agreements are added.
Track your own numbers against those five sources once a year and the maintenance budget stops being a guess. That is the whole job of farm equipment maintenance software — not to predict failures, but to make the cost of keeping each machine visible early enough to act on.

 Agro La Gándara
 Global Agrifood
 Cazlv
Cazlv HIPSAC
 ZOL Zimbabwe
 Juligerm
 AdBio
AdBio MISE Maroc
 NWNS
NWNS Red August Group
 Farm Inc
 WeMe Global
 Agrotoken
 Blue BearX
 Insignito
 Croptimum
 DnCubed
 Field Capacity
 Indosistim Teknologi
