

Reviewed August 2026 against US EPA, the UC Statewide IPM Program and SDSU Extension.
Integrated Pest Management: A Guide to Thresholds That Pay
Integrated pest management is a decision process, not a product list. You identify the pest correctly, count it against a published action threshold, and only then pick a control — starting with the tactics that leave natural enemies alive and treating a broadcast spray as the last option. The US EPA sets this out as four steps: set action thresholds, monitor and identify pests, prevent, then control.
That ordering is the whole method. Everything below is about the numbers that sit inside it — the actual sweep counts, aphid-per-plant figures and dollar-per-acre costs published by extension services in the United States and research bodies in Australia — and how to check them for your own crop rather than taking a generic figure on trust.
What This Guide Covers
- What integrated pest management is (and what the four steps actually require)
- Action thresholds: the published numbers, with sources
- The five IPM strategies, ranked by when to reach for them
- Spray break-even calculator
- Biopesticides: cutting chemical dependency without losing the crop
- What IPM looks like at scale: Australian cotton
- Satellite monitoring between scouting visits
- A season-long IPM checklist that does not expire
- FAQ
What Integrated Pest Management Actually Is
EPA defines IPM as an approach that uses pest life-cycle information with available control methods to “manage pest damage by the most economical means, and with the least possible hazard to people, property, and the environment.” The agency is blunt that IPM is a continuum rather than a badge: growers sit at different points on it, and EPA notes there is no national certification for IPM growers and that IPM-grown food is not identified in the marketplace in most cases. If a supplier claims an “IPM certified” status, ask which programme issued it.
The four steps, in EPA’s own order:
- Set action thresholds — “a point at which pest populations or environmental conditions indicate that pest control action must be taken.” Seeing a pest is not a threshold.
- Monitor and identify pests — so that the control decision matches the organism, and beneficials are not mistaken for pests.
- Prevention — crop rotation, resistant varieties, pest-free rootstock, managing the crop so pests never become a threat.
- Control — evaluate each method for effectiveness and risk, using targeted options first (pheromones, trapping, mechanical weeding) and escalating to broadcast spraying only when the less risky options have failed.
Step one is where most programmes fall apart, because a threshold is a moving number. The clearest published example is lygus bug in cotton: the UC Statewide IPM Program’s cotton guidelines slide the threshold up as the crop matures, because a plant carrying mature bolls can tolerate what a squaring plant cannot.
Note what the chart cannot show: UC IPM also tells you to read fruit retention alongside the sweep counts, and warns that late plantings, vigorous cotton and high plant populations push the threshold down. A number without its sampling protocol is not a threshold. Check the treatment table date on the guideline page before each season — UC IPM stamps both the text and the treatment table with revision dates.
How IPM defines an action threshold
The US EPA defines an action threshold as “a point at which pest populations or environmental conditions indicate that pest control action must be taken.” EPA adds that sighting a single pest does not always mean control is needed.
So the threshold is a trigger level, set before scouting starts. It is not the number of control methods on hand, the most pesticide a label allows, or the gap between monitoring visits. Those matter too, but none of them tells you when to act.
Published thresholds name the pest, the crop stage and the sampling unit:
| Pest and crop | Action threshold | Source |
|---|---|---|
| Soybean aphid, soybean | Average 250 aphids per plant, aphids on more than 80% of plants, population still rising | SDSU Extension |
| Flea beetles, canola seedlings | 25% of leaf area eaten and beetles still feeding; most injury happens from cotyledon to four-leaf stage | Canola Council of Canada |
The canola figure shows why the threshold sits below the damage level: seedlings can lose up to half their leaf area without a large yield penalty, but feeding can go from 25% to 50% quickly, so the lower number buys time to spray. The same logic puts the soybean aphid threshold of 250 well below the 674 aphids per plant at which damage equals the cost of control.
Action Thresholds: The Published Numbers
Three terms get confused constantly, and the difference is money.
- Damage boundary — the population below which yield loss is not even detectable.
- Economic injury level (EIL) — the population at which the value of damage equals the cost of control.
- Economic threshold / action threshold (ET) — the lower number you actually act on, set below the EIL to give you time to get the sprayer out before the population reaches it.
Soybean aphid is the best-documented case in North America. SDSU Extension (published 25 August 2020) reports the 2007 research figures: an EIL of 674 aphids per plant, an ET of 273, and a damage boundary near 485 aphids per plant. The field recommendation was rounded to 250 aphids per plant, and it is deliberately conservative.
The 250 figure is not a spray trigger on its own. Extension guidance requires three conditions together: an average of 250 aphids per plant, aphids on more than 80% of plants, and a population that is still increasing. Erin Hodgson of Iowa State University wrote on 21 July 2016 that treating below 250 aphids per plant produced no observable yield increase, and that recalculating a lower threshold from input prices alone, without regard to aphid biology, is a mistake.
Thresholds are crop-, region- and stage-specific. Do not port one across a border. The durable habit is this: before each season, pull the threshold page for your pest from your own state or national extension service, note its revision date, and record the sampling unit it assumes — plants, sweeps, terminals, traps or percentage of plants infested. Our companion piece on action thresholds and when pest control is truly needed works through how to apply one in the field.
The Five IPM Strategies, Ranked by When to Reach for Them
“Integrated” means these run together, but they are not interchangeable. The table below is ordered the way EPA orders its control step — least disruptive first.
| Strategy | What it is | Worked example with a real figure | When it fails |
|---|---|---|---|
| 1. Cultural | Rotation, resistant varieties, planting date, sanitation, pest-free rootstock | EPA lists crop rotation, resistant varieties and pest-free rootstock as its named prevention tactics | Pest has a wide host range or overwinters off-farm |
| 2. Biological | Conserving or releasing predators, parasitoids and pathogens | CottonInfo states plainly that “at the heart of IPM is the conservation of natural enemies”, and warns against insurance sprays | Beneficials wiped out by an earlier broad-spectrum spray |
| 3. Behavioural / semiochemical | Mating disruption, pheromone traps, attract-and-kill | Codling moth: 200-400 hand-applied dispensers per acre, or 1 aerosol unit per acre in apples and pears (WSU, 2021) | Small or irregular blocks with heavy immigration from neighbours |
| 4. Mechanical / physical | Row covers, netting, mulches, targeted pruning, mass trapping | Best economics on high-value horticulture where per-acre value carries the labour | Broadacre crops where the per-acre labour cost exceeds the damage |
| 5. Chemical, selective first | Biopesticides and selective actives before broad-spectrum; broadcast spraying last | EPA treats broadcast spraying as the final resort after targeted options fail | Resistance already present in the local population |
The sequencing matters more than the list. A broad-spectrum spray at step five in June removes the natural enemies that step two was going to supply in August, which is how a single-pest problem becomes a two-pest problem. For orchard and horticulture growers wanting the non-chemical side in more depth, see our guide to organic pest control and sustainable farming practices.

Spray Break-Even Calculator
Put your own yield, price and product cost in and the tool returns the yield loss you would have to be preventing for the application to pay for itself.
Run your own numbers
Defaults are SDSU Extension's 2016 South Dakota soybean figures — $10.01 per bushel, 46 bushels per acre, $5.25 per acre application fee, and the low end of its $2.74–$11.11 per acre insecticide range. Replace all six with your own. The tool excludes resistance risk, re-treatment, the value of natural enemies destroyed, pollinator exposure, pre-harvest intervals and any residue or market restriction. It answers one narrow question: does this single application pay for itself?
The cost side of that arithmetic is dominated by a fixed fee at the cheap end, which is why "just add it to the tank" is a worse economic argument than it sounds.

Biopesticides: Cutting Chemical Dependency Without Losing the Crop
Biopesticides are how most IPM programmes reduce conventional pesticide dependency without giving up a chemical option entirely. EPA defines them as pesticides derived from natural materials — animals, plants, bacteria and certain minerals — in three classes: biochemical (including insect sex pheromones), microbial (of which Bacillus thuringiensis is the most widely used), and plant-incorporated protectants, where EPA regulates the pesticidal protein and its genetic material but not the plant.
EPA reported 390 registered biopesticide active ingredients as of 31 August 2020. That list is maintained and republished, so check the agency's biopesticide active ingredients page for a fresher count rather than quoting this one. EPA also notes that new biopesticides are typically approved in under a year, against an average of more than three years for conventional pesticides.
Two practical consequences for a grower trying to reduce conventional pesticide use:
- Pheromones used solely in traps are exempt from FIFRA requirements, per EPA's Pesticide Registration Manual, Chapter 3. Monitoring traps therefore carry no registration burden — the cheapest possible entry point into a threshold-based programme.
- Mating disruption is a registered control, not just monitoring. WSU Tree Fruit, in an article dated 1 April 2021 by Thomson and Thayer, gives 200–400 hand-applied dispensers per acre, 1 aerosol unit per acre in apples and pears, and 1 unit per 1.75 acres in walnuts because of the larger canopy. WSU's mating disruption background page records that the codling moth pheromone product was registered in 1991 and the oriental fruit moth product in 1986 — so any cost comparison drawn from that era is now historical and needs re-pricing against your own supplier quotes.
Biopesticides do not exempt you from resistance management. Bt is a mode of action like any other, and rotating between two biological products with the same mode is not a rotation.

What IPM Looks Like at Scale: Australian Cotton
CSIRO reports an 85% reduction in insecticide use in the Australian cotton industry, attributing it to its pest management research combined with Bt-trait cotton varieties targeting Helicoverpa caterpillars. CSIRO's page was last updated 5 January 2021 and does not state the baseline year for that percentage, so treat it as a direction-of-travel figure and ask CSIRO or Cotton Australia for the baseline before quoting it in a business case.
The operational discipline behind it is set out by CottonInfo: decisions supported by good sampling and valid control thresholds, no insurance sprays, selective products where a chemical is needed, and perennial native vegetation retained as refuge for natural enemies. CottonInfo's own tooling is refreshed on a schedule — a silverleaf whitefly sampling and thresholds publication dated 2024, a NymphCheck app released pre-commercially in late January 2024, and a mite resistance update dated January 2025 — which is the model to copy: thresholds are versioned documents, not folklore.
In the United States, USDA's Economic Research Service reports the same directional result from Bt crops — insecticide use dropped in both corn and cotton production following their introduction — while post-emergent herbicide use rose after herbicide-tolerant crops arrived in 1996. ERS publishes the underlying survey estimates through the ARMS Farm Financial and Crop Production Practices data product, which is where to go for a crop-specific, year-specific number rather than a national generalisation.
Satellite Monitoring Between Scouting Visits
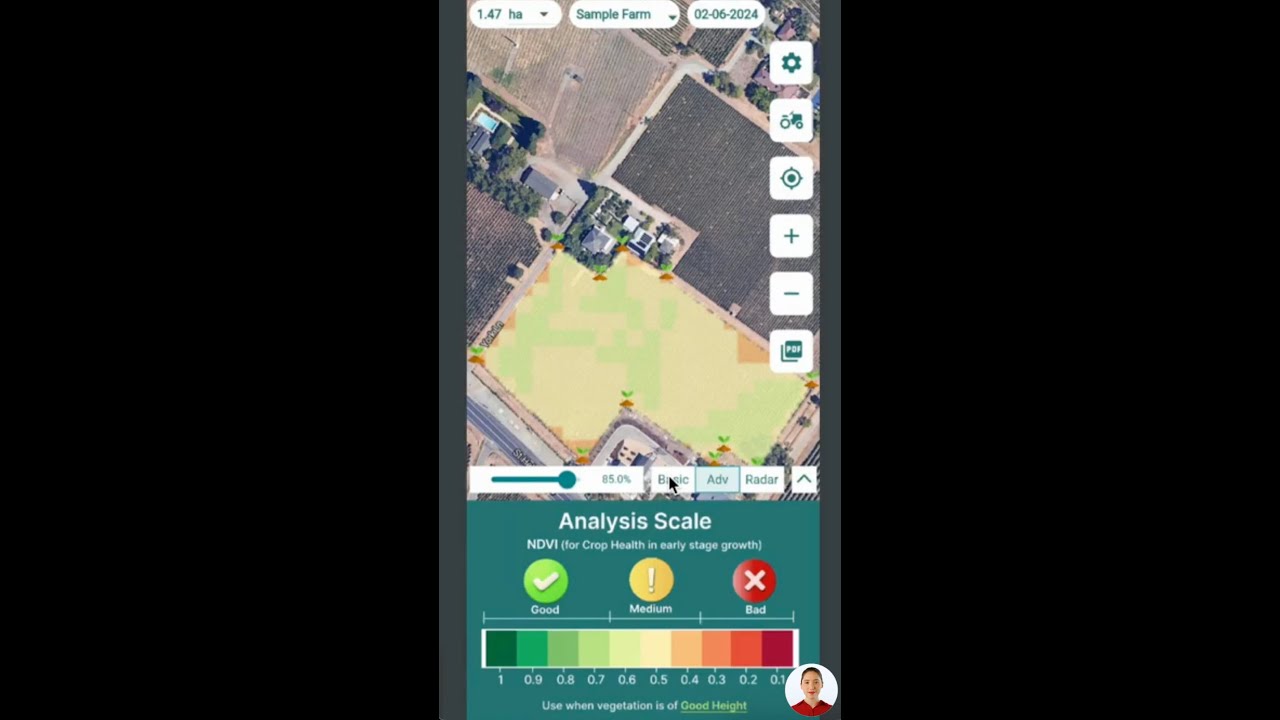
Nothing above replaces walking the field — a sweep net count cannot be taken from orbit. What satellite monitoring does is tell you where to walk. UC IPM asks for at least one lygus sample per 8-acre field section twice weekly; on a large block, a crop-vigour map narrows that to the areas actually changing. Farmonaut provides multispectral crop health indices at field scale so scouting routes can be prioritised by stress signal rather than by convenience.
For operations running many blocks or many growers, the large-scale farm management system keeps scouting records, threshold breaches and spray decisions against each field, which is what turns a season of scouting notes into a resistance-management history. Teams that need the data inside their own systems can use the satellite and weather API with its developer documentation.

Related tooling that supports the same records: carbon footprinting for quantifying the emissions side of reduced passes, blockchain product traceability where buyers ask for spray-history assurance, fleet management for the machinery cost side of every application, and crop loan and insurance verification for lenders assessing pest-related loss claims.




A Season-Long IPM Checklist That Does Not Expire
Numbers change; this sequence does not. Run it every season.
- Before planting: list the three pests that cost you most in the previous two seasons. For each, download the threshold page from your own extension service and write down its revision date and sampling unit.
- At planting: apply the prevention tactics EPA names — rotation away from the previous host, a resistant variety where one exists, pest-free planting material.
- From crop emergence: set the monitoring cadence the threshold document assumes, not the one that suits your diary. UC IPM's lygus protocol is twice weekly from first square.
- Every count: record the number, the date, the growth stage and whether the population is rising or falling. A single count cannot satisfy the "populations increasing" condition.
- At a threshold breach: run the break-even arithmetic above with today's product quote and custom application rate, not last season's.
- Choosing a product: pick the most selective option that will do the job, check the mode-of-action group against what you used previously, and confirm the pre-harvest interval.
- Seven to ten days after treating: re-count. This is the step almost everyone skips, and it is the only evidence you will ever get that a product still works on your population.
- End of season: compare treated and untreated blocks or strips. If you cannot see a difference, the threshold was set too low.
Frequently Asked Questions
What are the main IPM strategies?
Cultural, biological, behavioural or semiochemical, mechanical or physical, and selective chemical — deployed in roughly that order. EPA's control step directs growers to targeted methods such as pheromones, trapping and mechanical weeding first, with broadcast spraying as the final resort.
What is a simple example of integrated pest management?
Codling moth in apples: hang pheromone traps to time the flight, deploy 200–400 hand-applied mating-disruption dispensers per acre or 1 aerosol unit per acre (WSU, 2021), maintain orchard sanitation, and use a targeted insecticide only if trap catch and degree-day models show disruption is being overwhelmed.
What are the four steps of IPM?
Set action thresholds; monitor and identify pests; prevent; control. That is EPA's published sequence, and the order is deliberate — the threshold exists before the pest does.
How do biopesticides reduce chemical pesticide dependency?
They substitute a narrow-spectrum product for a broad-spectrum one at the point where a threshold has been crossed, which preserves the natural enemies that keep the next generation below threshold. EPA had 390 registered biopesticide active ingredients as of 31 August 2020, across biochemical, microbial and plant-incorporated-protectant classes. Pheromones used only in traps are exempt from FIFRA registration entirely.
Does IPM actually reduce pesticide use?
At industry scale it has. CSIRO reports an 85% reduction in insecticide use in Australian cotton from combined IPM research and Bt varieties, and USDA ERS reports insecticide use falling in US corn and cotton after Bt crops were introduced. Neither is a promise for an individual farm — the reduction comes from the discipline, not the label.
Is there an official IPM certification?
Not from EPA. The agency states there is no national certification system for IPM growers and that IPM-grown food is not generally identified in the marketplace. Private and state programmes exist; ask which one is being cited.
The Short Version
Integrated pest management earns its keep in one number: the count at which you act. Get that number from a dated, sourced threshold document for your crop and region, sample the way that document tells you to, run the break-even arithmetic with today's costs, and re-count after every treatment. The tactics — biological, cultural, mechanical, semiochemical, chemical — are just the menu you order from once the count says to order something.
Everything else in this guide will need updating within a few seasons. That sequence will not.

 Innomick
 Juligerm
 AdBio
AdBio MISE Maroc
 Drift-Sense
 NWNS
NWNS Red August Group
 Farm Inc
 WeMe Global
 Agrotoken
 Blue BearX
 Insignito
 Croptimum
 DnCubed
 Field Capacity
 Indosistim Teknologi
 Liquify Digital
