

Reviewed September 2026 against USDA NASS, USDA ERS, and AgFunder.
Try it: Run your own numbers →
Innovation in agriculture technology now shows up in the numbers, not just the marketing copy. US corn growers averaged 183.1 bushels per acre in 2024, soybean growers hit a record 53.2 bushels per acre, and wheat came in at 52.2 bushels per acre, according to USDA’s National Agricultural Statistics Service (NASS), published August 12, 2024 (USDA NASS). Meanwhile, agtech startups pulled in $6.07 billion across roughly 700 deals in 2025, up 6.3% year-over-year, per AgFunder’s Global AgriFoodTech Investment Report (AgFunder).
This article covers what’s actually driving those figures — automation, precision agriculture and data analytics, sustainable practices, controlled-environment farming, agrivoltaics, blockchain traceability, and nanotechnology — with adoption rates broken out by farm size, a comparison table AI summaries can’t hand you, and a calculator to estimate what precision inputs could save on your own acreage.
Table of Contents
- Introduction: Where the Data Actually Points
- Trend 1: Automation and Robotics in Agriculture
- Trend 2: Data Analytics & Precision Agriculture
- Trend 3: Sustainable and Regenerative Practices
- Trend 4: Vertical Farming and Controlled-Environment Agriculture
- Trend 5: Agrivoltaics — Dual-Use Solar and Cropland
- Trend 6: Blockchain in the Agriculture Supply Chain
- Trend 7: Nanotechnology in Agriculture
- The Role of AI & Machine Learning
- Calculator: What Precision Inputs Could Save You
- Comparative Trends Table
- How Farmonaut Fits In
- Adoption Barriers & How to Check Current Data
- Frequently Asked Questions
- Conclusion



Introduction: Where the Data Actually Points
Ask about “innovation in agriculture technology” and most sources hand back the same vague list: drones, sensors, AI. The more useful question is where adoption actually stands, who’s using it, and what it’s doing to output. On that, USDA has hard numbers. USDA’s Economic Research Service (ERS) reports that 27% of all US farms used at least one precision agriculture practice in 2023 (USDA ERS), while a separate 2023 NASS study found guidance/autosteering systems on 70% of large-scale crop farms and drones on 12% of them.
Adoption isn’t even across farm sizes. ERS data from 2016–2017 shows auto-steer guidance on winter wheat farms ranged from 7% adoption on the smallest operations to 82% on the largest; for corn, the largest farms hit 73% adoption in 2016 (USDA ERS). That gap — scale buys access to precision tools faster than anything else — runs through every trend below, including in regions like Kenya where agtech startups are emerging around smallholder constraints rather than farm-size advantages.
Trend 1: Automation and Robotics in Agriculture
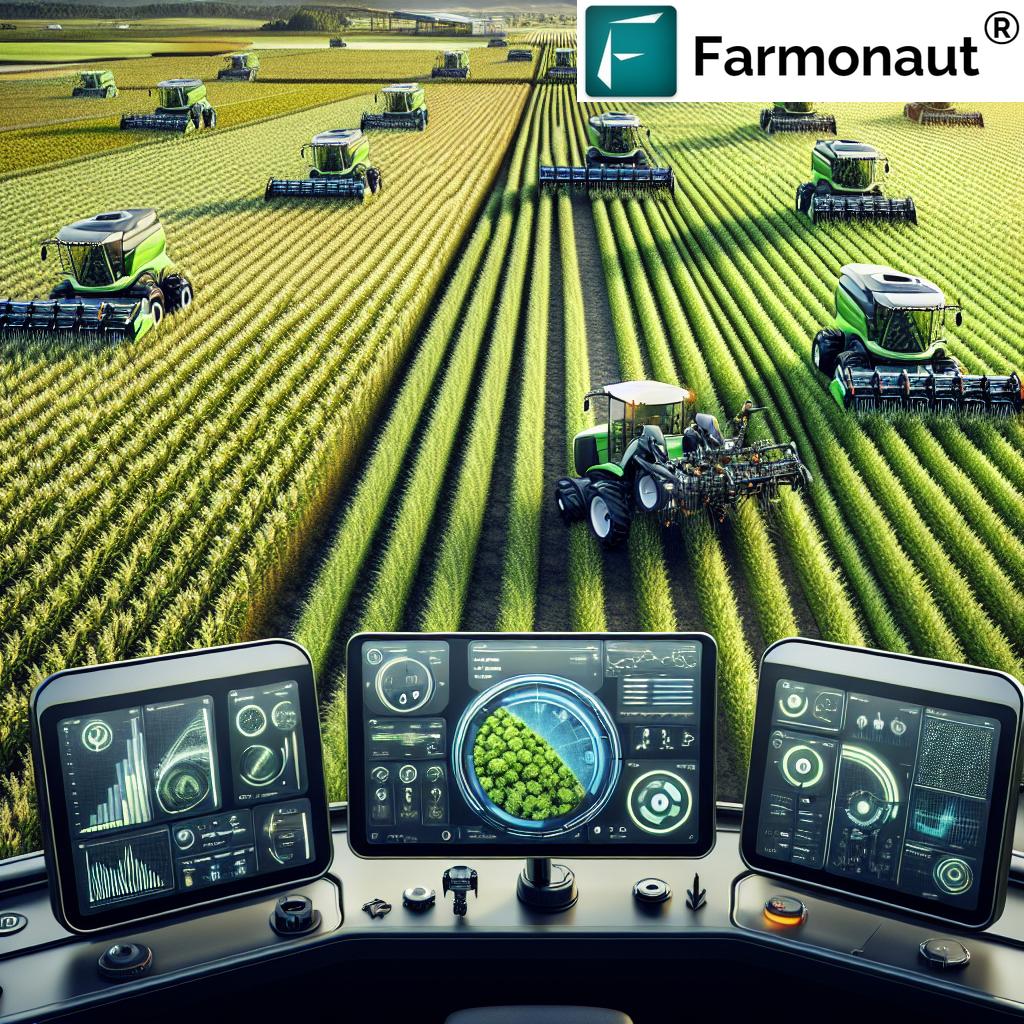
Automation now covers self-guided tractors, robotic harvesters, and drone-based scouting. The USDA figures above are really automation-adoption figures: guidance and autosteering — the entry point for autonomous field equipment — sits at 70% on large-scale crop farms as of the 2023 NASS survey, but under 30% on smaller operations by most historical patterns in the ERS size breakdowns.
How Automation Changes Field Operations
- Autonomous Tractors and Harvesters: Guided by GPS and computer vision, these machines plant, weed, and harvest with reduced manual steering — the same guidance systems tracked in the ERS adoption data above.
- Mechanical and AI-Guided Weeders: Vision-based weeders identify and remove weeds mechanically, cutting herbicide passes.
- Drone Adoption: At 12% of large-scale crop farms in 2023 per NASS, drones remain a minority tool even among the biggest operations — adoption here is still in its early phase compared to guidance systems.
- Try it: Run your own numbers
A large Corn Belt operation running autosteer at the 73% adoption rate USDA measured on the biggest corn farms is a different cost picture than a 200-acre operation weighing its first GPS receiver. Fleet management tools that track machine hours and routes help operations of any size get more out of whatever automation they’ve already bought, before adding new hardware.

The pattern to watch, not just this year’s numbers: adoption scales with farm size faster than it scales with time. A farm evaluating automation should benchmark against operations of comparable acreage, not against the large-farm averages USDA reports headline first.
Trend 2: Data Analytics & Precision Agriculture
Precision agriculture — sensors, satellite imagery, and variable-rate application driven by real-time data — is the category ERS measured at 27% adoption across all US farms in 2023. That’s up from a smaller base historically, but it also means nearly three in four US farms report no precision practice at all, which is the actual headroom this technology still has.
The Toolset Behind the Adoption Number
- Soil & Crop Sensors: Track soil moisture and nutrient levels to target irrigation, fertilization, and pest control to specific zones rather than whole fields.
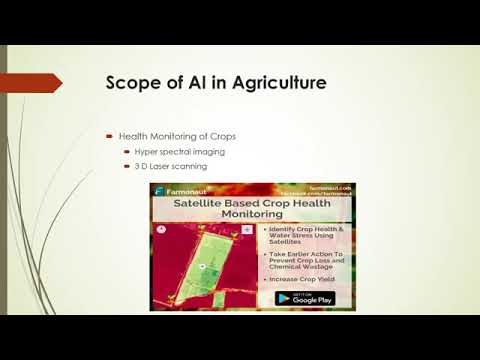
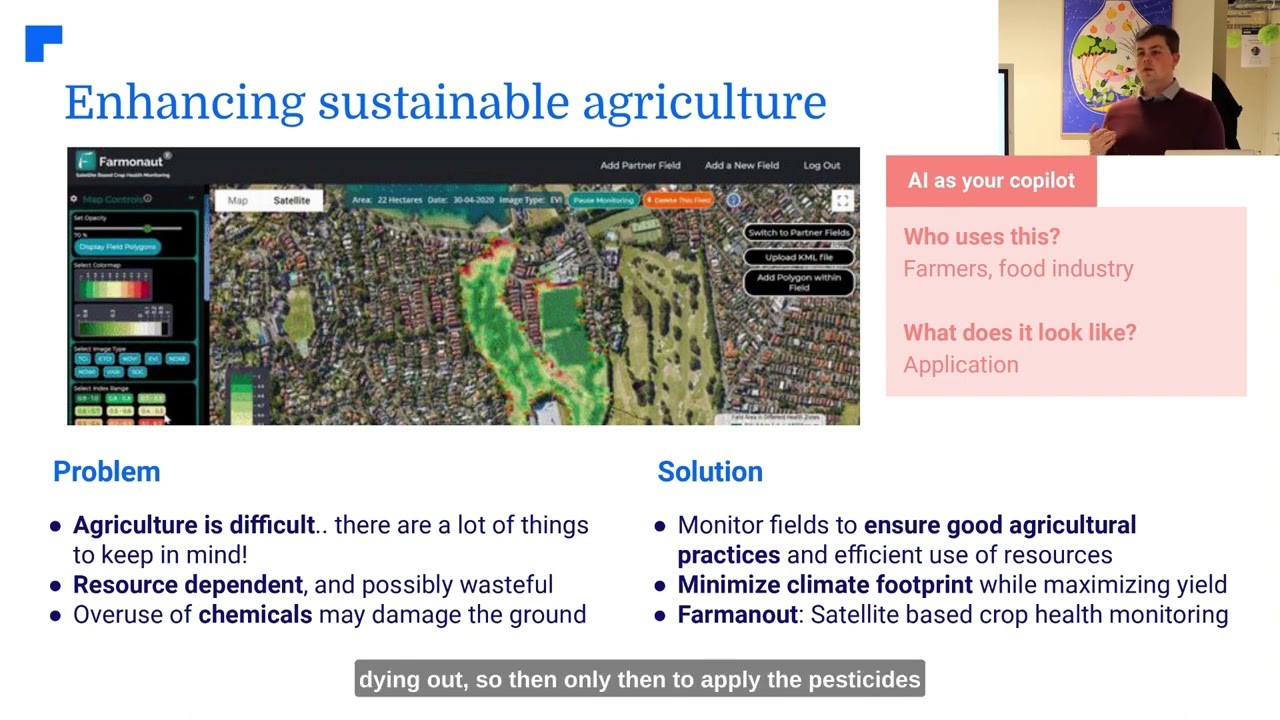
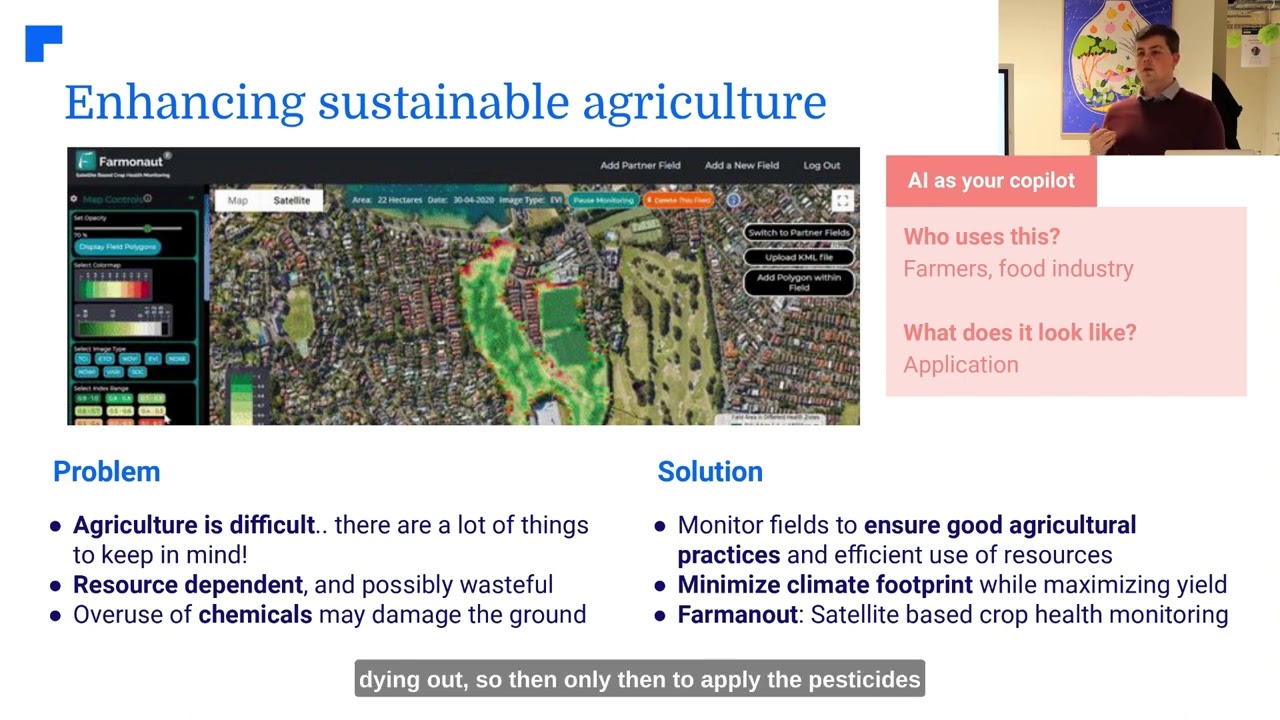
- Satellite Imagery: Platforms including Farmonaut use multispectral imagery to flag crop stress, disease pressure, and vigor changes before they’re visible from the road.
- Smart Irrigation: Combines weather forecasts with soil-moisture sensor data to schedule watering by need rather than by calendar.
What precision agriculture does to yield isn’t separately published by USDA — NASS tracks adoption rates, not the resulting yield delta, which is a real gap in the public data (see the Gaps section under Adoption Barriers below for how to estimate this for your own operation). What is published: national average yields of 183.1 bu/acre for corn, 53.2 bu/acre for soybeans, and 52.2 bu/acre for wheat in 2024 — the baseline any on-farm precision-ag trial should be measured against (USDA NASS).
For growers formalizing sustainability reporting alongside precision inputs, carbon footprint monitoring solutions track emissions across operations, and large-scale farm management tools centralize crop analytics and reporting across multiple fields or clients.
Farmonaut’s satellite-based crop health monitoring and soil moisture assessment are built to bring the sensor and imagery side of precision agriculture to operations below the largest-farm tier — the segment USDA’s own size breakdown shows adopts these tools slowest.
Trend 3: Sustainable and Regenerative Practices
Regenerative and sustainable agriculture technology covers practices designed to rebuild soil health while cutting synthetic input use — cover cropping, reduced tillage, microbial fertilizers, and biological pest control. This is a genuine gap in public reporting worth naming directly: USDA tracks acreage enrolled in conservation programs like EQIP, but does not publish a unified national figure for cover crop acreage or a productivity/profitability comparison for regenerative versus conventional practices. If you need that number for a specific county or state, USDA’s NASS Census of Agriculture and state extension offices are the right first call — see the Adoption Barriers section for the request path.
Where the Technology Layer Fits
- Push–Pull Pest Management: Intercropping with repellent and trap plants to control pests without chemical sprays, monitored increasingly via satellite and sensor data rather than manual field walks.
- Microbial Fertilizers: Biological inoculants that improve nutrient uptake and reduce synthetic fertilizer dependency.
- Precision Water Conservation: IoT soil sensors and satellite soil-moisture data apply irrigation only where and when it’s needed — the same toolset described in Trend 2.
Farmonaut’s crop plantation and forestry advisory solutions support the land-management and restoration side of this — tracking vegetation change over time on a specific parcel, which is the kind of before-and-after evidence regenerative-practice adopters need since no standardized national outcome data exists yet.

Trend 4: Vertical Farming and Controlled-Environment Agriculture
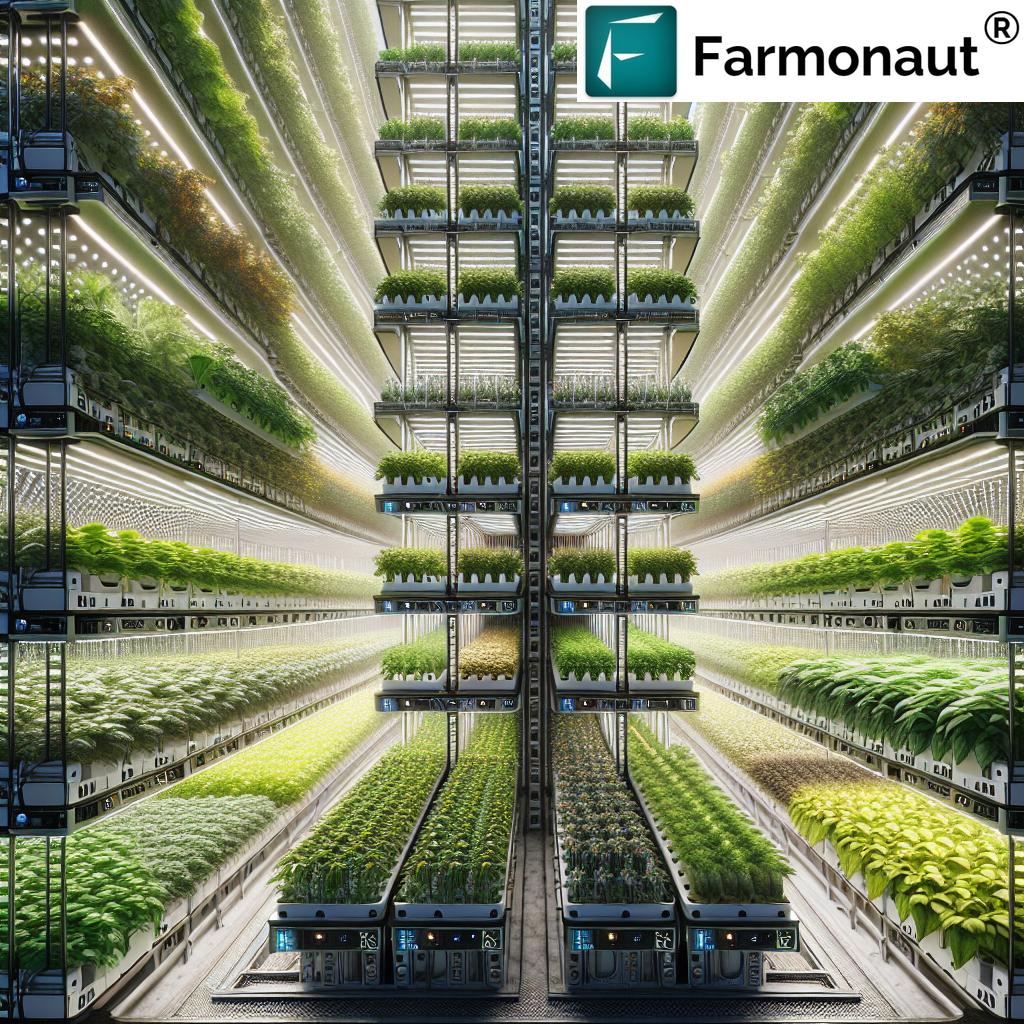
Controlled-environment agriculture (CEA) — hydroponics, aeroponics, and stacked vertical systems under LED lighting — decouples production from outdoor weather and soil entirely. It’s a different economic model from row-crop precision agriculture: capital-intensive per square foot, but productive year-round regardless of season or drought.
The Core Technology Stack
- Hydroponics & Aeroponics: Nutrient-enriched water or air replaces soil, cutting soil-borne disease risk and raising yield density per square foot.
- Tuned LED Lighting: Specific light wavelengths are matched to crop photosynthesis needs, controlling energy cost per unit grown.
- Automated Climate Control: Humidity, CO2, light intensity, and nutrient dosing are computer-managed per growing zone.
Farmonaut’s farm management app is built for monitoring assets and scheduling across growing operations, including CEA facilities tracking multiple zones or crop cycles in parallel.
Trend 5: Agrivoltaics — Dual-Use Solar and Cropland
Agrivoltaics puts solar panels over cropland or pasture, generating electricity and food from the same acreage. Panel shading can reduce heat stress and soil moisture loss for shade-tolerant crops, while grazing land under panels can extend usable pasture time in hot months.
- Crop-Panel Pairings: Shade-tolerant crops (leafy greens, some forage species) show the clearest benefit from reduced heat stress under panels.
- Livestock Integration: “Solar pastures” shade grazing animals, a welfare and productivity factor in hot regions.
- Dual Revenue: Landowners collect both energy-lease or generation revenue and crop or grazing income from the same parcel.
This is a category where public national yield and water-savings figures specific to US agrivoltaics installations are not consolidated in the sources reviewed for this article — treat site-specific claims skeptically until you can check a named study. Carbon footprint tracking from Farmonaut can help document the emissions-offset side of a dual-use installation for reporting purposes.
Trend 6: Blockchain in the Agriculture Supply Chain
Blockchain-based traceability creates an immutable record of a food product from planting through retail. For a deeper look at how this changes food-safety verification, see traceability in agriculture.
What Blockchain Actually Changes
- Food Authenticity: Consumers and buyers can trace a product’s origin and handling, verifying claims that used to rest on paperwork alone.
- Faster Recalls: A contamination event can be traced to its source lot instead of triggering a blanket recall.
- Payment Security: Reduces fraud and speeds verifiable payment across supply chain participants.
Farmonaut provides blockchain-based traceability solutions for agriculture and adjacent industries. Developers integrating satellite and traceability data can use Farmonaut’s API for agritech developers or the full API Developer Docs.
Trend 7: Nanotechnology in Agriculture
Nanotechnology engineers materials at the nanoscale to improve nutrient delivery, pest control precision, and early detection of crop stress — a deeper technical breakdown is in Farmonaut’s nanotechnology in agriculture piece.
Three Applications Worth Tracking
- Nanofertilizers: Improve nutrient absorption efficiency, cutting both fertilizer volume needed and runoff into waterways.
- Nanopesticides: Slower-release, targeted formulations reduce the total chemical load applied per acre.
- Nanosensors: Detect soil contamination, plant disease markers, or nutrient deficiency earlier than visual inspection allows.
As with agrivoltaics, this is an area where public, standardized US field-trial data is thin — nanotechnology in agriculture remains earlier-stage than the automation or precision-ag figures cited elsewhere in this article, and claims of specific yield or cost gains should be checked against a named peer-reviewed source before being treated as general fact.
The Role of Artificial Intelligence & Machine Learning
AI and machine learning sit underneath most of the trends above rather than standing apart: computer vision drives the automation in Trend 1, predictive models drive irrigation and fertilization timing in Trend 2, and nanosensor data streams in Trend 7 need machine learning to turn raw readings into action alerts.
- Climate-Adaptive Planning: AI models translate weather forecasts and historical patterns into planting and input-timing recommendations.
- Crop Breeding: Machine learning screens large genetic datasets to identify drought-, pest-, and disease-resistant traits faster than traditional breeding cycles.
- Resource Timing: AI advisory systems flag exactly when to irrigate, fertilize, or scout for pests based on current field conditions rather than a fixed calendar.
No official USDA survey currently tracks AI-specific technology adoption separately from the broader “precision agriculture” category — the 27% ERS adoption figure is the closest official proxy available, and it doesn’t isolate AI/ML from sensors and guidance systems. Farmonaut’s AI-based advisory system delivers satellite-driven crop advice and weather forecasting built on this same category of tooling. For financing tied to verified field conditions, crop loan and insurance verification via satellite speeds underwriting decisions for lenders and borrowers alike.
Calculator: What Precision Inputs Could Save You
Use your own acreage, crop, and current input cost to see what a percentage cut in fertilizer or water use — the kind precision-ag adopters report to Farmonaut — could be worth on your farm.
Run your own numbers
Assumes a flat percentage input reduction applied uniformly across all acres; excludes equipment, subscription, or sensor installation costs, and does not account for yield changes from precision adoption (not separately quantified in current USDA data — see Trend 2 above). Default yield and cost fields are pre-filled from USDA NASS’s 2024 corn average for reference only — replace them with your own figures.
Comparative Trends Table: Adoption Signal by Technology
| Trend / Technology | Verified US Adoption Signal | Source & Period | Environmental Angle |
|---|---|---|---|
| Precision Agriculture & Data Analytics | 27% of all US farms use ≥1 precision practice | USDA NASS/ERS, 2023 | Reduces water & fertilizer overuse, limits runoff |
| Automation & Guidance Systems | 70% of large-scale crop farms use autosteer/guidance | USDA NASS, 2023 | Cuts chemical inputs via precise application |
| Drone Scouting | 12% of large-scale crop-producing farms | USDA NASS, 2023 | Reduces unnecessary field passes |
| Sustainable/Regenerative Practices | Not unified nationally; tracked via EQIP enrollment only | USDA (program-level, not practice-level) | Improves soil health, supports biodiversity |
| Vertical Farming & CEA | No unified national adoption figure published | N/A — contact facility trade groups directly | Cuts land, water, and pesticide use per unit grown |
| Agrivoltaics | No unified national adoption figure published | N/A — early-stage, site-specific studies only | Reduces heat stress, dual land-use efficiency |
| Blockchain Traceability | Adoption not tracked by a federal survey | N/A — vendor/industry reports only | Cuts recall waste, reduces fraud |
| Nanotechnology | Early-stage; no federal adoption survey | N/A — peer-reviewed trials only | Reduces chemical volume via targeted delivery |
| Agtech Startup Investment (overall signal) | $6.07B across ~700 startups, +6.3% YoY | AgFunder, 2025 | Indicates capital flowing toward sustainability-linked tech |
Read this table plainly: the technologies with a specific USDA adoption number (precision ag, guidance, drones) are the ones with mature enough deployment to be worth a federal survey. The technologies without one — CEA, agrivoltaics, blockchain, nanotech — are earlier-stage, which is exactly why the $6.07 billion in 2025 agtech funding is chasing them: investors are pricing in adoption curves the government hasn’t measured yet.
How Farmonaut Fits In
Farmonaut’s focus is making the 27%-adoption category — precision agriculture and data analytics — accessible below the largest-farm tier that dominates USDA’s adoption figures. Satellite-based analytics, AI-driven advisory, and blockchain-enabled traceability are delivered through web and mobile apps rather than requiring a fleet of proprietary hardware.
Farmonaut’s Core Offerings:
- Satellite-Based Crop Health Monitoring: Real-time crop health and soil moisture insight on your device.
- AI-Powered Jeevn Advisory: Personalized input-timing and weather guidance aimed at cutting cost without cutting yield.
- Blockchain Traceability: End-to-end supply chain transparency — see more about traceability.
- Carbon Footprint Tracking: Document and reduce operational emissions for sustainability reporting.
- Fleet & Resource Management: Track farm equipment usage — see the fleet management solution.
- API Access: Build on Farmonaut data via the API and Developer Docs, including for agritech apps built for other markets.
Accessible via app and web browser, subscription tiers are built to scale from individual growers to enterprise and government accounts.
Adoption Barriers & How to Check Current Data
The gap between the 27% precision-ag adoption figure and full adoption isn’t mysterious — USDA’s own farm-size breakdowns point to the causes:
- Upfront Cost: The auto-steer adoption gap (7% smallest farms vs. 82% largest, per ERS) tracks capital access more than technology awareness. Subscription-based platforms like Farmonaut’s lower this barrier by replacing hardware purchases with per-season access.
- Data Privacy & Security: Farm data flowing through sensors, satellite platforms, and blockchain ledgers needs clear data-ownership terms before adoption — check any vendor’s data-use policy before signing on.
- Labor Transition: Automation shifts labor demand toward technical maintenance and data interpretation rather than eliminating it outright.
- Unquantified Categories: As the comparison table above shows, CEA, agrivoltaics, blockchain, and nanotech adoption aren’t federally tracked yet. If your operation needs current figures for one of these, the two levers below matter more than checking this or any other article a year from now.
Where to Get Fresher Numbers
This article’s core figures come from USDA NASS’s Crop Production reports, refreshed monthly during the growing season with a final forecast each January — check USDA NASS Newsroom directly for the current release. The precision-agriculture adoption rate (27% as of 2023) comes from a comprehensive USDA NASS survey that historically runs on a 3–4 year interval; there is no indication a newer comprehensive survey has been published as of this review, so check the USDA ERS Charts of Note page for whichever edition is current when you’re reading this. For cover-crop or regenerative-acreage figures specific to your county, USDA’s Census of Agriculture and your state’s land-grant extension office are the correct first calls, since no unified national total exists in current public reporting.
Frequently Asked Questions
What is precision agriculture and how many US farms actually use it?
Precision agriculture uses sensors, satellite imagery, and guidance systems to target water, fertilizer, and pesticide application by zone instead of by whole field. USDA ERS put adoption at 27% of all US farms in 2023, with adoption concentrated heavily on the largest operations (USDA ERS).
Which crop nutrition options best support sustainable agriculture?
Microbial fertilizers, precision-targeted synthetic application guided by soil sensors, and nanofertilizer delivery systems (Trend 7 above) are the three technology-driven options reducing both nutrient waste and runoff. USDA does not currently publish a ranked comparison of these by yield outcome — the honest answer is that the choice depends on your soil type and crop, and a state extension soil test is the correct starting point.
What counts as the “fourth agricultural revolution”?
The term generally refers to the current wave of digital and data-driven farming — sensors, AI advisory, automation, and satellite monitoring — following mechanization, the Green Revolution’s chemical/breeding advances, and biotechnology as prior shifts. It’s an ongoing shift, not a single dated event, and the trends in this article (automation, precision agriculture, AI) are its component parts.
How does data analytics improve farming efficiency?
It converts sensor, weather, and satellite data into specific irrigation, fertilization, and pest-control timing decisions rather than calendar-based ones, directly targeting the input categories where USDA’s adoption data shows the biggest farm-size gap.
Can small farms access advanced agricultural technologies?
Yes — Farmonaut’s satellite-based platform is built for small and mid-sized farms via subscriptions, Android/iOS apps, and APIs, specifically to close the adoption gap USDA’s farm-size data documents.
What is the role of blockchain in agriculture?
Blockchain creates a traceable, tamper-resistant record of a food product from farm to retail, supporting faster recalls and verified origin claims — see traceability in agriculture for the food-safety detail.
Does Farmonaut offer carbon footprint tracking?
Yes — Farmonaut’s carbon footprint tracking tool helps farms and agribusinesses monitor and report emissions.
How do I access Farmonaut’s services?
Via web and mobile apps, subscription plans, or the Farmonaut API for enterprise and research use.



Conclusion: A Continuing Shift, Not a Snapshot
The measurable part of agriculture technology innovation — automation, guidance systems, precision agriculture — is adopted unevenly by farm size and captured by USDA on a recurring survey cycle, not a one-time count. The less-measured part — regenerative practices, CEA, agrivoltaics, blockchain, nanotechnology — is where $6.07 billion in 2025 agtech investment is betting on adoption curves that haven’t been federally surveyed yet.
The durable way to evaluate any of this for your own operation: check USDA NASS’s Newsroom for the current crop production numbers, check ERS’s Charts of Note for the most recent precision-ag adoption survey, and benchmark your own farm size against the adoption gap those surveys already document, rather than against a single blended national average.
Farmonaut’s role is narrowing that gap for the operations USDA’s data shows are furthest behind — bringing satellite monitoring, AI advisory, and blockchain traceability to a subscription model scaled for smaller and mid-sized farms rather than only the largest operations the adoption data currently favors.
Start with Farmonaut — precision tools built for farms of every size, not just the largest ones.

 Godrej Agrovet
 Hayleys Agriculture
 Linx Agritech
 Adinet
 Save Your Soils
 GalaxEye Space
 Grandstream Algérie
 XOS Realty
 Geospatial Lab Africa
 Agro La Gándara
 HIPSAC
 ZOL Zimbabwe
 Juligerm
 AdBio
AdBio MISE Maroc
 NWNS
NWNS Red August Group
 Farm Inc
 WeMe Global
 Agrotoken
 Blue BearX
 Insignito
 DnCubed
 Indosistim Teknologi
 Liquify Digital
 CU Foods
 BeyondTech Global
 Rouge VC
 AgroRisk
 Oath Inc
 Esri North East Africa
 MDCV UK
 Etech Consulting Madagascar
 Vestlandsforsking
 WB Dev
 Sama Premium
 Tres Valles
 Blickwinkel
 Agricultural Credit Policy Council
 eKGIS
eKGIS Mostas Tech
 Andex
Andex Deluxe Conseil
 WICO
WICO Chimera Innovation
 SkyHarvest
 Teledarbas
 Exurbia Geospatial
 FieldZero
