

Reviewed August 2026 against World Bank/ILO development indicators, USDA (ERS and NASS), and FAO country data.
Agricultural Density: Egypt vs the US, Measured Properly
Agricultural density is the number of farmers divided by the area of arable land they work. On World Bank and ILO figures for 2023–2024, Egypt carries roughly 191 farmers per square kilometre of arable land — one farmer for every 1.3 acres — while the United States carries 1.7, or one farmer per 143 acres of cropland. That is a gap of about 110 times, and it is the single most useful number in this whole subject.
One warning before you copy a figure into an assignment or a board deck: the number “3,500 per km²” that circulates for Egypt is not its agricultural density. It is Egypt’s physiological density — total population per unit of arable land — and confusing the two is the most common error in this topic. Both numbers are computed below, from the same source data, so you can see exactly where they diverge.
| Country | Arithmetic density (people per km² of land) |
Physiological density (people per km² arable) |
Agricultural density (farmers per km² arable) |
Land per farmer |
|---|---|---|---|---|
| Egypt | 117 | 3,756 | 191 | 1.3 acres |
| Netherlands | 534 | 1,783 | 17.2 | 14 acres |
| United States | 37 | 224 | 1.7 | 143 acres |
| Canada | 4.7 | 108 | 0.63 | 393 acres |
Read across a row and the same country changes character. Egypt is only about three times denser than the US arithmetically, but seventeen times denser physiologically and 110 times denser agriculturally. Which measure you choose decides the story you tell.
The three formulas, and which one you actually want
All three densities share a numerator-over-area shape. They differ only in what goes on top and what goes underneath.
- Arithmetic density = total population ÷ total land area. Tells you how crowded a country is. Says nothing about farming.
- Physiological density = total population ÷ arable land area. Tells you how many mouths each farmable square kilometre must feed.
- Agricultural density = number of farmers ÷ arable land area. Tells you how labour-intensive the farming system is, and by implication how mechanised it is not.
The denominator matters as much as the numerator. “Arable land” in World Bank and FAO accounting means land under temporary crops, temporary meadows, market gardens and land temporarily fallow — double-cropped area counted once. That last clause is important for Egypt, which crops most of its land twice a year: FAO’s country water profile records an annual cropping ratio of roughly 2:1, so the cropped area is close to double the arable area. Quote a density built on cropped area and you will get half the number someone else gets. Say which you used.
The numerator for agricultural density is harder than it looks. There is no global register of farmers. The workable method — the one used for every figure on this page — is: take the national labour force, subtract unemployment, multiply by the agricultural share of employment. The World Bank’s employment-in-agriculture indicator carries ILO-modelled estimates from 1991 to 2025 and is the cleanest cross-country series available. It counts everyone employed in agriculture, forestry and fishing — hired labour as well as operators — so it runs higher than a count of farm owners. Related trends in farm labour and population are covered in our overview of agricultural population density.
The durable check: does your number survive a unit test?
Before publishing any density figure, run these four checks. They do not expire when the data does.
- State the year of each input separately. Arable land and population are almost never from the same reporting year. Ours pairs 2023 land with 2024 population.
- Convert to land-per-person and sanity-check it. 191 farmers/km² inverts to 1.3 acres per farmer. If your inversion gives an absurd figure, the density is wrong.
- Name the denominator. Arable, agricultural (which adds permanent pasture), or cropped. Egypt’s agricultural land is 40,580 km² against 31,030 km² arable — a 31% difference that will silently move your answer.
- Cross-check the numerator against a second source. For the US, the ILO-derived 2.62 million agricultural workers should sit in the same neighbourhood as USDA’s producer count. It does.
Egypt’s numbers, worked step by step
Here is the full arithmetic, so you can update any input as new data lands.
- Arable land: 3,103,000 hectares in 2023 — 31,030 km², about 7.67 million acres — per the World Bank arable-land series for Egypt. The series is updated annually; check it for a fresher year.
- Total land area: 995,450 km². Arable land is therefore 3.1% of Egypt — the “less than 5% is farmable” claim, sourced.
- Population: 116,538,258 in 2024 (World Bank).
- Labour force: 35,343,331 in 2024; unemployment 6.82%; agricultural share of employment 17.98%. That gives roughly 5.92 million agricultural workers.
Divide and you get: arithmetic density 117 people/km²; physiological density 3,756 people/km² of arable land; agricultural density 191 farmers/km² of arable land. Agriculture, forestry and fishing contributed 13.71% of Egypt’s GDP in 2024, up from 10.60% in 2023 (World Bank) — a sector that employs 18% of workers and produces 14% of output.
Note what the arable series does not show: runaway expansion. It peaked at 3,365,000 ha in 2020, fell back to 3,077,000 ha in 2021, and has sat at 3,103,000 ha for 2022 and 2023. Reclamation projects add land; urban encroachment on the Delta subtracts it. The net has been roughly flat while population added about two million people a year.
Why the physiological figure dwarfs the agricultural one
Egypt’s physiological density is 20 times its agricultural density because 82% of Egyptians do something other than farm, yet all of them eat from the same 31,030 km². The slope chart makes the pattern visible: the Netherlands is denser than Egypt arithmetically and still ends up far below it physiologically, because a much larger share of Dutch territory is farmable. Canada starts at almost nothing and stays low. Egypt has the steepest climb of the four.
Density calculator
Enter your own figures — any country, any year, any land unit — and all three densities are computed on the definitions above.
Run your own numbers
Assumes your arable-land figure counts double-cropped area once, as World Bank and FAO series do. Excludes permanent pasture, permanent crops and fallow beyond one season, and makes no adjustment for part-time or seasonal labour. Land per farmer is reported in acres.
US agricultural density, and how to get it by state
The national figure: 151,563,525 hectares of arable land in 2023 (1,515,635 km², or 374.5 million acres) against roughly 2.62 million agricultural workers derived from a 174.2 million labour force, 4.02% unemployment and a 1.57% agricultural employment share. That is 1.73 farmers per km² of arable land, or one per 143 acres.
Cross-check it against USDA. The Economic Research Service put the US at 1.88 million farms on 876 million acres of land in farms in 2024, averaging 466 acres. The 2022 Census of Agriculture counted 3.4 million producers. Divide 3.4 million producers by 374.5 million acres of cropland and you get one producer per 110 acres — the same order of magnitude as the ILO-derived 143, with the gap explained by producers who farm pasture rather than cropland. Two independent methods landing within 30% of each other is about as good as this metric gets.
To compute it for your own state or county: pull "Farm Operations — Number of Operations" and "Ag Land, Cropland — Acres" from USDA NASS Quick Stats, filtered to the same census year and the same geography. Quick Stats holds data from 1870 through 2026 at state, county and agricultural-district level. Divide operations by cropland acres, multiply by 259 to convert to per-km². The Census of Agriculture runs every five years, so the county layer refreshes on that cycle rather than annually.

What "low agricultural density" means
Low agricultural density means few farmers spread across a lot of farmable land. Canada is the textbook case at 0.63 farmers per km² of arable land — 393 acres per worker, roughly 300 times Egypt's labour intensity. It is a signature of capital substituting for labour: combines, air seeders, GPS guidance and contract harvesting.
Low density is not automatically good and high density is not automatically bad. What low density reliably signals is:
- High capital intensity. Machinery and inputs do what hands used to.
- Consolidation. US average farm size rose from 441 acres to 466 acres between the 2017 and 2022 census periods while total farmland fell 3% from 900 million acres.
- Labour scarcity as the binding constraint. A missed planting window costs more than a wasted input.
- Monitoring at a distance. One operator covering 400 acres cannot walk them, which is why remote sensing gets adopted fastest exactly where agricultural density is lowest.
Pro tip
Agricultural density and farm size are near-perfect inverses, so if you have one you can derive the other. Historical land-use questions get sharper when the density series is paired with modern land-accounting methods such as carbon footprinting per hectare, which normalises emissions to the same denominator.
Does crowding cost yield?
No. Egypt runs 110 times the labour per hectare of the US and gets cereal yields within 12% of it: 7,402 kg/ha in 2023 against the US at 8,330 kg/ha, the Netherlands at 8,080 and Canada at 3,695 (World Bank). Canada, with the lowest agricultural density of the four, has by far the lowest yield — because prairie grain is largely rain-fed on a short season, while Egypt irrigates essentially everything. FAO's country water profile notes the entire Egyptian crop area is irrigated apart from a strip of rain-fed land on the Mediterranean coast.
So agricultural density predicts how land is farmed, not how well. It is a labour statistic wearing an agronomy costume.

The feddan trap — and land prices
Egyptian farm statistics are reported in feddans, not hectares, and every density figure you build from an Egyptian source needs converting first. The conversion is fixed: 1 feddan = 4,200 m² = 0.42 hectares = 1.038 acres. FAO's Egypt water profile uses exactly this factor and records the average farm unit at 2.5 feddans — about 2.6 acres. Egypt's 3,103,000 hectares of arable land is therefore about 7.39 million feddans.
| Unit | Square metres | Hectares | Acres |
|---|---|---|---|
| 1 feddan | 4,200 | 0.42 | 1.038 |
| 1 acre | 4,047 | 0.4047 | 1 |
| 1 hectare | 10,000 | 1 | 2.471 |
| 1 kirat (1/24 feddan) | 175 | 0.0175 | 0.043 |
On land prices per feddan: there is no official, regularly published Egyptian series comparable to a USDA land-value survey, and any single dollar figure you see quoted is a broker's asking price, not a national average. Two things make it worse — the price depends heavily on whether the parcel is old Nile Valley land or newly reclaimed desert, and any dollar conversion moves with the Egyptian pound. The honest method: collect asking prices for comparable parcels from Egyptian land listings, convert per-feddan to per-acre by dividing by 1.038, and convert to dollars at the exchange rate on the date you collected them — then state both the date and the rate. For a benchmark on the US side, USDA publishes national and state cropland values through its Land Values charts and maps, released each August.
Why Egypt ended up this way
The density is a geographic inheritance, not a policy choice. The Nile's annual flood deposited silt on a narrow ribbon and left everything beyond it desert, so population concentrated where the water was. Wheat, barley and flax underwrote the state; the crops and techniques are covered in our piece on what ancient Egyptians grew. The ratio of people to farmable land was extreme then for the same reason it is extreme now: the denominator has barely moved in five thousand years while the numerator has multiplied.
What has changed is the pressure valve. Where a Nile-bound system once had nowhere to expand, three responses now compete: desert reclamation in the Western Desert and Sinai, which adds arable land slowly and at high water cost; vertical and protected cultivation, the same logic behind rooftop and urban farming in dense North American cities; and yield intensification on existing ground. The 2018–2023 arable series above suggests the first of these is currently running about even with urban encroachment.


Measuring cropped area from orbit
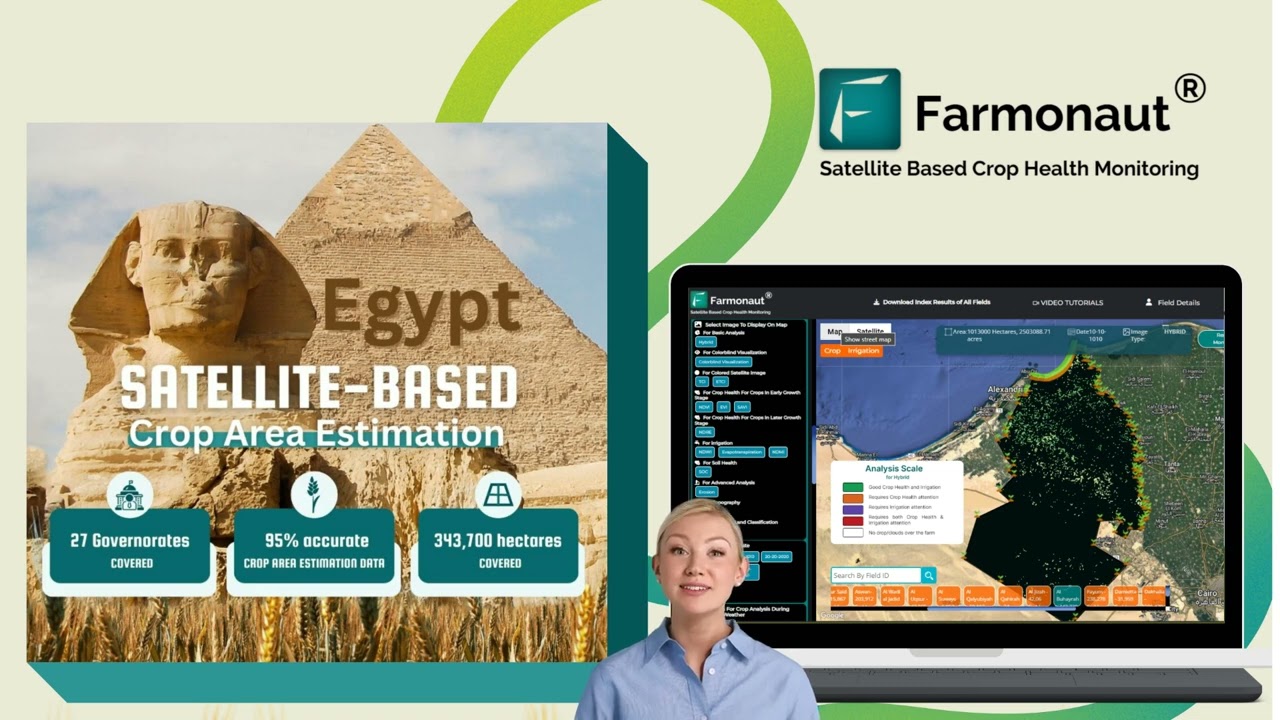
Every density on this page depends on a land denominator that national statistics update once a year at best. Satellite imagery updates it far more often, and that is where our work at Farmonaut fits: multispectral time series give a cropped-area estimate for a defined boundary without waiting for the next census round, which matters most where double-cropping makes annual arable figures misleading.
- Area and crop-health monitoring across dispersed parcels through the large-scale farm and admin platform.
- Machinery logistics for consolidated, low-density operations via fleet management.
- Satellite-verified acreage for lending and cover decisions — see crop loan and insurance.
- Chain-of-custody records through product traceability.
- Programmatic access for analysts building their own density series: the satellite API and its developer documentation.







FAQ
What is Egypt's agricultural density?
About 191 farmers per km² of arable land, derived from World Bank 2024 labour data and 2023 arable land of 3,103,000 hectares. Inverted, that is 1.3 acres — or 1.25 feddans — per agricultural worker.
What is Egypt's physiological density?
3,756 people per km² of arable land (116,538,258 people in 2024 ÷ 31,030 km²). This is the figure usually misquoted as "agricultural density," and it is roughly 20 times larger.
What is the population of Egypt?
The World Bank recorded 116,538,258 for 2024, with the series running to 2025. Egypt's statistics agency CAPMAS maintains a live population clock that counts residents inside Egypt and therefore reads lower than international estimates, which include Egyptians abroad. For projections, the UN's World Population Prospects is the standard reference. Check whichever you cite on the day you cite it and state which definition you used — the two differ by several million.
How much arable land does Egypt have?
3,103,000 hectares in 2023 — 31,030 km², 7.67 million acres, or 7.39 million feddans — which is 3.1% of the country's 995,450 km² land area. Agricultural land including pasture is larger at 40,580 km².
Which countries have low agricultural density?
Highly mechanised exporters. Canada sits at 0.63 farmers per km² of arable land and the US at 1.73. The Netherlands, at 17.2, is roughly ten times the US despite being one of Europe's most intensive producers — a reminder that "low" is relative to the comparison set you choose.
How do I calculate agricultural density myself?
Divide agricultural workers by arable land area, keeping both in consistent units, and record the year of each input. Use the calculator above, or pull the raw series from World Bank WDI for international comparisons and USDA NASS Quick Stats for US state and county figures.
The one thing to take away
Agricultural density is a labour-per-land ratio, and it only means something when the denominator, the year and the worker definition travel with it. Egypt at 191 and the United States at 1.7 describe two farming systems solving the same problem from opposite ends — one with people, one with machines — at almost identical cereal yields. Run your own figures through the calculator, note the vintage of every input, and the number will still hold up when the underlying series update.
Discussion
Questions, corrections or field experience? Share them below. First-time comments are reviewed before they appear, and your email is never published.
No comments yet. Be the first to add a question or your experience.

 Vizexec Transformation
 GalaxEye Space
 Sun Palm Australia
 Grandstream Algérie
 XOS Realty
 Geospatial Lab Africa
 Agro La Gándara
 HIPSAC
 ZOL Zimbabwe
 Juligerm
 AdBio
AdBio MISE Maroc
 NWNS
NWNS Red August Group
 Farm Inc
 WeMe Global
 Agrotoken
 Blue BearX
 Insignito
 DnCubed
 Licence holder · Niger · Gold
 Licence holder · Nigeria · Gold + lithium










