

Saudi Arabia · Water and crop guide
Farming in Saudi Arabia: 7 Innovations and Water Data
Agriculture took about 82% of Saudi freshwater withdrawals in 2022 (World Bank), and non-renewable sources supply 90% of farm water (MEWA). Seven innovations aim to grow more per cubic metre, from precision irrigation to satellite monitoring.
Key takeaways
- Withdrawals were about 23.4 billion cubic metres in 2022, against about 2.4 billion of renewable internal freshwater (World Bank).
- Fodder takes 67% of farm water need, and irrigation efficiency is around 50% against a best practice above 75% (National Water Strategy, MEWA).
- Cereal output peaked near 5.0 million tonnes in 1993 and was about 1.17 million tonnes in 2024 (World Bank).
- FAO forecasts about 1.1 million tonnes of wheat in 2026 and cereal import needs of 15 million tonnes for 2026/27.
- Hydroponic lettuce in a 2015 Arizona study used far less water per kilogram but about 82 times the energy.
In this article
- Farming in Saudi Arabia at a glance
- Why water decides what farmers can grow
- 7 innovations in Saudi farming
- The seven innovations compared
- Food security: what the kingdom grows and what it buys
- Soil, trees and rural change
- Roads, cold chains and agribusiness
- How to start farming in Saudi Arabia: a checklist
- Does an irrigation upgrade pay?
- FAQ
Farming in Saudi Arabia is a contest with water. Agriculture took about 82% of the kingdom’s freshwater withdrawals in 2022, according to World Bank data on agricultural water withdrawals, while rain averages about 59 mm a year. The innovations that matter are the ones that grow more food per cubic metre: better irrigation, protected crops, soilless systems, salt-aware soil care, a changed crop mix, tighter links between feed and livestock, and satellite monitoring.
This guide covers those seven innovations with dated figures from the World Bank, FAO and Saudi government bodies. It shows where the grain and the water really go. It also has a calculator so a grower or agtech team can test whether an irrigation upgrade pays on their own numbers.
Farming in Saudi Arabia at a glance
Farming is a small part of the national economy but a very large part of its water use. Agriculture, forestry and fishing added about 2.6% of GDP in 2025, by World Bank national accounts data. The same database gives a modelled estimate of about 2.5% of jobs for 2025.
Land figures need care. The World Bank counts about 82% of the land area as agricultural in 2024, but that class includes permanent pasture, much of it dry range. Arable land was about 2% of land area in 2024. Irrigated land was about 0.4% of agricultural land in the same year. So the crops people picture sit on a tiny share of the map.
| Measure | Figure | Year and source |
|---|---|---|
| Rainfall | About 59 mm a year | 2022, World Bank |
| Arable land | About 2% of land area | 2024, World Bank |
| Farm water share | About 82% of withdrawals | 2022, World Bank |
| Fodder water share | 67% of farm water need | National Water Strategy, MEWA |
| Wheat crop | About 1.1 million tonnes (forecast) | 2026, FAO GIEWS |
| Cereal imports needed | 15 million tonnes (forecast) | 2026/27, FAO GIEWS |
| Dates | More than 1.9 million tonnes a year | National Center for Palms and Dates |
Which crops are grown
Three groups stand out. Dates are the signature crop: the National Center for Palms and Dates lists 127 million palm trees and more than 123,000 palm farms, with more than 300 varieties. Wheat is grown under a government quota. Fodder feeds the dairy, poultry and sheep sectors. Vegetables such as tomatoes, cucumbers, peppers and lettuce, plus fruit such as figs and citrus, fill out the mix, often in protected plots.
Cereal area has shrunk a long way. Land under cereals was about 1.12 million hectares in 1992 and about 230,000 hectares in 2024. Cereal yield in 2024 was about 5.1 tonnes per hectare, on the World Bank’s figures, so the fields that remain are heavily managed.
The rise and fall of the grain boom
The cereal line tells the story of the sector. Output went from about 0.27 million tonnes in 1980 to a peak of about 5.0 million tonnes in 1993, then fell back. In 2024 it was about 1.17 million tonnes, on World Bank cereal production data. The swings are large from year to year as well: 2023 came in at about 1.71 million tonnes.
The lesson shaped everything after it. Large volumes of grain can be grown in a desert with deep wells, but groundwater that does not refill sets a limit. Today’s wheat quotas are set with that limit in view, as the next sections show.
Chart
Saudi cereal production
Million tonnes, every fourth year from 1980 to 2024
Why water decides what farmers can grow
The kingdom has no shortage of sun or flat land. It is short of water that refills. Total withdrawals were about 23.4 billion cubic metres in 2022, against about 2.4 billion cubic metres of renewable internal freshwater. That gap is filled by old groundwater, desalination and treated wastewater.
Chart
Water withdrawn vs water renewed
Billion cubic metres a year, 2022
The National Water Strategy from the Ministry of Environment, Water and Agriculture sets out the farm side plainly, using 2015 as its base year. It puts total water need at 24.8 billion cubic metres, with agriculture at 84%. It says non-renewable sources supply 90% of water used by farms. Fodder alone takes 67% of farm water need. Irrigation efficiency is around 50%, compared with a best practice above 75%.
Those four numbers explain most of the policy news you will read. If a reader wants one sentence on the sector, it is this: fodder and low irrigation efficiency are where the largest savings lie, and that is where new technology is aimed.
Where desalinated and treated water fit
A common belief is that desalination waters Saudi farms. The ministry’s strategy describes something different. Desalination supplies 60% of urban water, and it is costly because water must also be pumped from the coast to inland cities. Farms draw mainly on groundwater.
Treated wastewater is the farm source with room to grow. The ministry says it is not used to its full potential, and it names weak infrastructure, public perception, limited regulatory oversight and pricing incentives as the reasons. Peri-urban farms and tree planting are natural users. Anyone planning to use it should check local rules on which crops it may irrigate.
7 innovations in Saudi farming
The list below follows the farm from water to market. Each entry says what the method does, what the evidence shows, and what it does not solve.
1. Precision irrigation: drip, sprinkler and pivots
Moving from flood irrigation to pressurised systems is the largest single lever. FAO’s irrigation training manual gives indicative field application efficiencies of 60% for surface irrigation, 75% for sprinklers and 90% for drip. Those are guide values, not measured Saudi results, and FAO says so.
Drip also changes how the crop drinks. FAO notes that drip may wet as little as 30% of the soil volume wetted by other methods. That suits date palms and orchards. On salty water it needs care, because salts collect at the edge of the wetted zone and must be flushed.
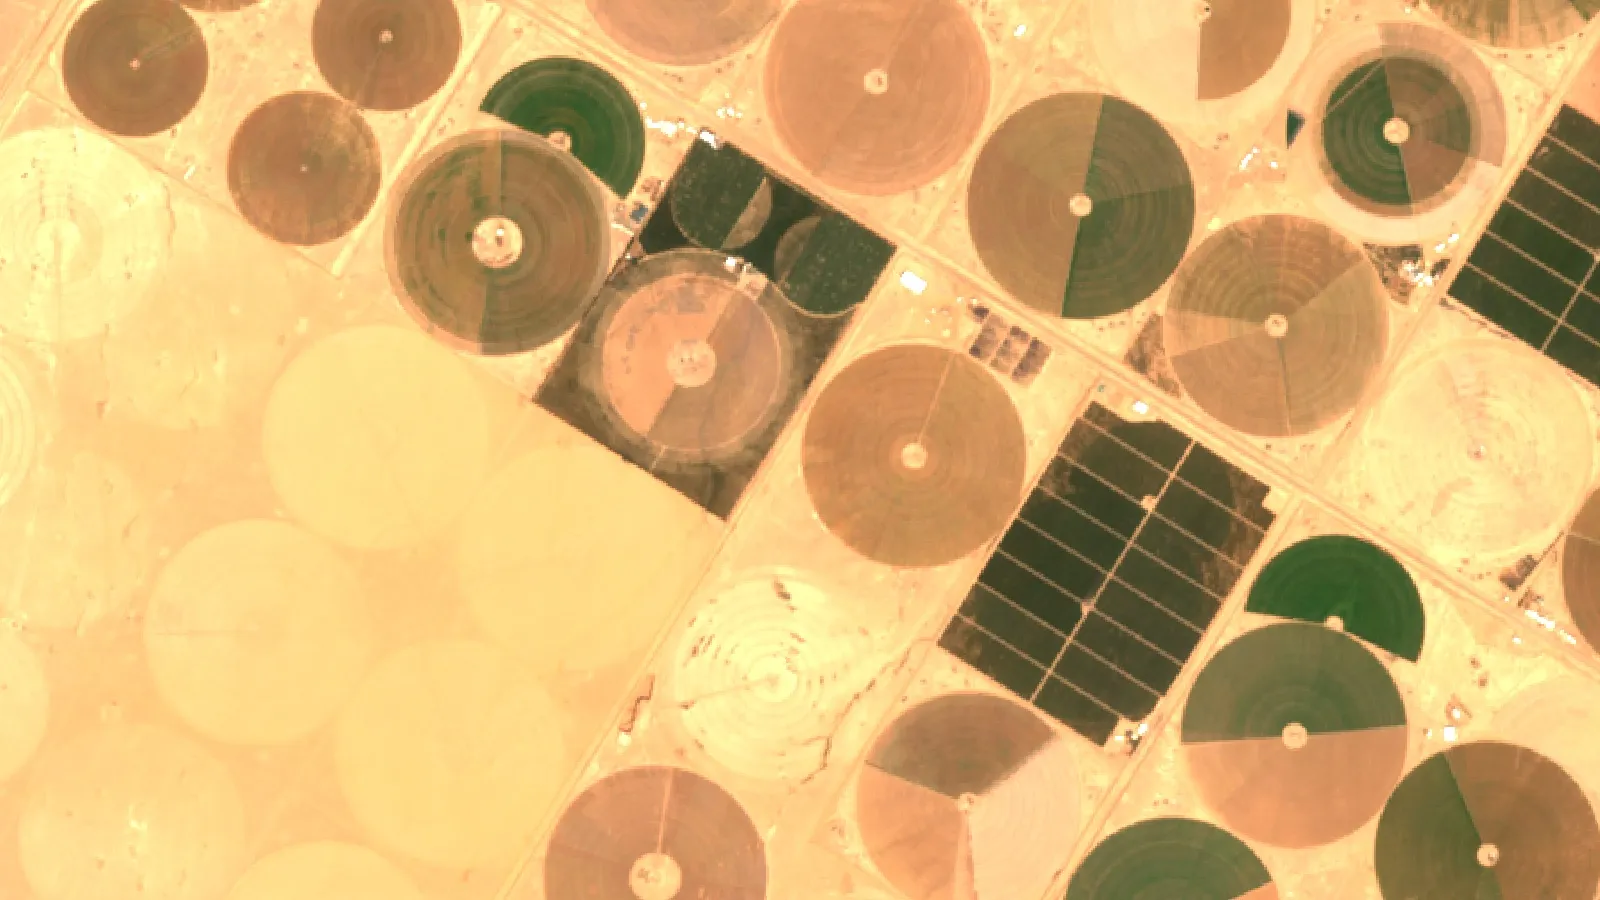
Centre pivots remain the visible face of desert grain and fodder, as the circles in the satellite image at the top of this page show. Their job is even application over large fields, and sensors and scheduling software can trim each pass.
Best for: every farm with a pumping bill. Limit: a more efficient system saves water at the farm level only if the saved water is not simply used to plant more area.
2. Climate-controlled greenhouses
Greenhouses shield crops from heat, dust and many pests. They allow tomatoes, cucumbers, peppers, leafy greens and berries to be grown for more of the year. Fertigation, which feeds nutrients through the irrigation line, is standard in these systems.
The trade-off is cooling. Summer heat makes evaporative pads or chillers a major design choice, and pad cooling itself uses water. A grower should compare water and power per kilogram of saleable crop, not per square metre of roof. No single national figure for greenhouse area appears in the official sources used for this guide, so treat any number you see with care unless it names its source.
Best for: high-value vegetables close to city markets. Limit: capital and summer energy cost.
3. Hydroponics and aquaponics
Soilless systems recirculate nutrient solution, so little water is lost to drainage. The best-known comparison comes from a 2015 study of lettuce in Yuma, Arizona. Modelled hydroponic lettuce gave about 11 times the yield per square metre and used about 20 litres per kilogram, against 250 litres for field lettuce. It also needed about 82 times as much energy per kilogram.
That last number matters as much as the first two. The study used engineering estimates for a heated and cooled greenhouse in Arizona, so it is a guide and not a Saudi result. In a hot desert the power bill decides whether the crop pays. Aquaponics adds fish to the loop and reuses their waste as plant feed, with more biological risk to manage.
Best for: leafy greens and herbs near buyers. Limit: energy, skills, and crops with a low price per kilogram.
4. Soil and salinity management
Desert soils are often sandy, low in organic matter and exposed to salty irrigation water. Good practice starts with testing soil and water, then matching the amendment to the result. Organic matter improves water holding in sand. Leaching is planned so that salts move below the root zone. Rotation and reduced tillage help keep structure and moisture.
Mistakes here are expensive. Adding amendments without a test can leave a field unbalanced, and heavy irrigation without drainage can push salt up instead of down. Check product labels and local rules, and get advice from an agronomist before applying soil treatments at scale.
Best for: new land and fields irrigated with brackish water. Limit: results are slow and field-specific.
5. Crop diversification and tolerant varieties
A changed crop mix is the biggest policy lever, because the crop decides the water bill. With fodder at 67% of farm water need on the ministry’s figures, moving hectares from thirsty forage to dates, vegetables or imported feed saves more than any pump upgrade. Wheat is now managed the same way: FAO’s GIEWS country brief of July 2026 says production runs under a quota, with targets set according to groundwater availability.
The wheat price is still an incentive. FAO reports a procurement price of SAR 1,450 per tonne for the 2025/26 season, well above international export prices, and says this encouraged small farmers to plant more. Planting began in mid-October 2025, and harvest finished in May 2026. The crop is forecast at about 1.1 million tonnes, nearly 8% above average.
Dates remain the strongest export story. The national centre ranks the kingdom first in the world for date exports by value and reports exports of 1.938 billion for 2025. The centre’s page prices date output at SAR 9.2 billion. Breeders and growers also work with heat- and salt-tolerant cultivars of dates, figs and citrus, and with medicinal and aromatic plants for niche markets.
Best for: planners and investors deciding what to plant. Limit: market size, and the fact that grain and feed must then be bought abroad.
6. Livestock and feed integration
Dairy, poultry, sheep, goats and camels are central to rural income and to diets. Feed is the link back to water. FAO says the high import need for maize and barley reflects strong demand for feed grain from the growing poultry and livestock sectors, underpinned by government support for poultry.
On the farm, integration means using crop residues as feed, returning manure to fields, tracking feed conversion, and keeping up disease surveillance and biosecurity. The World Bank livestock production index stood at 140 in 2024, against a 2014-2016 base of 100, though it was higher in every year from 2020 to 2023. Follow veterinary advice and local rules on animal health and feed.
Best for: mixed farms with residue and manure to reuse. Limit: feed self-sufficiency is not realistic at current herd and flock demand.
7. Satellite, sensor and AI monitoring
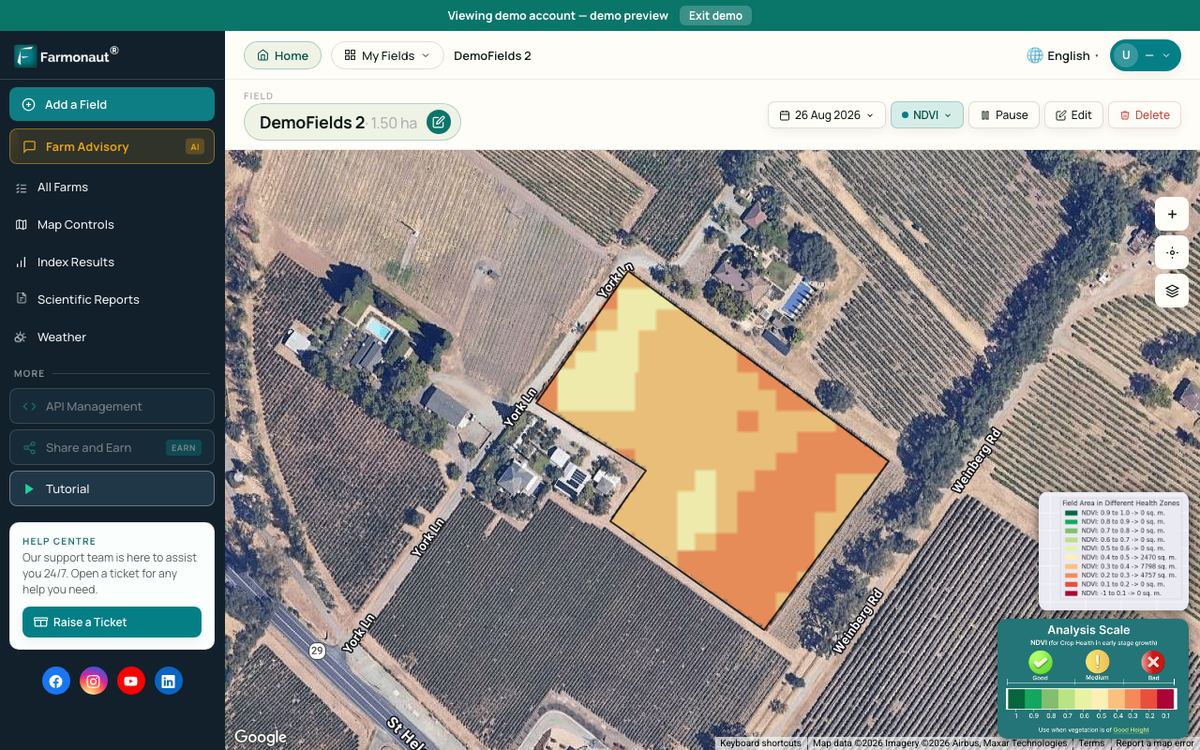
Large pivot farms and scattered palm groves are hard to walk. Satellite images show changes in vegetation across every field every few days, and soil moisture sensors add a reading at the root zone. Together they help a manager spot an uneven pivot, a blocked drip line or a stressed block early. A satellite shows that a crop is changing; a field visit still has to find the cause.
For agtech teams, the practical step is plugging this data into existing software instead of building it from scratch. Farmonaut offers an agriculture API for satellite crop data, and its developer documentation and API console show how the feeds are called.
Data is also moving along the supply chain. Traceability records help exporters prove where a product came from, and fleet tools help coordinate machines and transport across long rural distances.
Best for: large or remote holdings and agtech builders. Limit: the data helps only if someone acts on it.
▶ Tutorial: monitoring crops by satellite and AI in the Farmonaut web system · 8:43
The seven innovations compared
The table compares the methods by the problem each one tackles. It leaves out national hectare and yield-gain figures, because none of the official sources used here publishes them by method.
| Innovation | Main problem it tackles | Evidence to check | Main limit |
|---|---|---|---|
| Precision irrigation | Water lost in the field | FAO guide values: 60%, 75%, 90% | Savings can be replanted |
| Greenhouses | Heat, dust, pests | Water and power per kg of crop | Summer cooling cost |
| Hydroponics | Water and poor soil | Yuma study: 20 vs 250 L/kg | 82 times the energy in that study |
| Soil and salinity | Salt and low organic matter | Soil and water tests by field | Slow, site-specific |
| Crop mix | Thirsty crops | Fodder at 67% of farm water | More imports |
| Livestock and feed | Feed cost and waste | Feed conversion records | Grain must be imported |
| Monitoring | Late detection of problems | Field checks against the maps | Needs someone to act |
Chart
The irrigation efficiency gap
Percent; the strategy gives best practice as more than 75%
Food security: what the kingdom grows and what it buys
Lower cereal output has a clear counterpart in imports. FAO forecasts cereal import needs of 15 million tonnes for the 2026/27 marketing year (July to June), more than 10% above the five-year average. That breaks down into about 5 million tonnes of barley, 4 million tonnes of maize and 4 million tonnes of wheat. Against this, the domestic wheat crop is forecast at about 1.1 million tonnes.
Chart
Forecast grain imports vs home wheat crop
Million tonnes; imports for 2026/27, wheat crop for 2026
The General Food Security Authority buys wheat through international tenders from a range of exporters and keeps strategic stocks, FAO reports. Food made up about 12% of merchandise imports in 2025 on World Bank trade data. Food inflation stayed low, at 0.7% in May 2026.
For outside suppliers this is the commercial heart of the story. Saudi demand for feed grain and wheat is steady and large, while local farms focus on what they can grow with less water or sell at higher value.
Soil, trees and rural change
Policy on soil goes hand in hand with policy on water. Extension services promote better pest, nutrient and water management, and remote sensing can map field-to-field differences. Three field habits come up again and again in arid-land advice: add organic matter for structure, rotate crops to reduce disease pressure, and limit tillage to conserve moisture and reduce erosion.
Trees are a smaller but visible part of the picture. Forest covers about 1.3% of land area on World Bank figures for 2024. Windbreaks and planted belts can stabilise soil, shelter crops and improve local conditions. Species choice matters: they need to survive heat and salt, and treated wastewater is the likely irrigation source. Like crops, trees use water, so planting needs a water budget too.
Roads, cold chains and agribusiness
A desert farm is only as good as its route to market. Vegetables and dairy need cold chains. Dates need grading, packing and certification to reach export buyers. Roads and logistics hubs connect far-off producing areas to Riyadh, Jeddah and Gulf markets.
Support reaches small growers too. The national palm centre lists an annual purchase programme that buys dates from small farmers above market prices, along with subsidies and support for farmer associations. Startups in this space sell to these same growers and to the large integrated dairy and poultry firms. Check the current terms of any support programme with the agency that runs it, and take professional advice before making an investment decision.
▶ How precision tech, satellites and AI are changing farming · 13:27
How to start farming in Saudi Arabia: a checklist
If you are weighing a project or an agtech product for this market, work through these steps in order.
- Secure the water first. Confirm the source, its quality, its legal status and the licence terms. Check salinity before you choose a crop.
- Choose the crop by value per cubic metre. Compare margin per unit of water, not per hectare.
- Match the system to the crop. Drip for palms and orchards, pivots for broad fields, protected systems for high-value vegetables.
- Price the energy. Include pumping, cooling and any treatment.
- Test soil, then amend. Plan drainage and leaching from the start.
- Line up the buyer and the cold chain. Do this before you plant.
- Measure from day one. Record water applied, yield and crop condition by field, so that each season can be compared with the last.
Does an irrigation upgrade pay?
The ministry’s figures give a useful starting point: efficiency near 50% in the National Water Strategy (2015 base year) against a best practice above 75%. The calculator turns that gap into water and money for one farm. Enter your own crop water need, efficiency levels, water cost and upgrade cost per year. The default values are examples only and are set close to break-even.
Try the numbers for your own farm below.
Calculator
Would better irrigation pay on your farm?
Enter your own numbers to see water and money saved each year.
- Water pumped now: 1,600,000 m3
- Water pumped after upgrade: 1,066,667 m3
- Water saved: 533,333 m3
- Yearly upgrade cost, US$: $50,000
Example values only, not a benchmark or forecast; they are set close to break-even. The 50% and 75% defaults echo the MEWA National Water Strategy figures. Water cost is an example, use today’s price. 1 mm over 1 ha equals 10 cubic metres.
FAQ
Is farming possible in Saudi Arabia?
Yes, but nearly all crops depend on irrigation. Rain averages about 59 mm a year on World Bank figures, and arable land was about 2% of land area in 2024. Non-renewable groundwater supplies 90% of farm water, according to the National Water Strategy.
What are the main crops in Saudi Arabia?
Dates, wheat and fodder are the main groups. The national palm centre reports more than 1.9 million tonnes of dates a year, and FAO forecast about 1.1 million tonnes of wheat for 2026. Tomatoes, cucumbers, peppers, lettuce, melons and citrus are also grown, many of them under cover.
Does Saudi Arabia import most of its food grains?
For cereals, yes. FAO forecasts import needs of 15 million tonnes for 2026/27, including 5 million tonnes of barley, 4 million of maize and 4 million of wheat. The domestic wheat crop is forecast at about 1.1 million tonnes.
How much water does drip irrigation save?
It depends on the starting point. FAO’s guide values are 60% field application efficiency for surface irrigation, 75% for sprinklers and 90% for drip. At those values, a crop that needs the same water would take about a third less applied water on drip than on surface irrigation, before any change in area planted.
Is hydroponics the answer for desert farming?
It helps for some crops. A 2015 Arizona lettuce study estimated about 11 times the yield and much less water per kilogram, but about 82 times the energy. It suits leafy greens sold close to the buyer. It does not suit grain or fodder.
Why does the government limit wheat?
Because of groundwater. FAO says annual production targets under the quota programme are set according to groundwater availability. Procurement at a set price then gives growers within the programme a reason to plant.
Related pages on our site: farm carbon tracking, product traceability, large-farm management, fleet management, crop loan and insurance checks, web app.
For agtech teams
Add satellite crop data to your product
The Farmonaut agriculture API supplies satellite crop data for the fields your software manages.



Keep reading
Sources
- World Bank, Annual freshwater withdrawals, agriculture (2022): data.worldbank.org
- World Bank, Renewable internal freshwater resources (2022): data.worldbank.org
- World Bank, Annual freshwater withdrawals, total (2022): data.worldbank.org
- World Bank, Agriculture value added, % of GDP (2025): data.worldbank.org
- World Bank, Arable land (2024): data.worldbank.org
- World Bank, Land under cereal production (2024): data.worldbank.org
- World Bank, Cereal production (2024): data.worldbank.org
- World Bank, Livestock production index (2024): data.worldbank.org
- World Bank, Food imports, % of merchandise imports (2025): data.worldbank.org
- FAO GIEWS Country Brief, Saudi Arabia (7 July 2026): fao.org
- FAO, Irrigation Water Management training manual, Annex I: Irrigation efficiencies: fao.org
- FAO, Irrigation methods training manual, Chapter 6: Drip irrigation: fao.org
- Saudi Ministry of Environment, Water and Agriculture, National Water Strategy: mewa.gov.sa
- National Center for Palms and Dates, sector figures (accessed November 2026): ncpd.gov.sa
- Barbosa et al., hydroponic vs conventional lettuce, Int. J. Environ. Res. Public Health (2015): europepmc.org
Discussion
Questions, corrections or field experience? Share them below. First-time comments are reviewed before they appear, and your email is never published.
No comments yet. Be the first to add a question or your experience.

 Etherspace Network
 Teledarbas
 Wild Oak Farm
 SFX
 BACF Africa
 Doodlakine
 Exurbia Geospatial
 FieldZero
 Indico Company
 Kubota
 FFBS
 Jontra
 Tucor

 Licence holder · Niger · Gold
 Licence holder · Nigeria · Gold + lithium
 Client · Tanzania · Gold
 Client · Somalia · Gold
 Client & affiliate partner · Ghana · Gold










