

Corn · Disease guide
Common Corn Diseases: Yield Losses, Symptoms and Control
Disease cut US corn yield by about 6.0% in 2024, led by tar spot, southern rust and northern corn leaf blight (Crop Protection Network). This guide ranks the main corn diseases by loss, shows how to identify them and helps you judge when a fungicide pays.
Key takeaways
- Disease reduced corn yield by an estimated 6.0% in the US and 3.7% in Ontario in 2024, about 963 million bushels in total (Crop Protection Network, 2025).
- Tar spot (about 293 million bu), southern rust (244 million bu) and northern corn leaf blight (64 million bu) caused the largest US losses in 2024.
- Losses swing with the weather: the US loss was 2.9% in 2023, when nematodes ranked first, against an average of 8.4% for 2012-2023.
- Resistant hybrids, rotation and residue management are the base of control; fungicides pay only when disease pressure, price and cost line up.
- Bacterial diseases such as Goss’s wilt and bacterial leaf streak do not respond to fungicides, so confirm the cause before spraying.
In this article
- Common corn diseases at a glance
- Which corn diseases cause the biggest yield losses
- Leaf diseases of corn: how to identify them
- Stalk rots, ear rots and root problems
- Pests that spread corn diseases
- How to manage common corn diseases
- When a fungicide on corn pays off
- Satellite and AI tools for spotting corn disease
- Weather, climate and the spread of corn diseases
- A season scouting plan for corn diseases
- FAQ
The common corn diseases that cost growers the most are leaf diseases such as tar spot, southern rust and northern corn leaf blight, followed by stalk rots, ear rots and nematodes. In 2024, disease cut corn yield by an estimated 6.0% across the United States and 3.7% in Ontario, a loss of about 963 million bushels, according to the Crop Protection Network 2024 loss estimates. Which disease matters on your farm depends on the weather, your hybrid and what was in the field last year.
This guide ranks the main corn diseases by measured yield loss, shows how to tell them apart in the field, and explains when a fungicide pays. It also includes a break-even calculator you can fill in with your own prices and costs. It is written for corn growers in the US Corn Belt, Ontario and other temperate corn regions.
Common corn diseases at a glance
The table lists major diseases from the 2024 survey, most of them among the largest causes of loss, with the signs to look for and the main control. Loss figures are for the United States only and come from university plant pathologists in 29 states.
| Disease | Type | Key sign | US loss 2024 | Main control |
|---|---|---|---|---|
| Tar spot | Fungal, leaf | Raised black dots that do not rub off | 293 million bu | Hybrid choice, timed fungicide |
| Southern rust | Fungal, leaf | Small orange pustules, mostly on the upper leaf surface | 244 million bu | Resistant hybrid, fungicide when early |
| NCLB | Fungal, leaf | Long gray-green to tan “cigar” lesions | 64 million bu | Resistant hybrid, rotation |
| Fusarium stalk rot | Fungal, stalk | Pink pith, stalks that crush when pinched | 61 million bu | Lower stress, early harvest |
| Fusarium ear rot | Fungal, ear | White to pink mold on scattered kernels | 54 million bu | Insect control, hybrid choice |
| Nematodes | Root feeders | Patchy stunting, poor roots | 47 million bu | Soil sampling, seed treatment |
| Gray leaf spot | Fungal, leaf | Narrow rectangular lesions between veins | 23 million bu | Tolerant hybrid, rotation, tillage |
Which corn diseases cause the biggest yield losses
Each year a group of plant pathologists from US states and Ontario estimates how much yield each disease took. Their methods vary by state. Some use field surveys and some use reports from Extension staff, seed companies and farmers. The numbers are best read as a guide to which diseases matter, not as exact counts.
Chart
US corn yield lost to disease, 2024
Million bushels, eight largest causes, 29 US states
In 2024, tar spot caused the largest loss at about 293 million bushels in the US. Southern rust came second at about 244 million bushels. Northern corn leaf blight was third at about 64 million bushels. Fusarium stalk rot and Fusarium ear rot came next. The survey notes that hurricanes may have carried rust spores north earlier than usual that year.
The ranking changes a lot from year to year. In 2023, a hot and dry season in much of the Corn Belt, losses were much lower. The Crop Protection Network 2023 report put the US loss at 2.9% and the total at 465 million bushels. Nematodes ranked first that year for the only time since the survey began in 2012, and tar spot losses were about 38 million bushels.
The survey also gives a longer view. The 2024 loss of 6.0% was higher than in 2022 and 2023 but below the average loss of 8.4% seen from 2012 to 2023. So a “light” year is not a reason to drop scouting. Leaf diseases can return quickly when a wet July follows a dry spring.
Chart
Losses by disease: 2023 vs 2024
US yield loss, million bushels
Leaf diseases of corn: how to identify them
Leaf diseases cause the biggest swings in loss because they depend on weather in July and August. Most need long periods of leaf wetness from dew, rain or irrigation. Look at the ear leaf and the leaves just above and below it, because these leaves feed the ear during grain fill.
Tar spot
Tar spot is caused by the fungus Phyllachora maydis. It forms small, raised, black, round spots on leaves, husks and leaf sheaths. The spots feel bumpy and do not wipe off. Some have a thin tan ring, often called a fish-eye lesion. Tar spot was first confirmed in the United States in 2015, in northwest Indiana and north-central Illinois.
The Purdue tar spot guide reports that after a 2018 epidemic, tar spot was found in 172 counties across six Midwest states. In the worst fields, growers reported losses of 20 to 60 bushels per acre. Purdue notes that, based mostly on research in Mexico and Central America, the disease favors cool (59 to 70°F), humid weather (around 85% relative humidity) with more than 7 hours of leaf wetness. Tar spot black dots can look like old rust pustules or harmless black mold on dead leaves, so send a sample to a diagnostic lab if you are not sure.
Tar spot was first found in Ontario in 2020. Since then it has caused either the largest or the second-largest yield loss in the province each year, according to the 2024 survey.
Southern rust
Southern rust is caused by Puccinia polysora. It makes small, round, light orange to cinnamon pustules, mostly on the upper leaf surface. Common rust pustules are larger, darker brown and form on both sides of the leaf.
The fungus does not overwinter in Nebraska and other northern areas. In years when it appears, spores blow in from the south, usually from early to mid-July. The Nebraska CropWatch southern rust page says hot (80 to 90°F), humid weather favors the disease. It also says resistant hybrids are the most cost-effective control in field corn, and that labeled foliar fungicides can manage it. The timing of arrival matters: rust that arrives before tasseling has more time to strip leaves than rust that arrives near dent.
Northern corn leaf blight
Northern corn leaf blight (NCLB) is caused by Setosphaeria turcica. Lesions are long (1 to 6 inches) and elliptical, gray-green at first and later tan, often described as cigar-shaped. They usually start on the lower leaves. The Crop Protection Network NCLB page says the fungus overwinters in corn residue and is favored by more than 6 hours of leaf wetness and moderate temperatures of 64 to 81°F.
Two types of resistance exist: single Ht genes and resistance from many genes. The fungus has at least four races, and some can overcome single Ht genes, so check what your seed dealer means by “resistant”. For treatment options, see our article on organic and chemical treatments for northern corn leaf blight.
Gray leaf spot
Gray leaf spot is caused by Cercospora zea-maydis. Mature lesions are narrow, rectangular and held between leaf veins. Held up to the light, most show a yellow edge. The Nebraska gray leaf spot page lists warm temperatures of 70 to 90°F, more than 12 hours of leaf wetness and humidity above 90% as the risk conditions. Fields with reduced tillage and corn after corn are at higher risk. It also states that all hybrids are susceptible, but tolerant hybrids yield well under moderate to high pressure. We compare organic and chemical options in our guide to controlling gray leaf spot in corn fields.
Goss’s wilt and bacterial leaf streak
Two bacterial diseases are easy to confuse with fungal leaf blights. Goss’s wilt causes tan lesions with wavy edges and small dark, water-soaked “freckles” near the edge. Leaves can look shiny where dried bacterial ooze sits on the surface. The bacterium, Clavibacter michiganensis subsp. nebraskensis, survives in residue and needs a wound to get in, often from hail or strong wind, according to the Nebraska Goss’s wilt page. Partly resistant hybrids are the most practical control. Bacterial diseases do not respond to fungicides, so a correct diagnosis saves money. Our page on ways to control Clavibacter michiganensis covers the related tomato pathogen and general hygiene steps.
Bacterial leaf streak makes narrow, wavy-edged streaks between the veins that glow yellow when held to the light. In 2024 it cost about 9 million bushels in the US.
Stalk rots, ear rots and root problems
Stalk and ear rots do less visible harm in July but can cost as much as a leaf disease by harvest. Stalk rot weakens the stalk so plants lodge, and ear rots lower grain quality.
Stalk rots
Fusarium stalk rot is the most common stalk rot in Nebraska. Plants turn dull green, the lower stalk yellows and the pith inside breaks down. When you split a stalk the pith is often pink. A simple test is to pinch the lower stalk between thumb and finger: if it collapses, the stalk is rotted. The Nebraska Fusarium stalk rot page lists dry early weather followed by heavy mid-season rain as a trigger, along with stresses such as high nitrogen, low potassium and heavy leaf disease.
No fungicides are labeled specifically for Fusarium stalk rot in Nebraska. Lowering stress is the main tool, and leaf disease control helps because a plant that loses leaves pulls sugar from its stalk. Check fields for stalk rot two to three weeks before harvest and harvest weak fields first. Anthracnose stalk rot and top dieback cost another 49 million bushels in 2024.
Ear rots and mycotoxins
Fusarium ear rot shows as white to pink mold on single kernels or groups of kernels. Gibberella ear rot starts at the ear tip with pink to red mold. Both can produce mycotoxins: fumonisins from Fusarium and deoxynivalenol (vomitoxin) from Gibberella. In 2024, plant pathologists estimated that only 0.08% of US harvested grain was contaminated with mycotoxins. Insect feeding on ears opens wounds for Fusarium, so insect control is part of ear rot control.
Nematodes and seedling diseases
Nematodes are tiny worms that feed on roots. Damage shows as uneven, stunted patches with poor root systems, and it is easy to blame on soil or fertility. Nematodes cost 47 million bushels in 2024 and ranked first in 2023. The only way to confirm them is a soil and root sample sent to a lab. Seedling blights and root rots were smaller losses in both years.
Pests that spread corn diseases
Insects matter for disease in two ways. First, chewing insects make wounds that fungi enter. European corn borer moves the Fusarium fungus from plant to plant as an adult and opens wounds as a larva, according to Nebraska Extension. Ear-feeding caterpillars do the same on the ear.
Second, some insects carry disease directly. Corn leafhoppers spread corn stunt, a disease caused by a bacterium-like organism called a spiroplasma. In 2024, losses from corn stunt were recorded in Missouri, Oklahoma and Texas for the first time since the survey began. Leafhoppers move north on storms, so watch for them if you farm on the southern edge of the Corn Belt. Good insect scouting cuts both direct feeding loss and disease entry.

▶ Can AI spot crop pests such as armyworms early? A plain test of four ways to look for pests. · 6:32
How to manage common corn diseases
No single tool controls every disease. Most extension programs combine the steps below, in this order.
- Choose hybrids with the right ratings. Check seed company disease scores for the diseases you have seen before. Resistance is the cheapest control for southern rust, NCLB, gray leaf spot and Goss’s wilt.
- Rotate out of corn. Leaf blights and Goss’s wilt survive on residue. One year out of corn helps in low-risk fields; Nebraska suggests at least two years where gray leaf spot pressure is high.
- Manage residue where it fits your system. Burying residue speeds its breakdown, but weigh this against the soil benefits of reduced tillage.
- Keep plants under less stress. Balanced fertility, especially potassium, and sensible plant populations reduce stalk rot.
- Scout from V10 through dent. Walk fields weekly, look at the ear leaf and record what you see and how much of the leaf it covers.
- Use fungicides only where the numbers work. See the next section and the calculator.
Always read the product label before you spray. Labels set the crop, rate, timing and pre-harvest interval, and the EPA pesticide label pages explain how the label is the law in the US. In Canada, Europe, the UK or Australia, check the product’s local registration and talk to a qualified agronomist.
When a fungicide on corn pays off
A foliar fungicide pays when the yield it saves is worth more than the product plus application. That depends on disease pressure, hybrid rating, growth stage and the grain price. The Crop Protection Network fungicide efficacy table, updated in February 2026, rates how well each product controls each major leaf disease, based on multi-year field trials. Use it to pick a product that actually controls the disease you see.
Several points from Extension work help with timing. Applications around tasseling to early silking (VT to R1) are the usual target for leaf diseases. A fungicide does not fix a bacterial disease such as Goss’s wilt or bacterial leaf streak. And spraying a resistant hybrid in a dry year rarely pays back. Under high gray leaf spot pressure, Nebraska Extension says timely fungicide use can greatly reduce yield loss, but it calls these sprays costly and practical mainly when pressure is high.
The calculator below shows the break-even point. Enter your own expected yield response, grain price and costs. The default values are examples set close to break-even, not a forecast of what a fungicide will do on your farm.
Try the numbers for your own farm below.
Calculator
Will a fungicide pass pay for itself?
Enter your own field size, expected yield response, grain price and costs.
- Value of yield saved: $25.20 per acre
- Total cost of the pass: $26.00 per acre
- Break-even yield response: 6.2 bu/acre
- Net return for the whole area: -$128 total
Example values only, set near break-even; they are not a benchmark or a forecast. Yield response depends on disease pressure, hybrid rating, timing and weather. Use your local cash bid for price and your own product and application quotes. Check the product label and local rules, and get advice from a qualified agronomist before spraying.
Satellite and AI tools for spotting corn disease
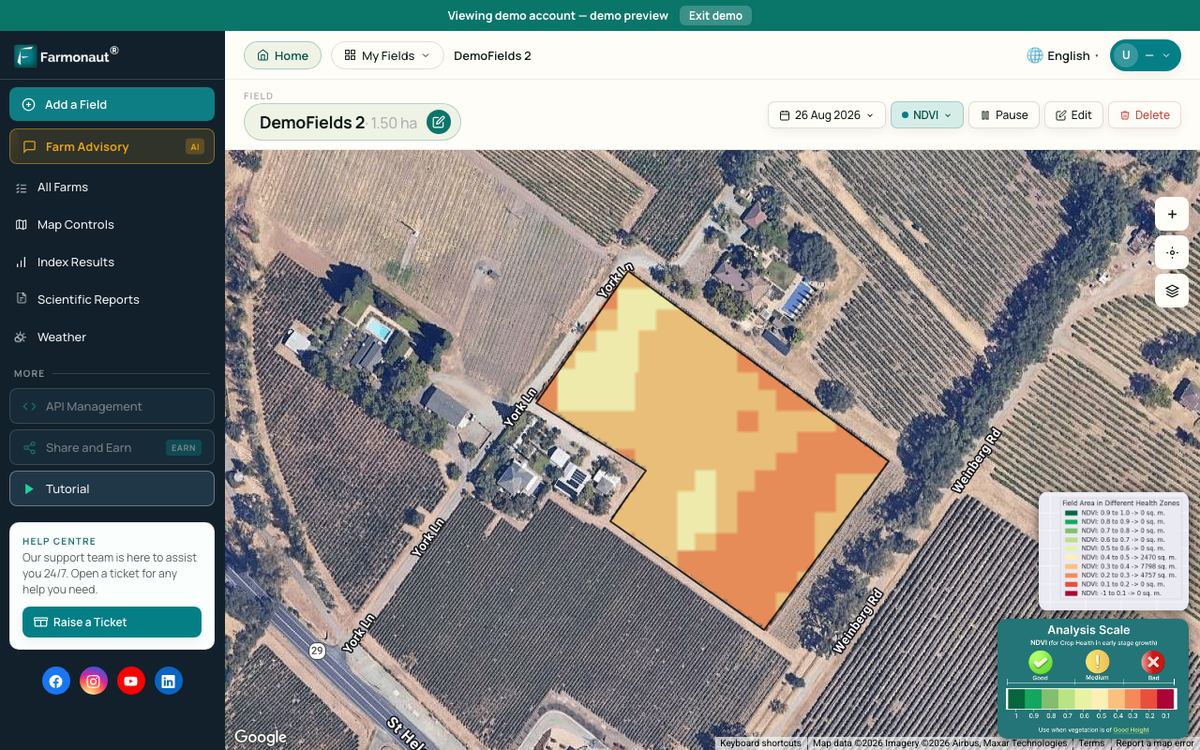
Satellite images can help you decide where to scout. Leaf diseases, stalk rot and nematode patches all lower the green leaf area of a crop, and that shows in vegetation indices such as NDVI. A satellite map cannot tell tar spot from rust, but it can flag the parts of a field that are going down faster than the rest, so you walk those first. Cloud cover and the gap between satellite passes mean you still need to check on foot.
Phone apps that name a disease from a leaf photo are improving. A Frontiers in Plant Science study trained a deep learning model on 54,306 leaf images of 14 crops and 26 diseases and reached 99.35% accuracy on held-out test images. Those photos were taken under controlled conditions, so field accuracy is lower. Treat an app result as a first guess and confirm with a lab or an agronomist before you spray.
The Farmonaut Satellite + AI Farm Monitoring System gives vegetation maps for each field you draw, on web, Android and iOS, so you can see which zones to scout first.
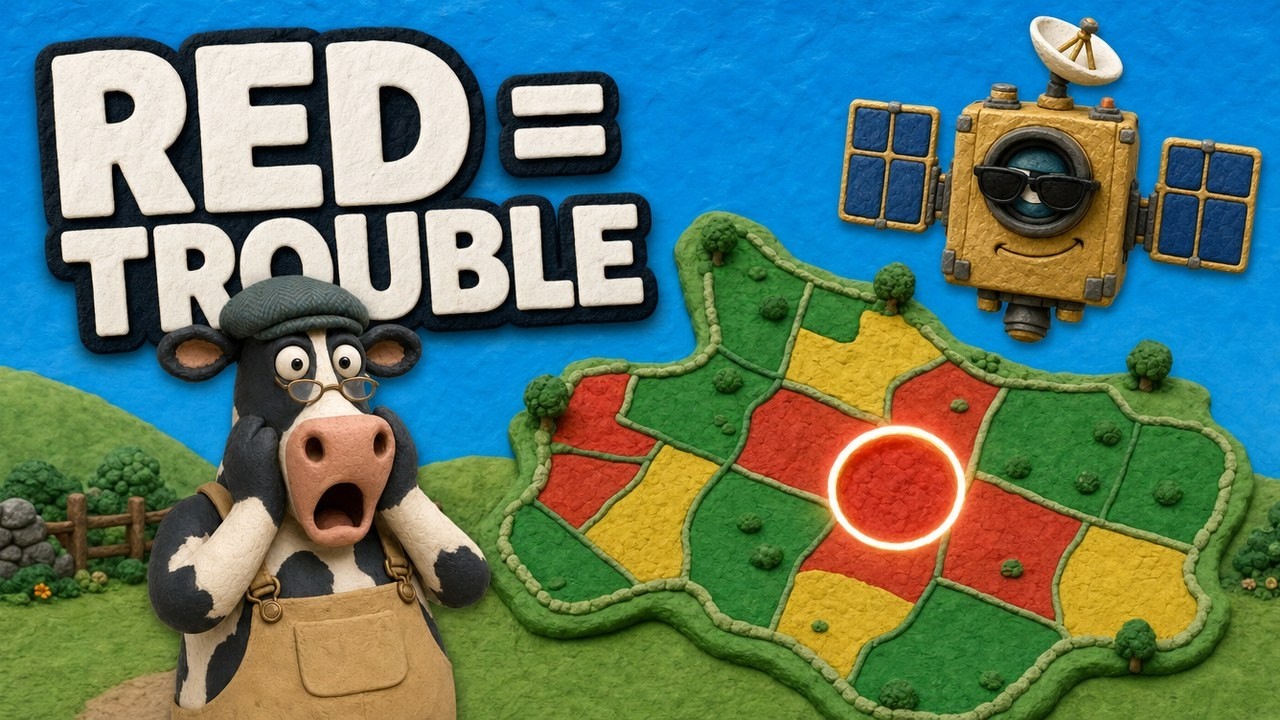
▶ How NDVI satellite maps show crop stress on a 400-acre corn farm before it is visible from the road. · 4:09
Weather, climate and the spread of corn diseases
Weather in July and August decides most leaf disease years. Long dew periods, rain and humidity drive tar spot, NCLB and gray leaf spot. Hot, dry years cut leaf disease but raise the risk of Aspergillus ear rot and aflatoxin, as the 2023 survey noted.
Chart
Share of corn yield lost to disease
Estimated percent yield loss
Some diseases are moving. The 2024 survey says tar spot kept spreading to new areas at the edge of its range, though without large losses there. Several southern states reported Curvularia leaf spot losses for the first time in 2024, and corn stunt appeared in the survey for the first time. Storms that carry spores and insects north earlier are one reason. Keep in touch with your state or provincial Extension service, which posts in-season disease alerts.
A season scouting plan for corn diseases
- Before planting: review last year’s disease notes, residue levels and hybrid ratings. Take soil samples for nematodes in problem patches.
- Emergence to V6: check stands for seedling blight and uneven, stunted areas.
- V10 to VT: scout weekly for lower-leaf lesions. Note leafhopper numbers in southern areas.
- VT to R2: main fungicide decision window. Look at the ear leaf and above. Use the calculator.
- R3 to R5: keep checking for rust and tar spot spread. Note ear-feeding insects.
- Two to three weeks before harvest: pinch-test stalks and check ears for mold. Harvest weak fields first.
Farmonaut also offers tools beyond crop scouting. Related pages on our site: agribusiness admin app, open the Farmonaut app, satellite and weather API docs, carbon footprinting, product traceability, and fleet management.
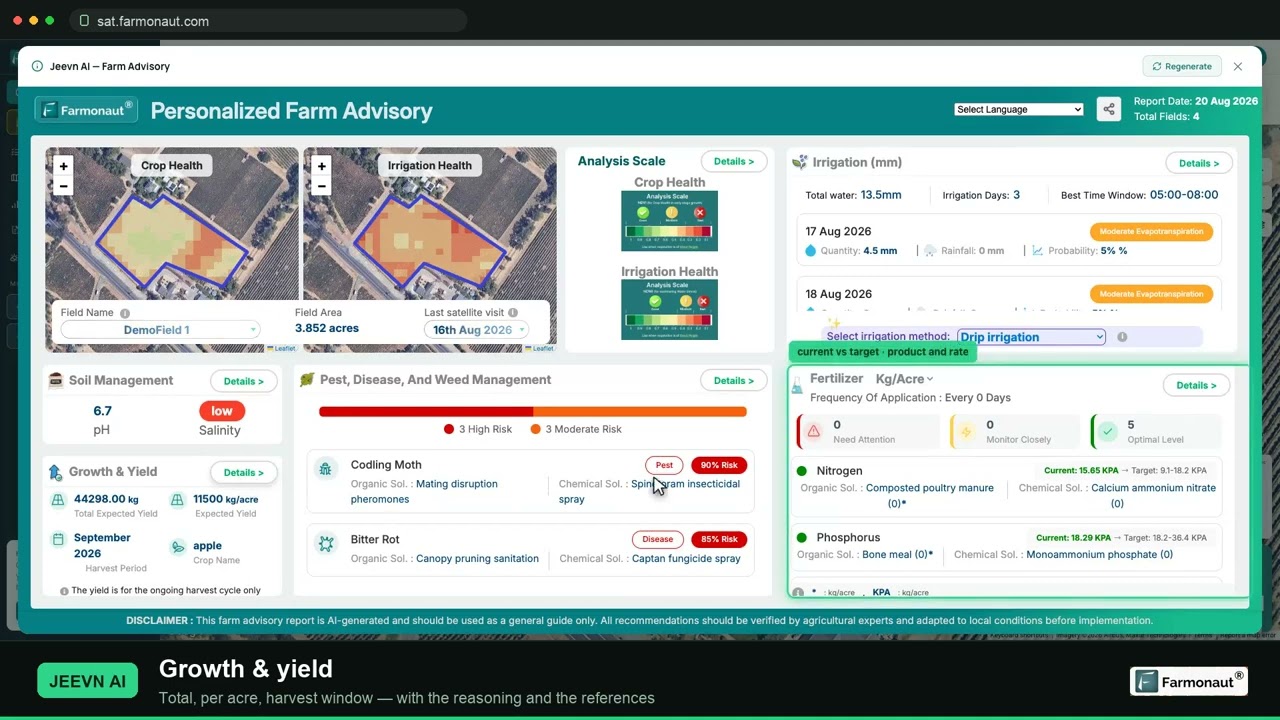
▶ A full walkthrough of satellite crop monitoring: reading NDVI and finding stressed zones to scout. · 19:36
Related reading on this site: Soybean Plant Diseases & Leaf Diseases: Timeless Solutions.
FAQ
What is the most damaging corn disease?
It changes by year. In 2024, tar spot caused the largest US loss at about 293 million bushels. In 2023, nematodes ranked first. Over many years, leaf diseases, stalk rots and ear rots take turns at the top depending on the weather.
How can I tell tar spot from rust?
Tar spot dots are black, raised and do not rub off. Rust pustules are orange to brown and leave colored spores on your finger. Old rust pustules can turn black, so a lab test is the safest check.
Do fungicides control bacterial corn diseases?
No. Goss’s wilt and bacterial leaf streak are caused by bacteria, so fungicides do not control them. Use resistant hybrids, rotation and residue management instead.
When should I spray fungicide on corn?
Most leaf disease programs target tasseling to early silking (VT to R1) when disease is present on lower leaves and the weather favors spread. Check the label and the expected return first.
Can satellites detect corn disease?
Satellites show where crop vigor drops, which helps you choose where to scout. They cannot name the disease. You still need to look at leaves or send a sample.
How much yield do corn diseases take each year?
The survey estimate was 2.9% of US corn yield in 2023 and 6.0% in 2024. The average from 2012 to 2023 was 8.4%.
Farmonaut crop monitoring
See which corn fields to scout first
Draw your fields once and Farmonaut shows satellite vegetation maps for them through the season, on web, Android or iOS.



Sources
- Crop Protection Network, Corn Disease Loss Estimates from the United States and Ontario, Canada, 2024 (CPN-2007-24, February 2025): cropprotectionnetwork.org
- Crop Protection Network, Corn Disease Loss Estimates from the United States and Ontario, Canada, 2023 (CPN-2007-23, March 2024): cropprotectionnetwork.org
- Crop Protection Network, Fungicide Efficacy for Control of Corn Foliar Diseases (CPN-2011, February 2026): cropprotectionnetwork.org
- Crop Protection Network, Northern Corn Leaf Blight of Corn (encyclopedia entry): cropprotectionnetwork.org
- Crop Protection Network, Tar Spot of Corn (encyclopedia entry): cropprotectionnetwork.org
- Telenko and Creswell, Diseases of Corn: Tar Spot, Purdue Extension BP-90-W: extension.purdue.edu
- University of Nebraska-Lincoln CropWatch, Southern Rust: cropwatch.unl.edu
- University of Nebraska-Lincoln CropWatch, Gray Leaf Spot: cropwatch.unl.edu
- University of Nebraska-Lincoln CropWatch, Goss’s Bacterial Wilt and Leaf Blight: cropwatch.unl.edu
- University of Nebraska-Lincoln CropWatch, Fusarium Stalk Rot: cropwatch.unl.edu
- US EPA, Introduction to Pesticide Labels: epa.gov
- Mohanty, Hughes and Salathé, Using Deep Learning for Image-Based Plant Disease Detection, Frontiers in Plant Science (2016): frontiersin.org
Discussion
Questions, corrections or field experience? Share them below. First-time comments are reviewed before they appear, and your email is never published.
No comments yet. Be the first to add a question or your experience.

 Hydenmet
 Dirks Bros Farms
 Red August Group
 Farm Inc
 WeMe Global
 Agrotoken
 Blue BearX
 Insignito
 Croptimum
 DnCubed
 Field Capacity
 Indosistim Teknologi
 Liquify Digital
 CU Foods
 BeyondTech Global
 Rouge VC
 AgroGreen Dynamics

 Licence holder · Niger · Gold










