

Beekeeping · Buyer guide
Hive Management App: 7 Tools and How to Choose One
A hive management app keeps inspections, mite counts, treatments and harvests in one log, and can add hive scales and sensors. Canadian beekeepers lost 34.6% of wintered colonies in 2023-2024 (CAPA), so records that catch mites early pay their way.
Key takeaways
- Canada’s winter colony loss was 34.6% in 2023-2024, against a 2007-2023 average of 27.7%, with provinces ranging from 9.8% to 61.3% (CAPA, 2024).
- The Honey Bee Health Coalition sets ‘danger’ mite levels of 2 to 5 mites per 100 adult bees, depending on the phase of the colony year.
- US beekeepers spent US$22.2 million on varroa control in 2025, up from US$16.6 million in 2024, and paid on average US$130 for a nuc (USDA NASS, March 2026).
- The seven core tools are an inspection log, mite and treatment log, hive scales, in-hive sensors, alerts, yard maps with forage data, and harvest traceability.
- Choose an app that works offline, logs mite counts with method, exports your data and fits your number of hives.
In this article
- What a hive management app does
- 7 tools in a hive management app
- Colony losses show why hive records matter
- Mite thresholds a hive app should flag
- What beekeeping costs, and where better records save money
- Is a hive management app worth it for you?
- How to choose a hive management app
- Step-by-step: set up digital hive records
- Where satellite farm data fits in hive management
- Common mistakes when going digital
- How we checked the numbers
- FAQ
A hive management app is software that keeps your inspection notes, mite counts, treatments, feeding and harvests in one place, and, if you add sensors, shows hive weight and temperature from a distance. It matters because losses are high: Canadian beekeepers lost 34.6% of wintered colonies in 2023-2024, according to the Canadian Association of Professional Apiculturists (CAPA) winter loss report. Good records help you catch mites and weak colonies before winter does.
This guide explains the seven tools you will find in a modern hive app, which ones pay back for a hobby yard and which suit a commercial outfit, and how to choose. It includes charts of winter losses, mite thresholds and US beekeeping costs, and a calculator that tests whether an app or hive scale is worth its yearly cost for your own number of hives.
What a hive management app does
At its simplest, the app replaces the notebook in your bee suit pocket. You open a hive, tap a few fields (queen seen, brood pattern, frames of bees, temper, stores, mite count) and save. The app stamps the date and the yard, so a year later you can see how each colony moved through the season.
Better apps add three more layers. The first is planning: reminders for the next inspection, the next mite test or the end of a treatment. The second is analysis: charts of colony strength, honey per hive and losses by yard. The third is sensors: a scale under the hive or a probe inside it that sends readings to your phone, so you can check a remote yard without driving to it.
Records are not just a convenience. Organic beekeeping rules reproduced in an FAO appendix on EU organic rules for bees ask beekeepers to record each veterinary treatment, its method and withdrawal period, and to enter super removals and honey extractions in the apiary register. Many provinces and states also ask beekeepers to register their colonies. A digital log makes those records quick to produce.
Who uses these apps
- Hobby beekeepers (1 to 10 hives): want a simple logbook, reminders and a mite-count history.
- Sideliners (10 to 300 hives): need yard-level views, treatment logs and harvest totals for sales.
- Commercial operators (300+ hives): need team access, pallet and yard tracking, pollination contracts and sometimes sensor data from many sites.
7 tools in a hive management app
Not every app has all seven. Use this list to see what you need now and what can wait.
1. Inspection logbook
The core of any app. Each visit becomes a dated record with fields for queen status, eggs and larvae, brood frames, bee frames, honey and pollen stores, temper and notes. Good apps let you add a photo of a frame and use voice notes, since gloves and phones do not mix well. Some let you set your own fields, which helps if you run a breeding program or track queen lines.
Best for: every beekeeper. If an app does this badly, nothing else will save it.
2. Varroa count and treatment log
Varroa mites are the most damaging honey bee pest and a major cause of colony losses worldwide, according to the Honey Bee Health Coalition. A study of 242 colonies in southwestern Quebec, published in the Canadian Journal of Veterinary Research (2024), found 26.5% winter mortality in 2017-2018, and colonies with 1 or more mites per 100 bees had higher odds of dying when deformed wing virus was also present. An app should store each mite count with the method you used (alcohol wash, sugar roll or sticky board), plot it over time and flag when it crosses your threshold. The treatment log should record product, dose, start and end dates, and the follow-up count that shows whether it worked.
Best for: everyone. This is the record that most often changes a decision.
3. Hive scales
A scale under one hive in a yard tells you a lot: nectar flow starts and stops, swarms (a sudden drop), robbing, and how fast winter stores are being used. Researchers who built a battery-powered smart beehive scale describe it in a 2021 paper in Sensors: it takes several weight readings a day at hours the beekeeper sets, sleeps between readings to save power, and sends the data to the cloud over the mobile network, which keeps batteries going in remote yards. One scale per yard is a common way to use them, since hives in the same yard tend to follow the same flow.
Best for: sideliners and commercial operators with yards far from home, and anyone selling honey who wants to time supers and harvests.
4. In-hive temperature and humidity sensors
A probe above the brood nest shows whether the colony is rearing brood (the brood area is held close to a steady warm level) and can hint at a queenless or dead colony in winter. Humidity readings help with ventilation choices. These sensors are cheaper than scales but say less about honey, so many beekeepers pair a few probes with one scale per yard.
Best for: winter checks without opening the hive, and research or breeding yards.
5. Alerts and task reminders
Alerts turn data into action: a reminder 21 days after you found a capped queen cell, a weight drop of several kilograms in a day, a mite count that needs a follow-up, or a treatment strip that must come out. For a team, assigned tasks stop two people from treating the same yard twice. Set alerts carefully; too many and people stop reading them.
Best for: teams and anyone with more than one yard.
6. Yard maps, forage and weather
Apps that map your yards help with moving pallets, pollination contracts and finding a yard again in the dark. Some add local weather, which matters for planning inspections and treatments that depend on temperature. The newer layer is satellite data on the land around the yard: crop greenness from Sentinel-2 images shows when nearby canola, clover or orchards are in leaf and flower, and when drought is drying the forage. That is where farm-monitoring services, built for growers, can also help beekeepers who place hives on or near crops.
Best for: migratory and pollination beekeepers, and anyone choosing new yard sites.
7. Harvest, sales and traceability records
The last tool links the hive to the jar. Logging supers pulled per yard, extraction dates and batch numbers lets you trace a jar back to its yards, answer buyer questions and work out honey per colony. Some apps go on to inventory, invoices and lot labels. For buyers who care where honey comes from, a clean batch history is a selling point.
Best for: anyone selling honey, wax or pollination services.

▶ How an admin app helps manage tasks and teams across large farm operations. · 7:27
Colony losses show why hive records matter
Losses differ a lot between regions and years, so your own history is the best guide to your own risk. The CAPA survey for winter 2023-2024 covered 558 beekeepers who wintered 384,104 colonies, 47% of the registered colonies in Canada. Losses ranged from 9.8% in Newfoundland and Labrador to 61.3% in Prince Edward Island, and the national figure of 34.6% was above the 2007-2023 average of 27.7%.
Chart
Winter colony loss by province, Canada
Percent of wintered colonies lost (including non-viable), winter 2023-2024
In Ontario, commercial beekeepers reported an overwinter loss of 49% for winter 2021-2022 in the province’s 2022 Provincial Apiarist report, when Ontario had 3,781 registered beekeepers and 102,562 registered colonies. Losses like these are replaced at a cost: with splits, nucs, packages and queens.
The country still grows its herd of bees. Statistics Canada reported 829,120 colonies and 15,430 beekeepers in 2024, but honey output fell 18.3% to 78.2 million pounds, with poor Prairie weather and varroa named as the main causes. More bees with less honey means each colony has to be managed better to pay.
Mite thresholds a hive app should flag
A mite count only helps if you compare it with a threshold for the time of year. The Honey Bee Health Coalition’s Tools for Varroa Management guide gives levels in mites per 100 adult bees for each phase of the colony year. Above the “danger” level, it says colony loss is likely unless the beekeeper controls mites at once.
Chart
Varroa ‘danger’ level by colony phase
Mites per 100 adult bees above which prompt control is advised
The guide also notes that older advice often waited until much higher mite levels before treating, while current advice treats at far lower levels. Mite numbers can surge after the honey harvest, when brood rearing slows, so it suggests sampling several times a year, not just in spring and fall. The Manitoba honey bee health and treatment guide adds that an alcohol wash of bees from the brood area is much more accurate than a screened bottom board.
In an app, enter each count with the date, the method and the number of bees sampled, and set your alert at the caution level for the season. Always follow the treatment product label and local rules, and ask your provincial or state apiarist if you are unsure.
What beekeeping costs, and where better records save money
Records pay back through fewer dead colonies, better-timed feeding and treatments, and less driving. The US Department of Agriculture’s NASS Honey report (March 2026) shows the cost side clearly. US operations spent US$22.2 million on varroa control and treatment in 2025, up from US$16.6 million in 2024, and US$54.9 million on feed, up from US$45.4 million.
Chart
US beekeeping spending by item
US$ million, all US operations, 2024 vs 2025
The same report gives the replacement prices that make each lost colony expensive. In 2025 beekeepers paid on average US$22 for a queen, US$110 for a package and US$130 for a nuc. The 2.41 million US colonies that produced honey averaged 48.0 pounds each, and the average price was US$3.05 per pound across all sales channels, 27% more than in 2024. Pollination income was US$225 million.
The USDA Agricultural Research Service estimates that pollination by managed honey bees adds at least US$18 billion a year to the value of US crops, and groups the threats to bee health into four areas: parasites and pests, pathogens, poor nutrition and pesticide exposure. A good log covers the first three directly.
Is a hive management app worth it for you?
The math is simple. If better records and alerts mean you lose fewer colonies, each colony kept saves its replacement cost plus the honey it would have made. Compare that with the yearly cost of the app and any sensors, spread across your hives. Use the calculator below with your own numbers. The default values are examples only, set near break-even, not a forecast.
Try the numbers for your own farm below.
Calculator
Does a hive app or scale pay for itself?
Enter your own hives, costs and the loss cut you expect.
- Colonies kept alive: 3.5 colonies
- Value of colonies kept (replacement + honey): $967
- Yearly tool cost: $1,000
- Loss cut needed to break even: 7.2 % points
Example values only, set near break-even; they are not a benchmark or a forecast. The example nuc price (US$130), honey yield (48 lb) and honey price (US$3.05/lb) are US 2025 averages from the USDA NASS Honey report (March 2026); use your own and today’s price. The loss cut is your own estimate of how many percentage points fewer colonies you would lose; no study gives one figure for this.
How to choose a hive management app
Start with how you work, not with a feature list. These questions sort out the options fast.
- Does it work offline? Many yards have no mobile signal. Records should save on the phone and sync later.
- Can you enter a hive in under a minute? Try it with gloves on. Big buttons and voice notes matter more than charts.
- Does it log mite counts with method and threshold? This is the record that saves colonies.
- Can you export your data? CSV or spreadsheet export protects years of records if you change tools.
- Does it fit your scale? Team logins, yard views and pallet tracking matter at 300 hives; at five hives they are clutter.
- What sensors does it support? Check battery life, mobile or radio coverage at your yards, and the yearly data fee per device.
- What does it cost per hive per year? Add app fees, sensor hardware spread over its life and data plans, then divide by hives.
Hive app options compared
| Tool type | What you get | Main limit | Suits |
|---|---|---|---|
| Logbook app | Inspections, mite counts, treatments, reminders | Only as good as what you enter | Every scale |
| Hive scale | Daily weight, flow and swarm signs | Hardware and data cost per device | Remote yards, honey sellers |
| In-hive probe | Brood temperature, humidity | Says little about honey or mites | Winter checks, research |
| Fleet and team app | Yards, pallets, crews, contracts | Setup time | Commercial and pollination |
| Satellite view | Forage greenness around yards | Shows land, not the hive | Yard siting, migratory |
Step-by-step: set up digital hive records
- Number every hive and yard. Paint or tag boxes so the record follows the colony, not the box, when you split or combine.
- Enter what you know today. Queen age and source, last mite count, last treatment and stores.
- Pick a short inspection template. Five to eight fields you will really fill in every visit.
- Schedule mite tests. At least spring, early summer, after harvest and before winter, with an alert at the caution level.
- Add one scale per yard if you have remote yards. Watch the daily curve during the main flow and through winter.
- Review each month. Look at colony strength by yard, losses and honey per hive, and change yards or practice where numbers lag.
Where satellite farm data fits in hive management
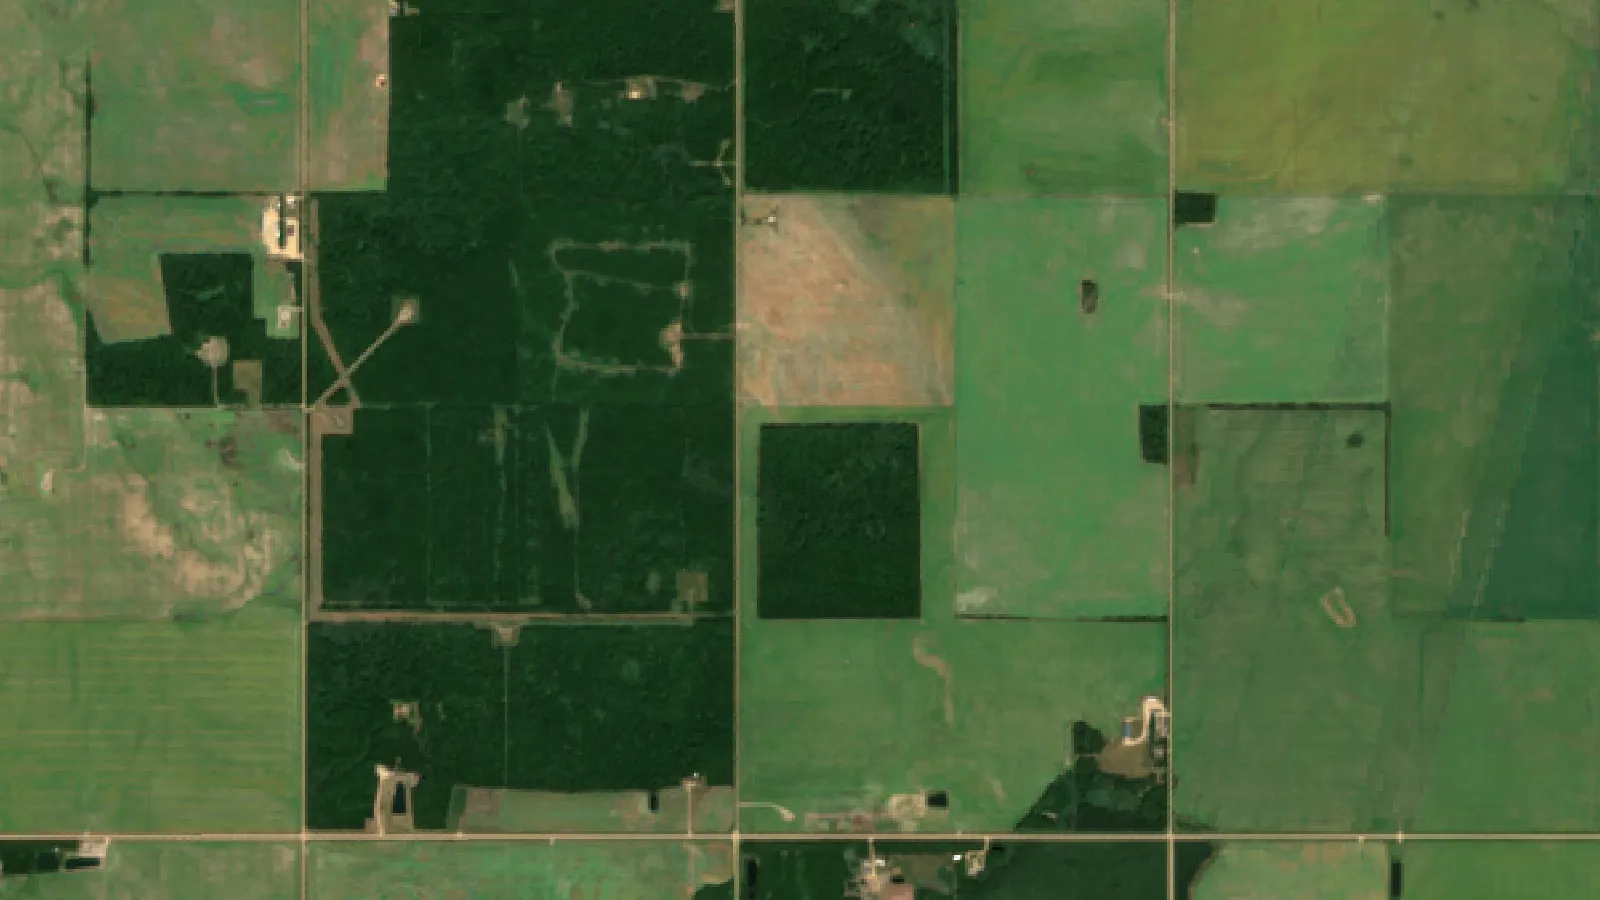
Bees forage over the land around a yard, so the state of that land matters. Satellite images show crop and pasture greenness field by field every few days in clear weather. For a beekeeper with yards on farms, that shows when canola, clover or alfalfa is in good condition, when drought has dried the forage, and how the season compares with last year. For growers who rent hives for pollination, the same field maps help plan where colonies go.
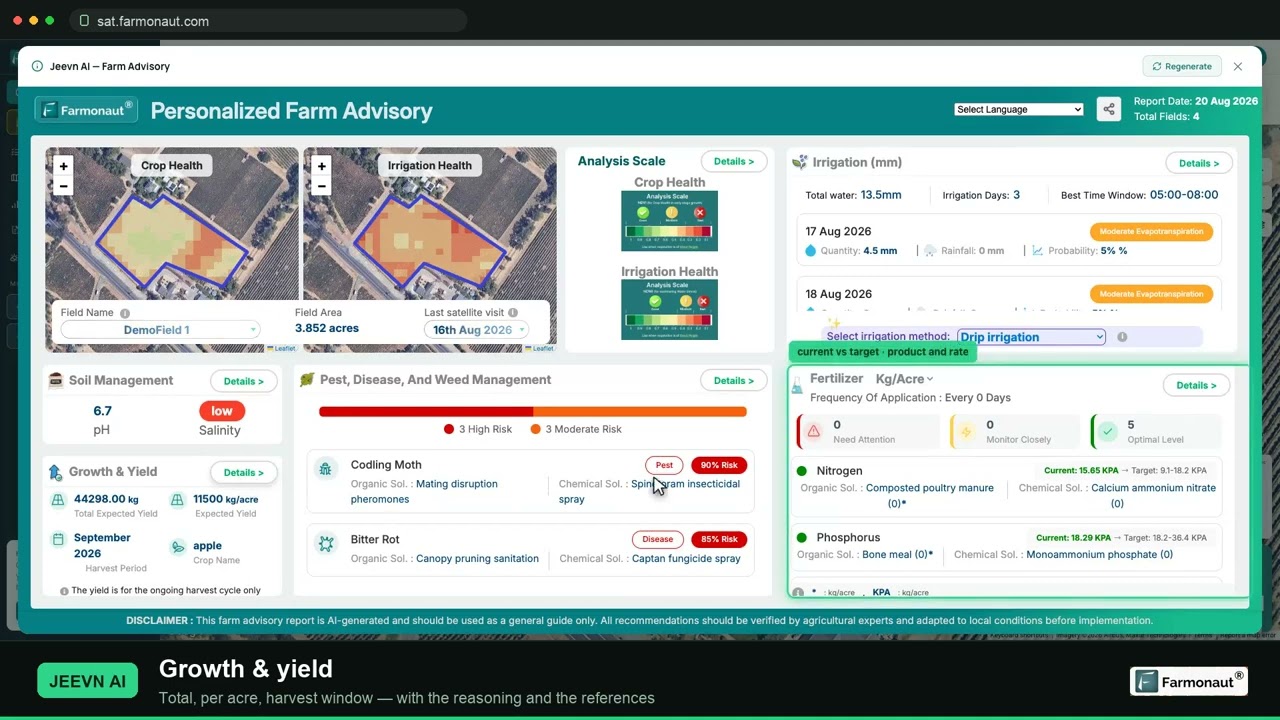
The Farmonaut Satellite + AI Farm Monitoring System gives crop greenness and soil moisture maps for fields you draw, on web, Android and iOS. It does not monitor the hive itself; pair it with your hive log and scale data.
▶ A full walkthrough of satellite crop monitoring: reading NDVI maps and spotting crop stress early. · 19:36
Common mistakes when going digital
Switching from paper to an app is easy to start and easy to abandon. These are the problems beekeepers run into most in the first season, and simple ways around them.
- Too many fields. A long form gets skipped on a hot day in a veil. Keep the template short and add fields only when you know you will use them.
- Records tied to boxes, not colonies. When you split, combine or requeen, the history should follow the queen and the colony. Give each colony an ID and move it with the bees.
- Mite counts without context. A number with no date, method or sample size cannot be compared with a threshold. Record all three each time.
- No follow-up count after treatment. A treatment only counts as done when a later test shows mites fell below the level you aimed for.
- Sensors in the wrong place. A scale on the strongest hive in the yard gives a rosy view. Put it under a typical colony, and check that the yard has mobile or radio coverage before you buy.
- Data locked in one tool. Export your records once a season, so years of history are safe if the app changes its prices or closes.
A short monthly review fixes most of these. Sit down with the app, sort colonies by strength and mite level, and decide which yards need a visit first. Over two or three seasons, those notes become the most useful record you own: they show which yards winter well, which queens are worth breeding from, and how much each yard really earns.
How we checked the numbers
Loss figures come from the CAPA 2023-2024 statement and the Ontario 2022 apiarist report, colony and honey totals from Statistics Canada (January 2025) and USDA NASS (March 2026), and mite thresholds from the Honey Bee Health Coalition guide. Costs are US national averages for 2024 and 2025 as reported by NASS, not quotes from suppliers. We did not rank named apps, since prices and features change often; use the checklist above to compare current offers.
FAQ
What is the best hive management app?
The best one is the one you will fill in at every visit. For a few hives, a simple logbook app with mite-count tracking and reminders is enough. For many yards, choose one with team access, offline use, data export and support for hive scales.
Do I need a hive scale?
Not to start. A scale is most useful for yards far from home and for timing supers and harvests. One scale per yard is a common setup, since hives in the same yard tend to gain and lose weight together.
How often should I count mites?
The Honey Bee Health Coalition guide suggests sampling several times through the year, because mite numbers can rise fast after harvest. Use an alcohol wash or sugar roll of bees from the brood area, and record the method and sample size each time.
Can an app replace hive inspections?
No. Sensors show weight and temperature, but not eggs, brood disease or the queen. They help you decide which hives to open first and when.
What records do regulators ask beekeepers to keep?
Rules differ by country, province and state. Organic programs ask for treatment and harvest records, and many places require colony registration. Check with your local apiarist or certifier.
Is a hive app worth it for a hobby beekeeper?
Often yes, if the app costs little and you use it for mite counts and reminders. Keeping just one colony alive through winter saves the cost of a nuc, which averaged US$130 in the US in 2025 (USDA NASS). Sensors are harder to justify at small scale.
Related pages on our site: large-scale farm management, vehicle and resource management, product traceability, carbon footprint tracking, satellite and weather API developer docs, satellite data API and the farm monitoring web app.
Farmonaut crop monitoring
See the fields around your yards from space
Draw the fields near your bee yards once and Farmonaut shows satellite crop greenness maps for them through the season, on web, Android or iOS.




Sources
- Canadian Association of Professional Apiculturists, Statement on Honey Bee Wintering Losses in Canada (2024): capabees.com
- Honey Bee Health Coalition, Tools for Varroa Management guide: honeybeehealthcoalition.org
- USDA NASS, Honey report (March 2026): esmis.nal.usda.gov
- Statistics Canada, More beekeepers and more bee colonies in 2024, but less honey and less money (January 2025): statcan.gc.ca
- Ontario Ministry of Agriculture, 2022 Provincial Apiarist report: ontario.ca
- Manitoba Agriculture, Honey bee health and treatment guide: gov.mb.ca
- USDA Agricultural Research Service, Honey Bee Health: ars.usda.gov
- Claing et al., Varroa destructor and deformed wing virus interaction increases incidence of winter mortality in honey bee colonies, Canadian Journal of Veterinary Research (2024): pmc.ncbi.nlm.nih.gov
- Bratek and Dziurdzia, Energy-efficient wireless weight sensor for remote beehive monitoring, Sensors (2021): pmc.ncbi.nlm.nih.gov
- FAO, Bees and their role in forest livelihoods, appendices on honey standards and organic beekeeping rules: fao.org
Discussion
Questions, corrections or field experience? Share them below. First-time comments are reviewed before they appear, and your email is never published.
No comments yet. Be the first to add a question or your experience.

 FFBS
 Jontra
 Yaduka Agrotech
 Kalustyan
 Tucor
 Geno
 Hayleys Agriculture
 Linx Agritech
 Adinet
 Save Your Soils
 Grandstream Algérie
 XOS Realty
 Geospatial Lab Africa
 Agro La Gándara
 HIPSAC
 ZOL Zimbabwe
 Juligerm

 Licence holder · Niger · Gold
 Client · Tanzania · Gold
 Client · Somalia · Gold
 Client & affiliate partner · Ghana · Gold










