

Soil carbon · Evidence guide
Soil Carbon: What It Is and How Fast You Can Build It
Soil carbon is the organic carbon held in soil. Reported gains run from about 0.03 to 0.57 t C/ha a year, depending on the practice and how it is measured, and rates are expected to slow after 5 to 10 years.
Key takeaways
- Soil organic matter is about 1.724 times soil organic carbon by the long-used van Bemmelen factor (University of Nebraska-Lincoln, 2020).
- Global trials averaged about 57 g C per square metre a year for tillage to no-till, excluding wheat-fallow; a China meta-analysis found 0.14 to 0.30 t C/ha (West and Post, 2002; Du, 2017).
- Cover crop estimates range from 0.03 t C/ha a year in a quality-screened review to 0.32 in earlier meta-analyses (Chaplot and Smith, 2023).
- Each 1% rise in organic matter held roughly 3,400 more gallons of available water per acre in the top 12 inches of a silt loam (University of Nebraska-Lincoln, 2020).
- US cover crop area reached 18.0 million acres in the 2022 Census of Agriculture, 17% above 2017 (farmdoc daily, 2024).
In this article
- What soil carbon is and how fast it can change
- How soil carbon forms
- Why soil carbon matters on the farm
- What speeds up or slows down soil carbon loss
- Seven ways to build soil carbon, with the evidence
- Soil carbon rates compared
- Calculator: how long to raise soil organic matter
- How to measure soil carbon
- A five-step plan to build soil carbon
- Soil type, climate and where gains are easiest
- Limits and trade-offs
- FAQ
- Conclusion
What soil carbon is and how fast it can change
Soil carbon is the carbon held in soil. Most of it sits in soil organic matter, the mix of dead plant and animal material, microbes and their by-products. Farmers usually mean soil organic carbon (SOC) when they say soil carbon. In a field it can be raised, but slowly: West and Post’s global review of long-term trials found that moving from tillage to no-till added about 57 g of carbon per square metre per year on average (about 0.57 t C/ha, excluding wheat-fallow systems; later studies find smaller gains), and the yearly rate was expected to peak after 5 to 10 years (Soil Science Society of America Journal, 2002). This page shows the measured rates for each practice, the doubts about them, and a calculator for your own field.
Soil organic carbon is not the same as soil organic matter. Organic matter is about 1.724 times the weight of organic carbon, a long-used rule called the van Bemmelen factor that assumes organic matter is 58% carbon (University of Nebraska-Lincoln, 2020). The true ratio differs between soils, so treat the factor as an estimate. Lab reports may list “total organic carbon”, “organic carbon” or “organic matter”; ask the lab which one you have before you compare numbers.
Soil carbon, SOC and organic matter in plain words
- Soil organic carbon (SOC): the carbon in organic compounds in the soil. It does not include carbon in lime or other carbonate minerals.
- Soil organic matter (SOM): the whole organic material, about 1.7 times the carbon weight by the usual factor.
- Carbon stock: tonnes of carbon per hectare (or acre) down to a set depth, such as 30 cm. Stock needs soil weight (bulk density) as well as percent carbon.
How soil carbon forms
Soil carbon starts as plant carbon. Leaves, stems and stubble fall or are left on the field. Roots die and release carbon underground. Manure and compost add more. Microbes eat this material, release part of it as carbon dioxide, and turn the rest into new compounds and microbial bodies. What stays is the balance between inputs and losses.
Sources of carbon input include:
- Plant residues: crop stubble, leaves and above-ground growth left on or in the soil.
- Roots: dead roots and the sugars roots release into the soil.
- Animal residues: manure and other animal material, plus compost made from them.
- Microbial biomass: bacteria and fungi that feed on residues and add their own dead cells.
Two pools: particulate and mineral-associated carbon
Researchers split soil organic matter into two main pools. Particulate organic matter (POM) is made of fragments of plants that are still easy to see. Microbes break it down fairly fast. Mineral-associated organic matter (MAOM) is smaller material stuck to clay and silt particles, where it is protected and can last much longer. Researchers now use this split widely to describe how long carbon stays in soil.
The split matters for management. A practice that adds fresh residue mainly builds the fast pool, which feeds soil life and helps soil structure but can be lost again if inputs stop. Clay-rich soils have more surface to hold MAOM, so they tend to hold carbon longer than sands.

▶ Farmonaut video on soil organic carbon and sustainable farming · 12:28
Why soil carbon matters on the farm
Soil organic matter helps form aggregates, the small crumbs that let water in and hold it. A Minnesota extension specialist summarised a compilation of studies: in medium-textured soil, plant-available water capacity rose by about 1.03 percentage points for each 1% rise in organic matter. In the top 12 inches that is roughly 3,400 gallons per acre for a silt loam (University of Nebraska-Lincoln, 2020). That is about one-eighth of an inch of rain (the source says one-ninth; 3,400 gallons over an acre is 0.125 inch), so it helps in a dry spell but does not replace irrigation.
Yield is where the picture is less clear. A global meta-analysis of maize and wheat found higher yields at higher SOC, but the gain levelled off near 2% SOC, and about two-thirds of the world’s maize and wheat land was below 2% SOC. The paper modelled possible yield gains of 10% (maize) and 23% (wheat) from raising SOC to regional targets, with wide error ranges, and said field experiments are needed to prove cause (Oldfield and others, SOIL, 2019). Treat these as model results, not a promise for your field.
There is also a climate case. FAO describes agricultural soils as one of the planet’s large carbon reservoirs and estimates that soils could take up around 20 Pg of carbon over 25 years, more than 10% of human emissions (FAO Soils Portal). Later work, covered below, suggests many field rates are lower than early estimates. For the climate side in more depth, see our page on soil carbon sequestration.
Chart
Extra plant-available water per 1% more organic matter
gallons per acre, top 12 inches, by soil texture
What speeds up or slows down soil carbon loss
SOC changes when inputs and losses change. The main drivers are:
- Soil texture: clay and silt protect carbon; sand protects little.
- Tillage: ploughing breaks aggregates and exposes organic matter to air, which speeds decay. Conservation tillage and no-till reduce that loss.
- Residues: burning or baling all residue removes the carbon input.
- Plant cover: bare fallow gives no fresh carbon; living roots in more months of the year give more.
- Land history: soils converted from grassland or forest to cropland have usually lost carbon, and slope, drainage and pH also play a part.
Soil carbon moves toward a new balance and stops. West and Post found that SOC reached a new equilibrium 15 to 20 years after a switch to no-till and 40 to 60 years after more complex rotations (Soil Science Society of America Journal, 2002). Water gains per point of organic matter differ by soil type, as chart 1 shows.

▶ Farmonaut video on why soil carbon matters for farmers · 12:15
Seven ways to build soil carbon, with the evidence
The practices below add carbon inputs or reduce losses. For each one we give the best measured numbers we found. Where studies disagree, we say so. Results depend on your soil, climate and starting level, so use these as ranges, not targets. See also our guides on sustainable soil management and sustainable soil practices.
Chart
US cover crop area, Census of Agriculture
million acres planted to cover crops; 2012 and 2017 derived from reported changes
1. Cover crops
Cover crops such as winter rye, vetch or clover keep roots in the soil between cash crops and add residue. Use is growing in the United States: the 2022 Census of Agriculture counted 18.0 million acres, 17% more than in 2017, after a 50% rise from 2012 to 2017 (farmdoc daily, University of Illinois, 2024). Texas had the most acres (1.55 million) and Iowa the next most (1.28 million). A crop-insurance premium subsidy of up to US$5 per acre ran in 2021 and 2022 and probably lifted the 2022 count, according to the same authors.
How much carbon they add is disputed. Earlier meta-analyses reported about 0.32 t C/ha/year. A 2023 review by Chaplot and Smith found that all 37 field studies sampled only to 30 cm or less, and only 6 passed their quality screen, giving a mean of about 0.03 tonnes of carbon per hectare a year (University of Aberdeen Research Portal). Cover crops still protect soil from erosion and feed soil life, so judge them on more than carbon. Our guide to cover crops for erosion control covers species choice.
2. Reduced tillage or no-till
Less soil disturbance keeps aggregates intact and slows decay. The best-known global figure is West and Post’s 57 g C per square metre per year for a switch from tillage to no-till, excluding wheat-fallow systems where gains may not occur. A meta-analysis of 95 comparisons in China shows how much the method matters: measured to a fixed 30 cm, no-till gained 0.300 t C/ha/year, but with the equivalent-soil-mass method the gain was 0.141 tonnes of carbon per hectare a year and not statistically significant. The authors advise against overstating no-till’s climate value (Du and others, 2017). For yields and costs, see no-till versus tillage.
3. Compost, manure and other organic amendments
Bringing in organic material adds carbon directly. A PNAS meta-analysis of paired organic and non-organic farming comparisons found organic soils held 3.50 t C/ha more carbon in the topsoil and gained 0.45 t C/ha/year more, but when only the best-documented studies were used, the difference in yearly gain fell to 0.07 tonnes of carbon per hectare a year and was not significant. The authors say differences in external carbon inputs and crop rotations seemed important, call the evidence “indicative at best”, and argue the higher inputs are built into organic systems rather than a biased comparison (Gattinger and others, PNAS, 2012). A global model also shows that converting all cropland to organic without cover crops and residue return would lower SOC by 9%, while a version with cover crops and residue recycling could hold it level after 20 years (Nature Climate Change). Carbon inputs appear to be the key driver. Learn more about well-rotted manure. Follow local rules on manure rates, timing and water protection.
4. Crop rotation and plant diversity
Longer, more varied rotations bring more and different residues and roots. West and Post estimated an average gain of 20 g C per square metre per year (about 0.20 t C/ha) from enhancing rotation complexity, excluding a switch from continuous corn to corn-soybean, which may not raise SOC. Equilibrium took 40 to 60 years, so this is the slowest route in their data.
5. Agroforestry
Trees on farmland store carbon in wood and roots, and leaf litter feeds the soil. A global mapping study found that farmland with at least 10% tree cover covers more than 1 billion hectares (Zomer and others, Scientific Reports, 2016). That study counts tree biomass carbon, not soil carbon, so we give no soil rate for agroforestry here. Net soil effects depend on species, spacing and the land’s previous use.
6. Residue retention
Leaving stubble and straw returns carbon and protects the surface. The effect is part of the tillage and rotation results above, and we found no separate global rate we could cite. Check that residue cover does not harm crop establishment or raise disease pressure in your rotation.
7. Better grazing management
Planned grazing with rest periods lets pasture plants regrow, which keeps more green leaf and root. Responses vary with rainfall, soil and stocking rate, and we found no single reliable global figure. FAO says rangelands hold large soil carbon sequestration potential and that restoring degraded soils offers major potential (FAO Soils Portal).
Soil carbon rates compared
The table lists the measured yearly rates we could trace to a source. Rates are in tonnes of carbon per hectare per year (1 t C per hectare is about 0.4 t per acre). Different studies sample to different depths and use different methods, so the numbers are not directly comparable across rows.
| Practice | Rate (t C/ha/yr) | Source and caveat |
|---|---|---|
| Cover crops | 0.03 to 0.32 | Low: Chaplot and Smith screened trials (2023). High: earlier meta-analyses they cite. |
| No-till | 0.14 to 0.57 | Low: China, equivalent soil mass (Du, 2017). High: global, West and Post (2002). |
| Rotation | About 0.20 | West and Post (2002), excluding corn to corn-soybean. |
| Organic systems | 0.07 to 0.45 | Extra gain versus non-organic (Gattinger, 2012). Low value not significant. |
| Agroforestry | No soil rate | Studies cited cover tree biomass. |
| Residue, grazing | No single figure | Depends on rainfall, soil and stocking. |
Chart
Reported soil carbon gain by practice
t C/ha per year; selected estimates, different depths and methods
Calculator: how long to raise soil organic matter
This calculator turns your soil test into a carbon stock and shows how many years a yearly gain would need to lift organic matter by a set amount. The default numbers are examples, not benchmarks. Use your own soil test, bulk density and a gain rate from the table above.
Try the numbers for your own farm below.
Calculator
How many years to raise soil organic matter?
Enter your soil test, bulk density and an expected yearly carbon gain.
- Carbon stock now: 67.9 t C/ha
- Carbon in the whole field: 2,746 t C
- Carbon added in 10 years: 121.4 t C
- CO2 equivalent of that gain: 445.2 t CO2
- Organic matter rise in 10 years: 0.13 % points
Example values only, not a benchmark or forecast. Carbon is organic matter divided by 1.724 (van Bemmelen factor, University of Nebraska-Lincoln, 2020); 2.471 acres per hectare and 3.667 t CO2 per t C are fixed in the formulas. Use a gain rate from the table above.
How to measure soil carbon
Measuring change is hard because yearly gains are small compared with natural variation. A 0.3 tonne gain per hectare is under 0.5% of a 68 t C/ha stock in the calculator example. Good practice includes:
- Sample the same fields at the same time of year, ideally with GPS-marked points.
- Record depth and bulk density, because percent carbon alone cannot give a stock.
- Compare equal soil mass where you can, since tillage changes bulk density and can fake a gain or loss, as the China no-till study shows.
- Use the same laboratory and method between years.
- Ask which lab method is used. Dry combustion is the analytical reference method for SOC in a 2022 Leipzig University study, which also found that portable near-infrared and mid-infrared spectrometers predicted SOC about as reproducibly as that method, with mid-infrared more strong to changes in the calibration samples (Semella and others, Sensors, 2022).
- Expect to wait several years: a change from 3.0% to 3.1% organic matter is within lab and field noise in a single sampling.
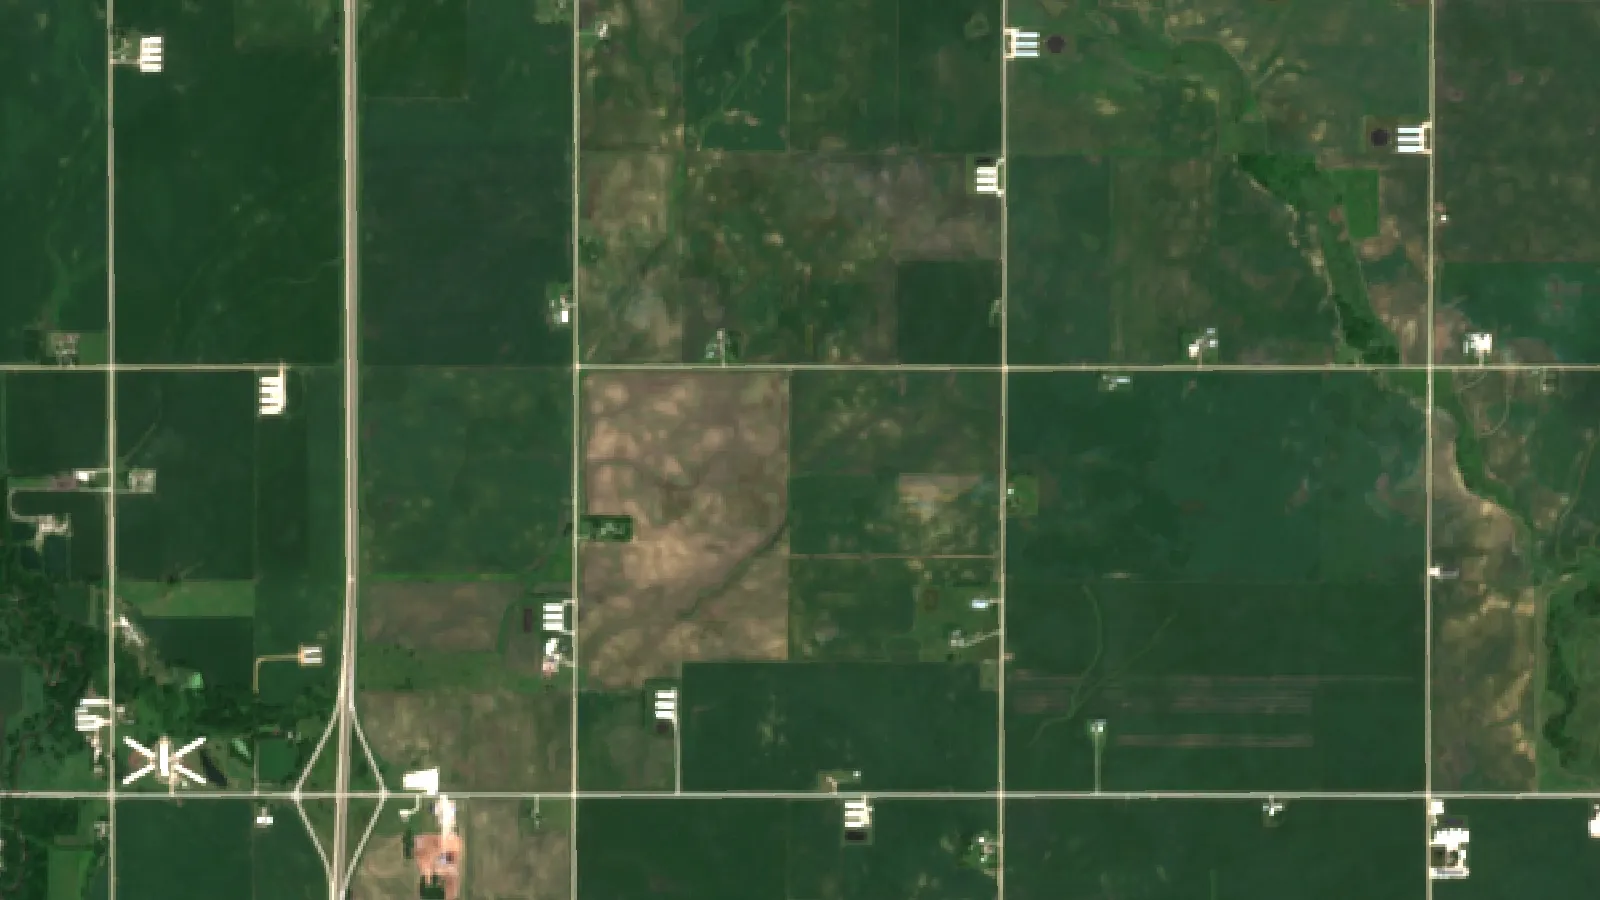
Portable spectrometers are now sold for soil testing, so ask your lab or adviser which instrument and calibration they use. Satellite images show crop vigour and bare soil, not carbon in the ground, so they cannot replace sampling. Farmonaut Satellite + AI Farm Monitoring System can show bare-soil and biomass patterns across a field. It can help you see where cover crops, residue and biomass are patchy, so you can choose sample points. You can read more about sustainable management practices on our site.
A five-step plan to build soil carbon
- Get a baseline. Take soil samples at a fixed depth, such as 0 to 30 cm, with bulk density, and record the lab method. Mark the sample points so you can return to them.
- Pick one or two changes. Changing everything at once makes the result hard to read. Start with the practice that fits your machinery and rotation, such as a winter rye cover crop after corn or soybean harvest, or compost on the lowest-carbon fields.
- Raise inputs where they are lowest. Sandy knolls and eroded slopes usually hold the least carbon, and a point of organic matter is a larger share of the water they hold (Nebraska table).
- Keep records. Note planting and termination dates for cover crops, residue left, tillage passes, compost or manure rates, and yields for each field.
- Resample on a schedule. Wait three to five years between samplings at the same points. Yearly sampling mostly measures noise.
A worked example with the calculator
Take a field with 3% organic matter, a bulk density of 1.3 g/cm3 and a 30 cm sampling depth. Organic carbon is 3 divided by 1.724, or 1.74%. Multiply by bulk density and depth and you get about 68 t C per hectare in the top 30 cm. If a new practice adds 0.3 t C/ha a year, the field gains about 3 t C/ha in 10 years. That lifts organic matter by about 0.13 percentage points, from 3.00% to about 3.13%. To raise organic matter by half a point at that constant rate takes roughly 38 years (real gain rates fall as soil nears equilibrium), longer than most farm leases and past the point where West and Post found that gains level off.
The example shows why long-term records matter and why a small number in a lab report is not a failure. A farm that adds 0.57 t C/ha a year, the top of the range, would reach the same half point in about 20 years. It also shows why reducing loss of existing carbon is worth as much as adding new carbon: the stock in the soil is large compared with a year’s gain.
Soil type, climate and where gains are easiest
Soil carbon behaves differently across the main farming regions in the United States, Canada, Europe and Australia, and the studies above are a mix of conditions. Two points hold across the evidence cited here:
- Coarse soils respond in water more. The Nebraska table shows a similar gallon gain per point of organic matter in loamy sand (3,666) and silt loam (3,383), a larger share of what a sandy soil holds, but sandy soils also hold less carbon in a protected form.
- Starting level matters. The yield study found that yield gains levelled off near 2% SOC, so fields well above that level may gain little yield from more carbon, while fields below it have more to gain.
Your local extension service, conservation district or agricultural advisory body will know the typical organic matter range and the practices that work on your soil series. Ask for local trial results before choosing a practice on the basis of a global average.
Limits and trade-offs
- Saturation: gains slow and stop as the soil nears a new balance, within roughly 15 to 60 years in the West and Post data, depending on the practice.
- Reversal: if you plough a no-till field or stop adding inputs, some carbon can return to the air.
- Depth: shallow sampling can show gains at the surface that are offset below.
- Local fit: machinery, labour and costs shape what is practical, and reduced tillage may need different equipment or weed control.
- Other gases: manure and fertiliser can also release nitrous oxide, so check the whole greenhouse-gas picture if you are chasing climate benefits.
For wider farm-level planning, see our pages on soil resilience and land stewardship. Nothing here is financial, legal or agronomic advice; check local rules and speak with a local agronomist before changing practices or entering a carbon programme.

▶ Farmonaut video on regenerative agriculture, carbon farming and soil health · 10:25
FAQ
What is soil organic carbon?
It is carbon in the organic part of soil, from decayed plants, animals and microbes. It excludes carbonate minerals. Multiply it by about 1.7 for an estimate of organic matter.
How fast can I raise soil carbon?
Measured rates in the studies above run from about 0.03 to 0.57 t C/ha per year, depending on practice and method. For a switch to no-till, West and Post found the yearly rate peaks within 5 to 10 years and then slows; rotation changes took 40 to 60 years to level off.
What is the difference between particulate and mineral-associated carbon?
Particulate carbon is made of plant fragments that decay fairly fast. Mineral-associated carbon is bound to clay and silt and lasts longer.
Does biochar add soil carbon?
Biochar is charred plant material that breaks down slowly, so it can add stable carbon. Effects differ by feedstock, burn temperature and soil, and rules for use differ by region, so check local guidance.
Are there payments for building soil carbon?
Some governments, buyers and carbon markets pay for practices that add soil carbon. Terms, measurement rules and contract length vary and change, so read the programme rules and get professional advice before you sign.
How does climate change affect soil carbon?
Changes in temperature and rainfall shift both plant growth and decay, so the effect on your soil depends on the region. Ask your local extension service for regional data.
Conclusion
Soil carbon can be built, but slowly, and the size of the gain depends on the practice, the soil and how you measure it. The most defensible steps are to raise carbon inputs, cut disturbance, and check results with careful sampling. Use the calculator to see how many years a realistic gain would take on your own fields.
Related pages on our site: carbon footprinting, farm management app, product traceability, fleet management, crop loan and insurance, satellite API, developer documentation.
Farmonaut crop monitoring
See your own fields from space
Farmonaut Satellite + AI Farm Monitoring System shows crop vigour and bare-soil patterns across a field, which can help you plan where to take soil samples.




Keep reading
Sources
- University of Nebraska-Lincoln Water, soil organic matter and soil water (2020): water.unl.edu
- West and Post, Soil Science Society of America Journal (2002): agris.fao.org
- Du and others, no-till in Chinese soils (2017): agris.fao.org
- Chaplot and Smith, cover crops and SOC stocks (2023): abdn.elsevierpure.com
- Gattinger and others, PNAS (2012): pmc.ncbi.nlm.nih.gov
- Oldfield and others, SOIL (2019): soil.copernicus.org
- FAO Soils Portal, soil carbon sequestration: fao.org
- farmdoc daily, University of Illinois (2024): farmdocdaily.illinois.edu
- Nature Climate Change, organic farming expansion and SOC: nature.com
- Zomer and others, Scientific Reports (2016): pmc.ncbi.nlm.nih.gov
- Semella and others, Sensors (2022): ncbi.nlm.nih.gov
Discussion
Questions, corrections or field experience? Share them below. First-time comments are reviewed before they appear, and your email is never published.
No comments yet. Be the first to add a question or your experience.

 Chimera Innovation
 Hiteshi Infotech
 Clubhouse OS
 Progenseed
 SkyHarvest
 Polaris Digitech
 Teledarbas
 Wild Oak Farm
 SFX
 BACF Africa
 Doodlakine
 Exurbia Geospatial
 FieldZero
 Indico Company

 Licence holder · Niger · Gold










