

Sustainable Agriculture Case Study: AI & IoT Results
Reviewed September 2026 against USDA Economic Research Service, USDA Agricultural Research Service, and Nebraska Extension/AEM data.
Try it: Estimated seasonal water savings range: — →
The short answer: US sustainable agriculture case study evidence now has real numbers behind it, not just pilot-project anecdotes. USDA’s Economic Research Service puts precision agriculture adoption on US farms at 27% as of 2023, autosteering guidance systems are on 52% of midsize crop farms and 70% of large-scale operations, and the US IoT-in-precision-agriculture market was sized at $2.36 billion in 2024, growing at a projected 17.8% CAGR through 2032. Variable rate irrigation (VRI) fields in California’s Central Valley have documented 12–18% yield gains and 25–35% water savings, while Nebraska growers using smart irrigation scheduling cut water use 29–43% in corn and 10–37% in soybeans, netting $400–$1,700 per acre after sensor costs.
This case study is built for readers comparing AI and IoT agriculture examples against their own operation — what the technology actually returns, where the peer-reviewed and government data stops, and how to pull a fresher number when these figures age out. It answers the digital agriculture case study question, the IoT case study examples question, and the “what does an AI-in-agriculture use case actually look like” question in one place, with sourcing you can check yourself.
The Numbers: US Precision Agriculture Adoption
Start with scale, because that’s what most digital agriculture case study searches are actually trying to establish: how many US farms are doing this, and is it worth adopting. USDA’s Economic Research Service reports 27% of US farms used precision agriculture technologies to manage crops or livestock as of 2023 — the most recent figure published in their charts-of-note series. That’s not a niche practice anymore; it’s roughly one in four operations nationwide, and adoption is concentrated in the technologies with the clearest payback: guidance autosteering, variable rate application, and soil/yield mapping.
Guidance autosteering — GPS-driven systems that keep planting and spraying passes within an inch or two of target — is the most mature IoT-adjacent technology in US row-crop agriculture. USDA ERS found 52% adoption on midsize crop farms and 70% on large-scale crop farms in 2023. The gap between farm sizes is the story here: autosteer hardware has largely fixed upfront costs, so the per-acre payback arrives faster on more acres, which is exactly what you’d expect from a capital-intensive IoT case study example.
On market size, Market.us sized the US IoT-in-precision-agriculture market at $2.36 billion in 2024, with a projected compound annual growth rate of 17.8% from 2024 through 2032. That growth rate is a market-research projection for that specific window — treat it as guidance from Market.us’s own forecasting model, not a guaranteed trajectory, and check Market.us’s IoT in precision agriculture report directly if you need the current-year estimate, since market-sizing reports are typically reissued on a rolling basis.
IoT Agriculture Case Study: Water and Yield Data
The clearest IoT in agriculture case study evidence in the US comes from irrigation. Two separate research programs — USDA’s Agricultural Research Service in California’s Central Valley, and Nebraska Extension’s on-farm irrigation trials — measured outcomes on fields actually running variable rate and sensor-scheduled systems, not simulations.
USDA ARS’s Central Valley work on variable rate irrigation (VRI) documented 12–18% yield improvement and 25–35% water savings on VRI-equipped fields, as reported in their FY2020 Science Accomplishments summary. VRI works by matching water application to zone-level soil and crop variation within a single field, instead of applying a uniform rate across the whole pivot — the IoT layer (soil moisture sensors, zone controllers) is what makes the variable rates possible in real time.
Nebraska Extension’s irrigation scheduling research, summarized by the Association of Equipment Manufacturers, found smart irrigation scheduling cut water use 29–43% in corn and 10–37% in soybeans compared with grower’s typical practice. The net financial return after accounting for sensor and equipment costs was $400 to $1,700 per acre annually. That’s a wide range because it spans different crop mixes, water costs, and baseline irrigation practices across trial sites — but every site in the range showed positive net savings, which is the more decision-relevant fact than the midpoint.
Read the primary sources directly: USDA ARS’s FY2020 water use and management report and AEM’s summary of Nebraska smart irrigation research. Both are the kind of on-farm, multi-season data an AI Overview summary won’t hand you in full — the ranges, the crop-by-crop split, and the net cost accounting are only in the source reports.
For satellite-based soil moisture and irrigation guidance that complements ground sensors described in this research, Farmonaut’s approach is covered in the IoT farming technology breakthroughs overview, which walks through how remote sensing layers stack with on-field IoT hardware.
John Deere IoT Case Study Context: Autosteer & Guidance Adoption
Readers searching for a John Deere IoT case study are usually trying to understand adoption and payback for guidance and autosteer systems in general — Deere is the largest single vendor in that category, and its equipment is the platform underneath a large share of the USDA ERS adoption figures above, but ERS reports adoption at the farm level across all guidance system vendors, not brand by brand.
What ERS’s data does show clearly: the 52%-to-70% adoption jump between midsize and large-scale crop farms tracks directly with acreage-driven payback on guidance hardware. A GPS guidance and autosteer system has a largely fixed cost per unit regardless of farm size, so operations running more acres per season recover that cost faster per acre. If you’re evaluating a specific vendor’s guidance system, USDA ERS’s farm-size adoption breakdown at their chart of note on guidance system adoption is the most current government benchmark to compare against, and it’s revised as new Agricultural Resource Management Survey data comes in — so check that page directly for the update beyond the 2023 figures cited here.
AI in Agriculture Case Study and Use Cases
What AI Actually Does On Top of IoT Sensor Data
IoT sensors collect the data — soil moisture, canopy temperature, weather, satellite imagery. AI is the layer that turns that stream into a decision: when to irrigate, where to spray, which zone needs a different fertilizer rate. A peer-reviewed case study combining IoT sensor networks with AI-based resource allocation, published via SpringerLink, reported a 32% reduction in fertilizer consumption and a 28% reduction in water usage compared with traditional methods, with the machine learning models achieving 91% precision in their resource allocation recommendations.
That 91% precision figure matters for anyone evaluating ai in agriculture use cases skeptically: it’s a measured model-accuracy result from a specific published study, not a marketing claim, and the source is available at the SpringerLink case study on IoT-AI integration in agriculture if you want the methodology behind the percentage.
Common ai in agriculture examples case studies fall into four categories, each with a distinct data source and a distinct AI task:
- Predictive irrigation — soil moisture sensor networks plus weather forecasts feed a scheduling model; this is the category behind the Nebraska and Central Valley figures above.
- Variable rate input application — satellite or drone imagery plus yield maps train models that set fertilizer or seeding rates by zone within a field.
- Pest and disease detection — image classification models trained on crop photos flag anomalies before visible spread, cutting scouting time.
- Guidance and autosteer — GPS plus onboard sensors automate steering precision; this is the 52–70% adoption category from USDA ERS above.
None of these four categories require replacing an entire operation’s equipment at once — the USDA ERS adoption data shows farms layering in one technology (most often guidance) well before adopting others, which is a more realistic rollout path than a full-stack pilot.
Case Study on Smart Agriculture in IoT: Comparison Table
This is the table an AI Overview can’t hand you in one glance: side-by-side outcomes across the four documented US and peer-reviewed cases above, with the technology, the measured result, and the exact source to verify it.
| Case | Technology | Measured Outcome | Source & Year |
|---|---|---|---|
| Central Valley, California — row crops | Variable Rate Irrigation (VRI) | 12–18% yield gain, 25–35% water savings | USDA ARS, FY2020 |
| Nebraska — corn | Smart irrigation scheduling (sensor + weather model) | 29–43% water use reduction | Nebraska Extension via AEM |
| Nebraska — soybeans | Smart irrigation scheduling | 10–37% water use reduction; $400–$1,700/acre net savings | Nebraska Extension via AEM |
| US row-crop farms, midsize vs. large-scale | GPS guidance / autosteer | 52% adoption (midsize), 70% adoption (large-scale) | USDA ERS, 2023 |
| Peer-reviewed IoT-AI integration study | Combined sensor network + ML resource allocation | 32% fertilizer reduction, 28% water reduction, 91% model precision | SpringerLink, 2025 |
Every row above traces to a named source you can re-check. That’s the standard to hold any agriculture case study examples table to — if a figure can’t be traced to a named report and year, it’s not evidence, it’s an estimate dressed up as one.
Calculator: What VRI or Smart Irrigation Could Save You
Use the documented water-savings ranges from the Central Valley and Nebraska research above against your own acreage and water cost to estimate a range, not a single number — the tool below runs the low and high end of the applicable range against your inputs.
Estimated seasonal water savings range: —
Assumptions: applies the published percentage range directly to your current per-acre water use and cost; excludes sensor/equipment purchase cost, installation, and the Nebraska-documented net savings figure of $400–$1,700/acre (which already nets out equipment cost) — use that figure separately if you want a cost-inclusive estimate. Does not account for soil type, crop stage, or regional water pricing differences.

Other Agriculture Case Study Examples: Forestry and Traceability
Two adjacent use cases come up often enough in agriculture case study examples searches to cover briefly here, without pulling the article away from the irrigation and adoption data above, which is the strongest evidence this page has.
Forest health monitoring with IoT sensors and drones — tracking growth rates, pest infestations, and fire risk in near-real time — is an active research area but the research brief for this article does not contain a verified, sourced figure for monitoring efficiency gains in forestry specifically, so no percentage is cited here. If you need that figure, USDA Forest Service research publications and state forestry agency reports are the primary sources to check directly.
Supply chain traceability is a separate but related IoT application: sensor and blockchain-based tracking of a crop from field to buyer, which supports food safety verification and premium-market access. Farmonaut’s product traceability tool covers this in more depth, and it pairs with fleet management and carbon footprinting tools for operations tracking emissions alongside logistics.

What the Data Does Not Yet Cover
Being direct about gaps is part of making this page useful rather than another AI-summary rehash. As of this review, the following are not published with the precision this article otherwise holds to:
- Commodity-specific adoption rates — USDA ERS’s 27% and 52–70% figures are farm-size breakdowns, not corn-vs-soybean-vs-wheat breakdowns. The next USDA NASS Census of Agriculture data release (expected in 2025 per the census cycle, check USDA NASS directly for the current release status) is the likely source for that level of detail.
- Hardware and software costs for a typical VRI or sensor-network installation — not in the sources used here. Equipment dealers and university extension cost-of-production guides are the right place to get a current quote for your region and acreage.
- Typical payback period in months or seasons — the Nebraska $400–$1,700/acre net savings figure implies a payback, but no source here states it directly as a time-to-ROI number.
- Quantified carbon or greenhouse gas reductions from precision agriculture adoption specifically — not published in the sources reviewed for this article.
- Large-operator case studies above 5,000 acres — the USDA ERS large-scale category is broad; a case study at that specific scale was not available in this review.
If your work depends on any of these, treat the gap as the next research step rather than filling it with an estimate — that’s the same standard this article holds its own figures to.
Farmonaut: Tools Behind These Use Cases
Farmonaut builds the satellite and AI layer that sits alongside the ground-based IoT hardware described in the USDA and Nebraska research above — multispectral satellite monitoring for NDVI and soil moisture, an AI advisory system, and the traceability, fleet, and carbon tools referenced earlier in this article.
Technology Stack & Solutions
- Satellite-Based Crop Health Monitoring: Multispectral satellite data on NDVI, soil moisture, and crop growth, supporting the same irrigation and input-timing decisions documented in the Nebraska and Central Valley research above.
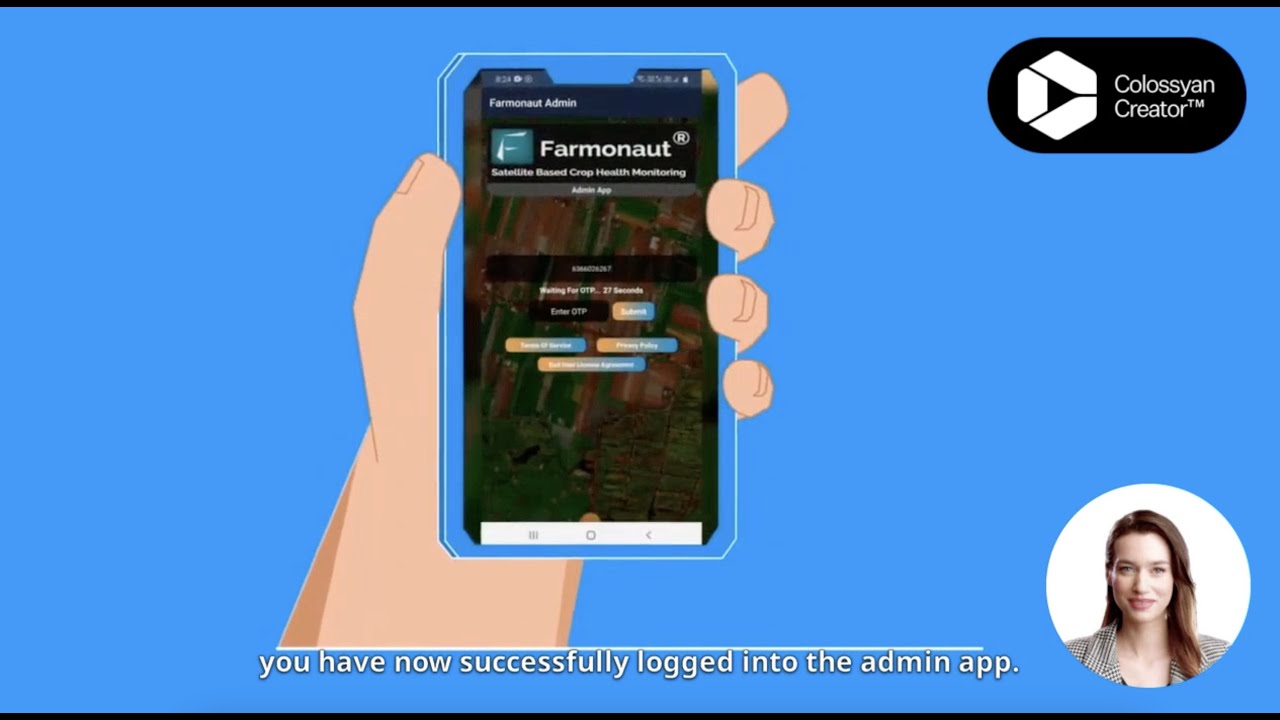
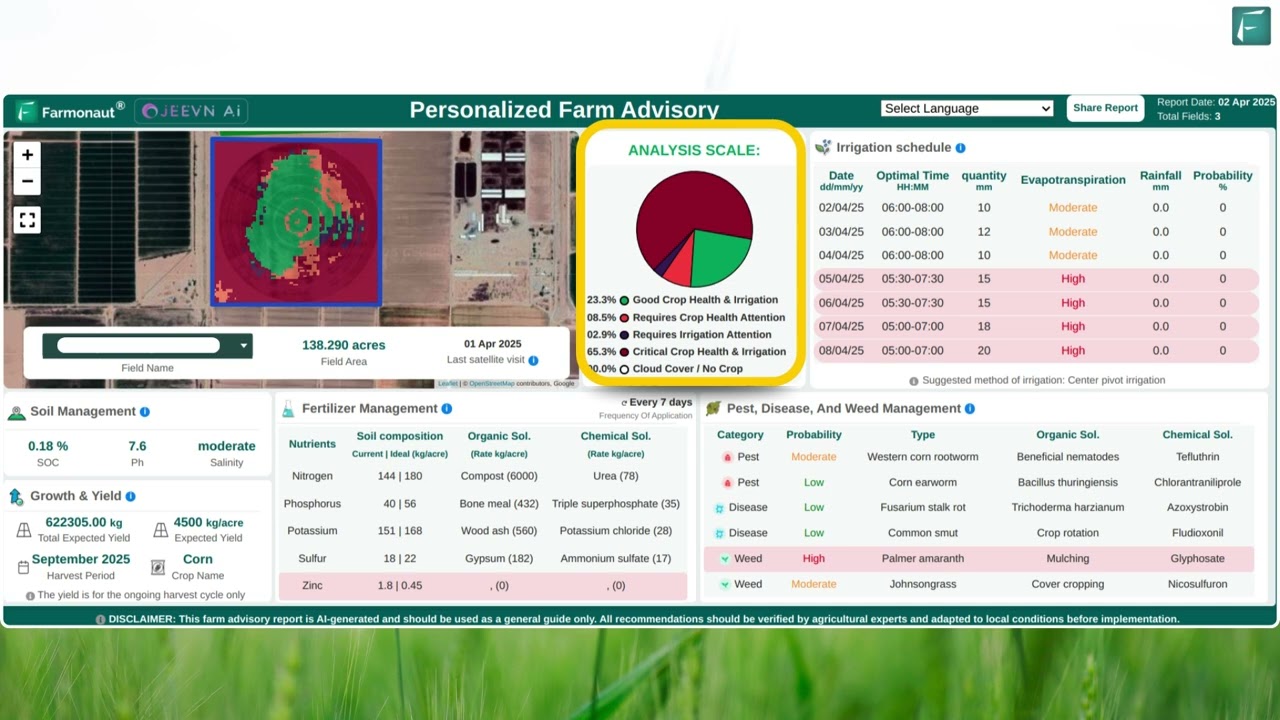
- Jeevn AI Advisory System: Analyzes satellite and environmental data to generate irrigation, fertilizer, and weather-driven recommendations — an applied version of the predictive-irrigation use case described earlier.
- Blockchain-Based Traceability: The traceability solution records a farm product’s journey for supply chain transparency.
- Fleet & Resource Management: Fleet management tools for reducing machinery operating costs.
- Carbon Footprinting: The carbon tracking module reports emission data for operations monitoring environmental impact.
- API Access: Developers can integrate satellite and AI data via the API, documented at the developer docs.
- Large-Scale Management: The large-scale farm management dashboard for plantations and agribusinesses.
- Crop Loans & Insurance: Satellite-based verification for faster credit and insurance access.

Access Farmonaut on All Your Devices






Subscriptions
Farmonaut offers scalable subscription tiers for individual growers, agribusinesses, and government departments:
FAQ
Q1: What percentage of US farms use precision agriculture?
27% of US farms used precision agriculture technologies to manage crops or livestock as of 2023, per USDA’s Economic Research Service. That figure is updated as new Agricultural Resource Management Survey data is released — check the ERS chart-of-note page directly for the current number.
Q2: What water savings does IoT irrigation actually deliver?
Documented ranges: 25–35% on VRI-equipped fields in California’s Central Valley (USDA ARS), 29–43% in Nebraska corn, and 10–37% in Nebraska soybeans with smart scheduling (Nebraska Extension via AEM). Net financial return after sensor costs ranged $400–$1,700 per acre in the Nebraska research.
Q3: How does a John Deere IoT case study compare to industry-wide adoption?
USDA ERS doesn’t break adoption down by equipment brand, but its farm-size data shows guidance/autosteer adoption at 52% on midsize crop farms and 70% on large-scale farms in 2023 — the category that includes Deere’s guidance systems along with other vendors’.
Q4: What is the size of the IoT agriculture market in the US?
Market.us sized the US IoT-in-precision-agriculture market at $2.36 billion in 2024, projecting 17.8% CAGR from 2024 to 2032. Check Market.us directly for updated figures, as market-sizing reports are reissued periodically.
Q5: What does AI add on top of IoT sensor data?
AI models process the sensor, satellite, and weather data IoT hardware collects to generate a specific recommendation — irrigation timing, fertilizer rate, pest risk. One peer-reviewed case study measured 91% precision in an AI resource-allocation model, alongside 32% fertilizer and 28% water reductions versus traditional methods.
Q6: Are there commodity-specific (corn vs. soybean vs. wheat) adoption figures?
Not at the precision this article requires from the sources reviewed. USDA NASS’s Census of Agriculture is the most likely source for that breakdown going forward — check nass.usda.gov for the current release.






Conclusion: How to Verify These Numbers Yourself
Every figure in this case study traces to a named source and year: USDA ERS (2023) for adoption rates, USDA ARS (FY2020) for Central Valley VRI results, Nebraska Extension via AEM for irrigation scheduling savings, Market.us (2024) for market sizing, and a peer-reviewed SpringerLink case study for AI-IoT integration outcomes. None of these are static — ERS revises its charts of note as new survey data lands, Nebraska Extension updates seasonally at extension.unl.edu, and Market.us reissues its market report on a rolling basis.
The durable method, not just the numbers: when evaluating any AI or IoT agriculture claim, ask three questions — is this a farm-size-specific or commodity-specific figure, is it a measured outcome or a market forecast, and does the source name a year you can check against the current release. Applied consistently, that method outlasts every percentage in this article.

 Concept Global
 Kubota
 FFBS
FFBS Jontra
 Kalustyan
 Tucor
Tucor Geno
Geno Hayleys Agriculture
 Linx Agritech
 Adinet
 Save Your Soils
 Grandstream Algérie
 XOS Realty
 Geospatial Lab Africa
 Agro La Gándara
 HIPSAC
 ZOL Zimbabwe
