

Field Mapping, CPQ & Accounting Software for Agriculture
Reviewed August 2026 against USDA Economic Research Service, USDA NASS, and IMARC Group.
Try it: Run your own numbers →
Field mapping software turns satellite and GPS data into per-acre maps that drive seeding, spraying, and irrigation decisions; CPQ (Configure-Price-Quote) software builds accurate quotes for seed, fertilizer blends, and equipment; and farm accounting software tracks cost centers by crop and field instead of by generic ledger line. If you run a crop farm, ranch, vineyard, or ag equipment dealership in the United States, the right stack depends on farm size, whether you need livestock tracking, and how tightly you need mapping tied to your books. Below is a side-by-side comparison, real US adoption and market-size figures, and a calculator to estimate what field mapping is actually worth on your acreage.
27% of US farms and ranches used precision agriculture practices to manage crops or livestock as of 2023, and 40% of US farm and ranch acreage used GPS systems for on-farm production as of 2019, according to USDA’s Economic Research Service (USDA ERS, chart 110550). Field mapping is now mainstream on large operations specifically — adoption on small farms is lower and depends heavily on crop type.
Why Farms Are Buying This Software Now
Three separate pressures are pushing US farms, ranches, and ag dealerships toward specialized software instead of spreadsheets: input costs that reward precise field-level tracking, a federal traceability deadline with a hard date, and equipment/input sales processes too complex for a generic quote template. Each of these maps to a different category — field mapping, farm accounting, or CPQ — and buyers often need more than one at once.
On the mapping side, USDA’s Economic Research Service found that 70% of large-scale US crop farms used guidance autosteer systems and 68% used yield monitors, yield maps, and soil maps in 2023, compared with 52% of midsize farms using autosteer (USDA ERS). Separately, USDA NASS reported that 60% of US corn and soybean producers were using yield monitoring systems by the end of 2023 (USDA NASS, via DTN/Progressive Farmer). The Association of Equipment Manufacturers estimates precision agriculture practices lift yearly crop yield by roughly 5% (same DTN/Progressive Farmer report, August 2025 reference), which is the return that most mapping-software business cases are built around.
On the market-size side, IMARC Group puts the US precision farming software market at $470.31 million in 2025, and the broader US farm management software market at $691 million in 2024, projected to reach $1,751 million by 2033 (IMARC Group, precision farming software; IMARC Group, farm management software). That gap between the narrower “precision farming software” figure and the broader “farm management software” figure roughly tracks the difference between pure field-mapping tools and full suites that also handle accounting, labor, and CPQ.
If you’re comparing quotes, ask each vendor for their per-acre or per-seat price at your actual farm size — list prices below are ranges, and most vendors negotiate on multi-year contracts.
Field Mapping, CPQ & Accounting Software: Detailed Comparison Table
| Software | Core Category | Est. User Rating (out of 5) |
Key Features | Est. Price Range (per month, USD) |
Deployment | Best Fit |
|---|---|---|---|---|---|---|
| Farmonaut | Field Mapping, Traceability, Fleet | 4.8 |
|
$15 – $75 | Cloud, Web, Mobile, API | Row crop, plantation, ranch, and vineyard operations of any size wanting satellite mapping without hardware installs |
| AgriWebb | Ranch/Livestock Mapping, Management | 4.6 |
|
$25 – $120 | Cloud, Mobile | Ranch mapping and mixed livestock-crop operations |
| Granular | Accounting, Field Mapping, Payroll | 4.3 |
|
$33 – $160 | Cloud, Web, Mobile | Medium to large row-crop farms needing accounting tied to field data |
| Trimble Ag Software | Field Mapping, Equipment Telematics | 4.1 |
|
$60 – $200 | Cloud, Local, Mobile | Diversified operations already running Trimble hardware |
| Agris CPQ | Agricultural CPQ, Pricing, Orders | 4.0 |
|
$90 – $250 | Cloud | Ag equipment dealers and input suppliers running complex quote configurations |
* Ratings are estimated composites based on public reviews and publicly listed feature sets; verify current pricing directly with each vendor, as ag software pricing is typically revised annually.
Field Mapping Software for Agriculture, Ranches & Vineyards
“Field mapping software” and “field mapping app” cover the same core job — turning satellite, GPS, or drone imagery into field boundaries, health zones, and input-planning layers — but what you need differs by operation type. Row-crop farms want yield history and variable-rate prescription layers. Ranch mapping software needs paddock boundaries, grazing rotation records, and water-point tracking layered on livestock counts, which is why livestock-specific tools like AgriWebb exist alongside general mapping platforms. Vineyard mapping software needs finer-grained zonal maps — vine rows, block-level canopy vigor, and irrigation blocks — because a 40-acre vineyard can carry more management zones than a 400-acre corn field.
- ✔ Satellite and UAV imagery for field-level and crop health assessment
- ✔ Soil mapping and weather data overlays for input planning
- ✔ Variable-rate application maps to optimize seed, fertilizer, and irrigation by zone
- ✔ Grazing and paddock mapping for ranch operations tracking rotational grazing
- ✔ Regulatory compliance and certification reporting
- ✔ Integration with ERP and financial tools so mapped field activity flows into accounting
The adoption numbers back up why this category has grown past row crops: USDA ERS found 40% of US farm and ranch acreage used GPS systems for on-farm production in 2019, the most recent year that figure was broken out (USDA ERS). The next USDA Census of Agriculture, conducted every five years, will refresh national adoption figures across farm types including livestock operations — the 2022 Census is the most recent, so check USDA’s Census of Agriculture page directly for the next release before citing an adoption rate as current.
On the specialty-crop side — vineyards specifically — no separate US adoption percentage for vineyard mapping software is published in the sources reviewed for this article. If you run a vineyard, the way to get a number that applies to you is to request a pilot from a vendor on one block and measure the yield or input-cost delta against an unmapped block for one growing season, rather than relying on an industry-wide average that doesn’t isolate viticulture.
Farmonaut: Satellite-Driven Field Mapping
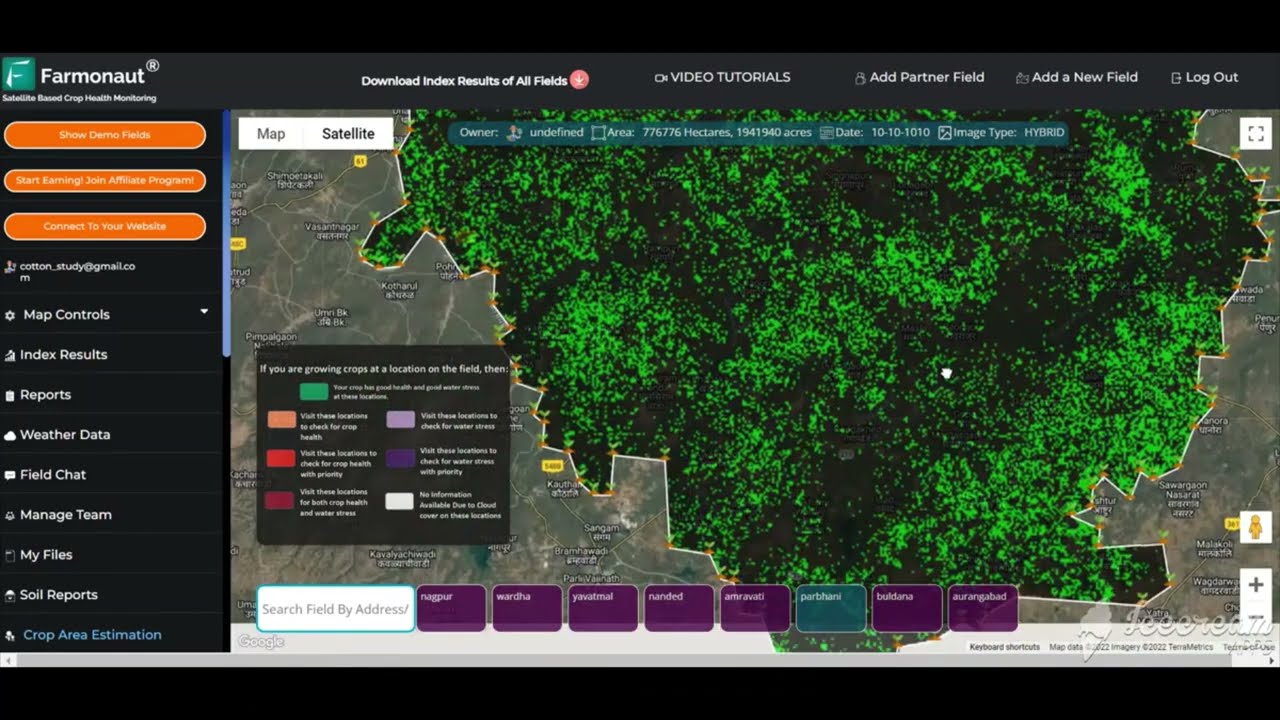
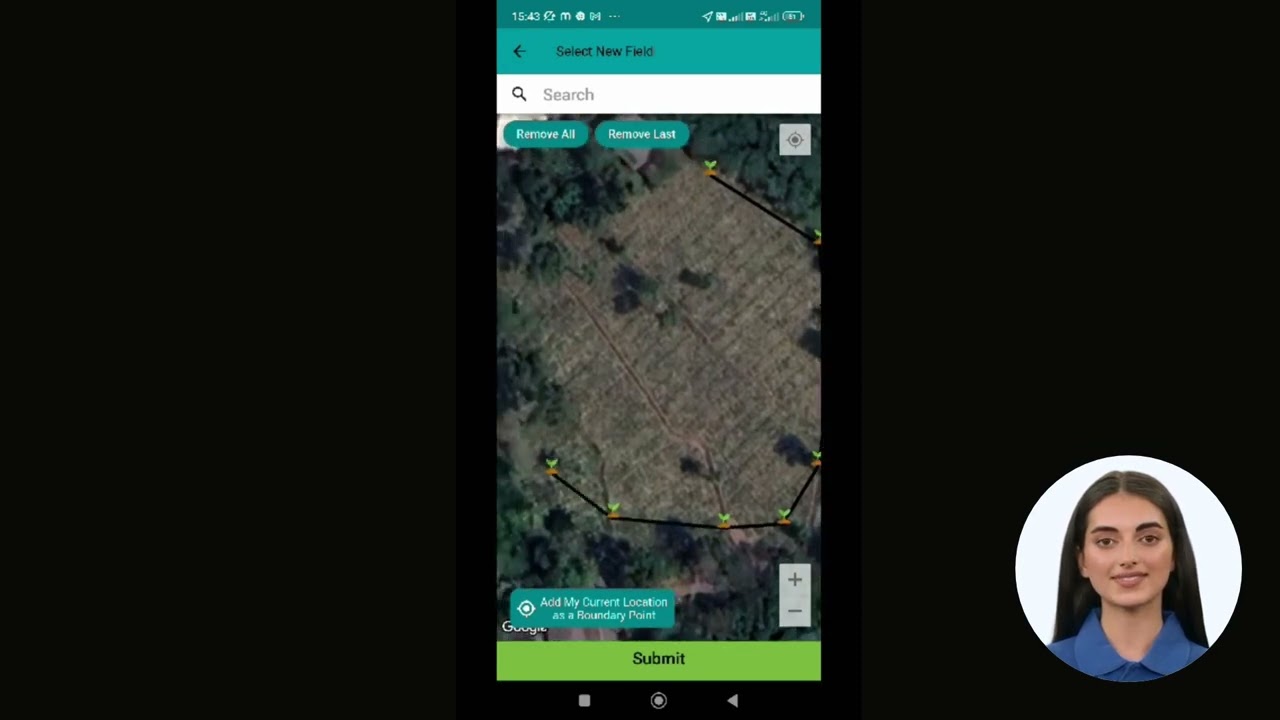
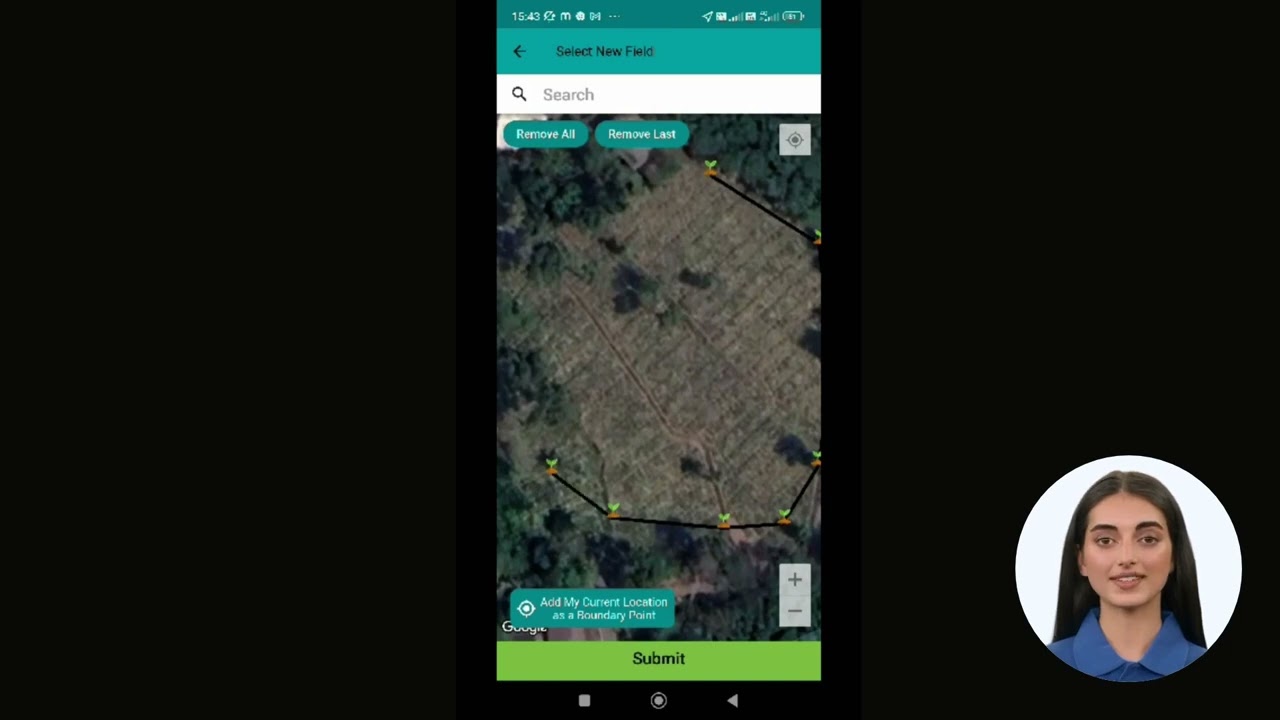
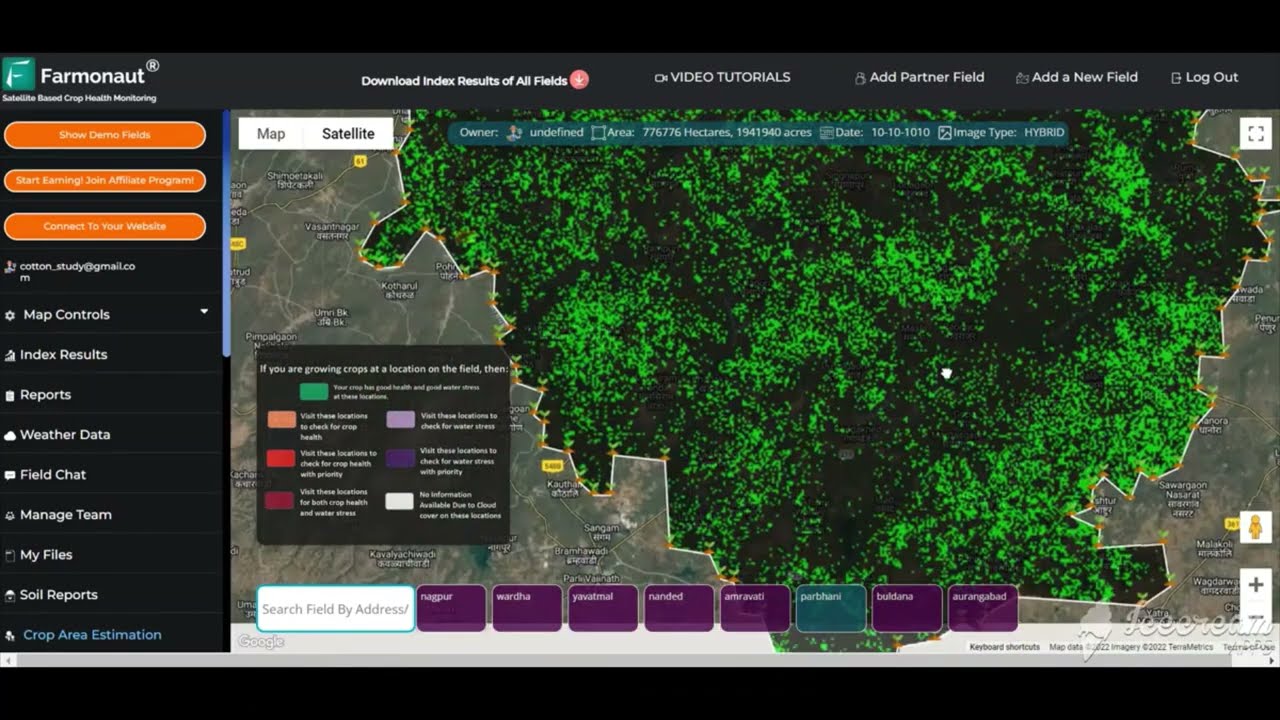
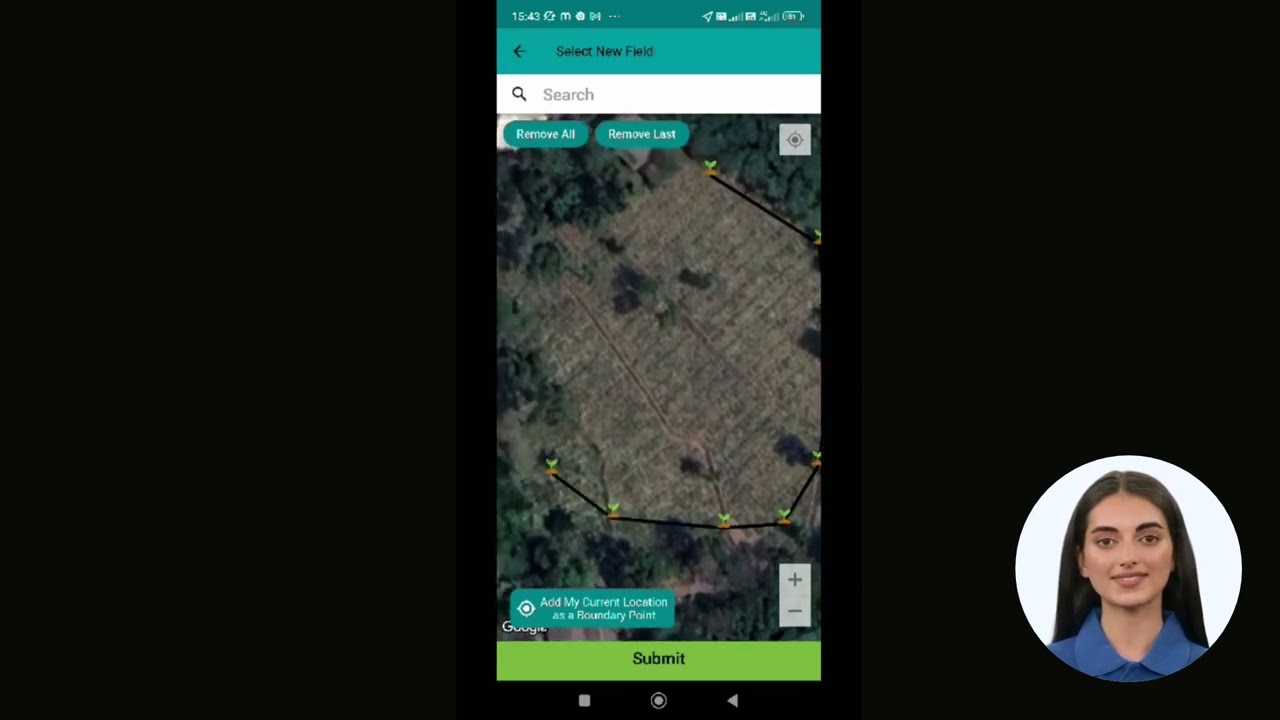
Farmonaut delivers satellite-based field mapping without requiring drone flights or hardware installs — relevant for ranch, vineyard, and row-crop operations that want mapping coverage across scattered or hard-to-access parcels. The platform combines:
- ✔ Satellite-based mapping software for vegetation health, soil moisture, and crop cycles
- ✔ Real-time, AI-powered advisory for input plans and weather-aligned scheduling
- ✔ Blockchain solutions for robust traceability, supporting certifications and supply chain authenticity
- ✔ Fleet and resource management tools for optimizing labor and equipment deployments
- ✔ Environmental impact metrics and carbon footprint monitoring to support sustainability reporting
- ✔ Real-time monitoring for individual farmers, ranch operators, and agri-enterprises
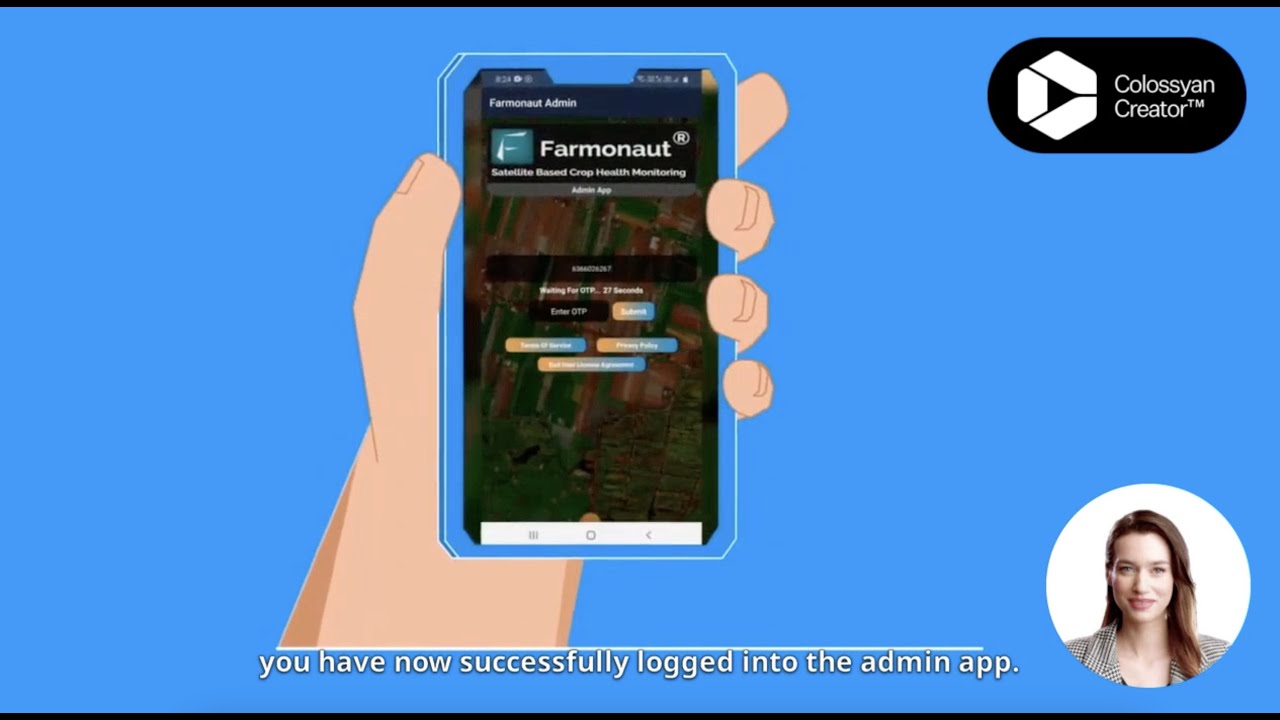
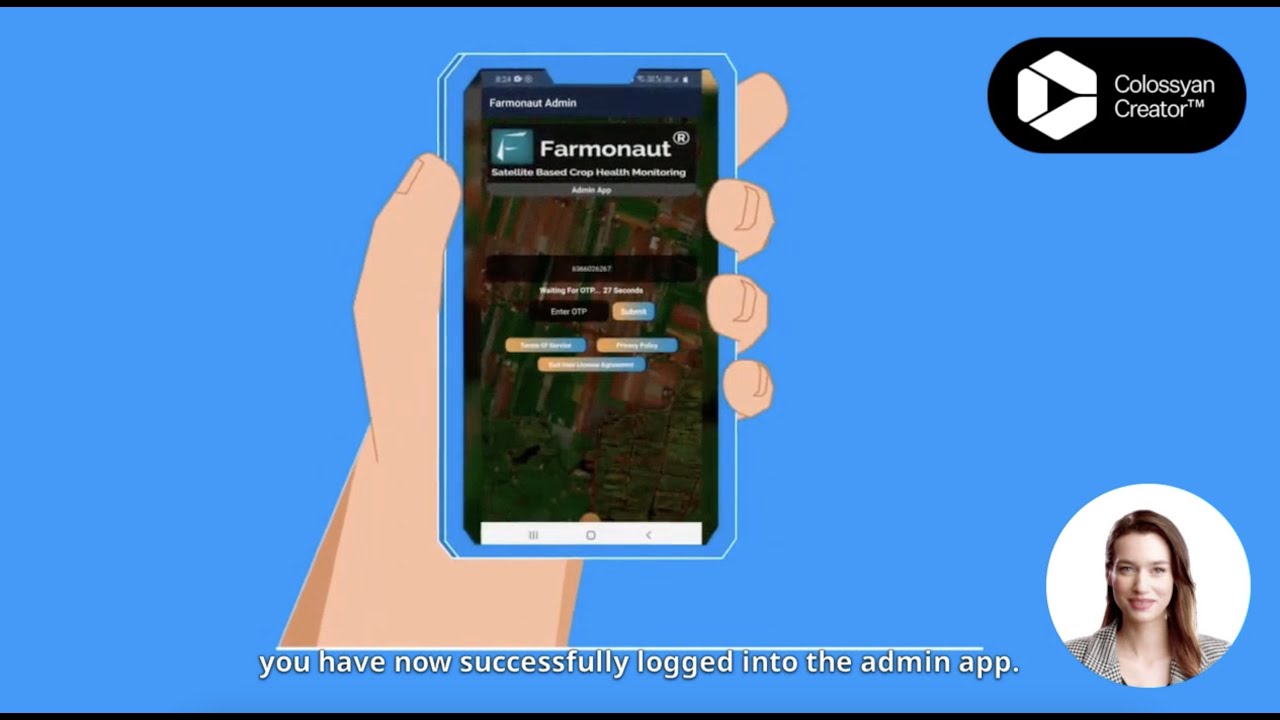
The platform is accessible on Android, iOS, browser/web app, and via API integration, for teams that want to build satellite field data into their own dealer or CPQ tools.



Developers interested in weather, mapping, and field analytics can review the weather API developer documentation, and large-scale operators managing many fields or ranch units can use the large-scale farm management app for centralized oversight.


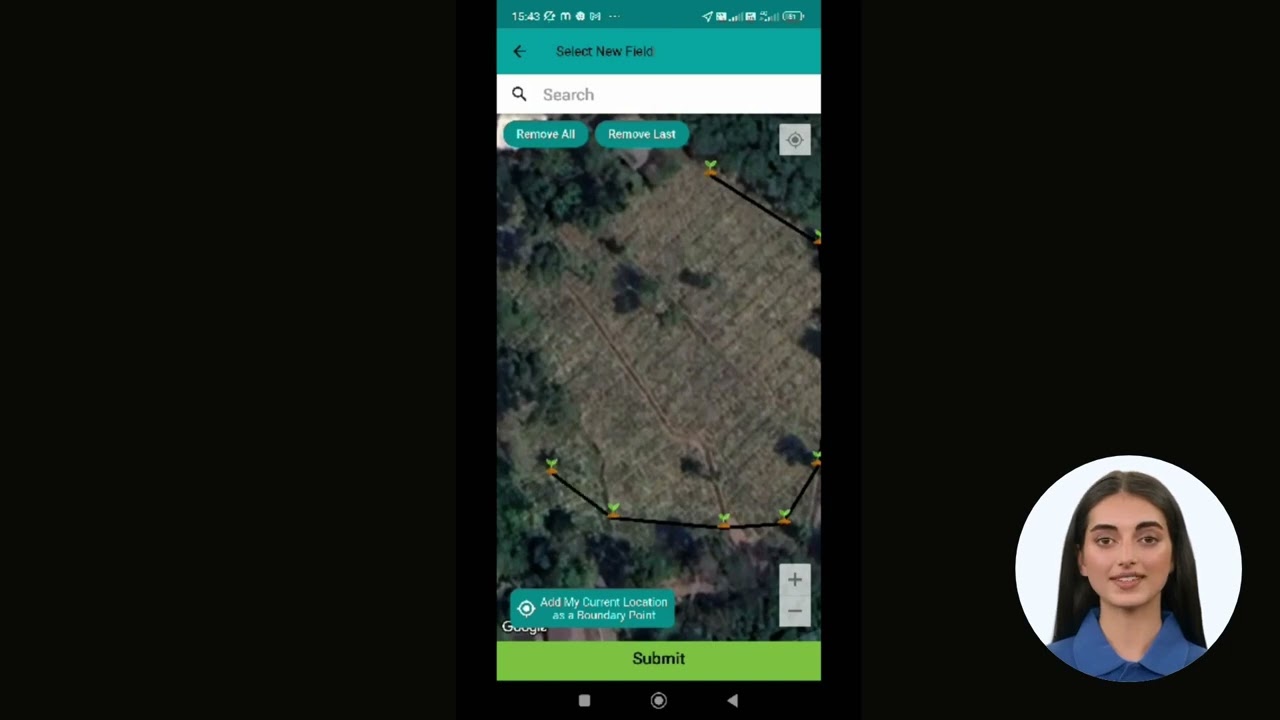
Farmonaut’s satellite crop loan and insurance verification tool helps lenders validate crop health and acreage remotely, which is a specific use case field mapping enables beyond on-farm planning: faster loan or insurance decisions backed by satellite acreage verification instead of a site visit.
CPQ Software for Agriculture & Farm Equipment
“Agricultural CPQ software,” “CPQ software for agriculture,” and “farm equipment CPQ software” are effectively the same buyer intent split across phrasing: a dealer, manufacturer, or input supplier needs to configure a complex product — a planter with attachments, a fertilizer blend, a financed equipment package — price it correctly against dealer-specific rules, and issue a quote without manual spreadsheet work. This is a distinct problem from field mapping or accounting software, and it sits inside a much larger enterprise software category.
The global CPQ software market was valued at $3.49 billion in 2025 and is projected to reach $10.84 billion by 2035, a 16.5% compound annual growth rate, according to Custom Market Insights (Custom Market Insights, CPQ market size). That figure covers CPQ across all industries — manufacturing, software, telecom, and agriculture combined — since no agriculture-specific CPQ market size breakout is published in the sources reviewed here. If your search intent is “how big is the ag CPQ market specifically,” the honest answer is that it isn’t broken out separately yet; the number to watch is the aggregate CPQ figure above, which agriculture is a growing slice of given how many equipment dealers have adopted CPQ tools since precision ag hardware got more configurable.
- ✔ Configurable products: field size, soil type, climate zone, and regulatory rules feed into the quote logic
- ✔ Integrated pricing logic, volume discounts, and compliance documentation
- ✔ Batch invoicing for custom fertilizer or reclamation services across multiple farms
- ✔ Automated order-to-invoice workflows with tax calculation built for agricultural sales
- ✔ Audit trails and traceability for every quote and price change
For farm equipment dealers specifically, the CPQ decision usually comes down to how well the tool models attachment compatibility and financing terms — a planter configured with the wrong row spacing or the wrong hitch type is the kind of error CPQ software exists to prevent, and it’s a different job from the general accounting or field-mapping problem the rest of this article covers.
Choose CPQ software that integrates with your field mapping software and accounting platform — this keeps input cost estimates tied to actual field data instead of static price lists.
Farm Accounting Software: What Sets It Apart
Searches for “accounting software for farming,” “farm accounting software Hamilton,” and “floqast agriculture” all point to the same underlying question: does a general-purpose accounting platform (or a close-the-books tool built for corporate finance teams, like FloQast) handle farm-specific needs, or do you need something purpose-built? FloQast itself is a financial close-management platform built for accounting teams doing month-end close and reconciliation — it is not an agriculture-specific product, and no agriculture-sector version or farm-specific feature set for it is documented in the sources reviewed for this article. If close-management automation for a larger agribusiness’s finance team is what you’re after, evaluate FloQast on its accounting-workflow merits rather than assuming farm-specific functionality exists.
For farm-level bookkeeping, the differentiator against QuickBooks or a regional platform (the “Hamilton”-style local accounting search intent usually points to a local bookkeeping firm or a regional QuickBooks reseller, not a distinct software product) is whether the system was built around:
- ✔ A farm-specific chart of accounts and cost centers reflecting per-field, per-crop, and seasonal operations
- ✔ Linking field activities (planting, fertilizing, harvest) directly to financial results
- ✔ Tracking costs for seed, fertilizer, labor, equipment depreciation, and fuel by field, not just by category
- ✔ Batch invoicing for custom services like contract spraying or custom harvesting
- ✔ Integration with grain, livestock, and input sales for audit and lending documentation
The market for this category is real and growing: IMARC Group sizes the US farm management software market — which includes accounting-adjacent functionality bundled with field and labor tools — at $691 million in 2024, projected to grow to $1,751 million by 2033 (IMARC Group, US farm management software market). That’s roughly 2.5x growth over nine years if the forecast holds, which signals real vendor investment in the category rather than a niche it’s likely to shrink out of.

Because IMARC revises these forecasts annually, typically in the third quarter, check the linked IMARC pages directly, or a business database like Statista, before citing the 2033 figure as unchanged — market-size forecasts get revised as adoption data comes in.
Agriculture Traceability & Farm Audit Software
“Agriculture traceability software” and “farm audit software” searches are increasingly driven by a specific, dated regulatory event: the FDA Food Traceability Rule (Section 204 of the Food Safety Modernization Act), which requires enhanced recordkeeping for high-risk foods on the FDA’s Food Traceability List. The compliance deadline was extended from its original date to July 20, 2028 (Lancaster Farming, FDA traceability rule coverage). If your operation grows, packs, or handles anything on the Food Traceability List, that date is the actual deadline to plan a system around — not a soft target.
No published adoption-rate figure for agriculture traceability software specifically was found in the sources reviewed for this article — the FDA rule’s existence is well documented, but how many farms have already implemented compliant traceability systems ahead of the 2028 deadline is not. The way to get a current adoption estimate for your sector is to check FDA’s own rule-implementation updates or trade-association surveys (produce, livestock, and packaged-goods associations each track this separately) rather than relying on a single industry-wide percentage.
Blockchain-based traceability tools — including Farmonaut’s product traceability module — let operations validate provenance from field to shipment, which is the audit trail both the FDA rule and most farm-audit software are built to produce. For farm audit software more broadly (financial audits, certification audits like organic or GlobalG.A.P., or lender audits), the traceability data layer and the accounting data layer need to reconcile — a field-mapped harvest record that doesn’t match the invoiced quantity is exactly what an auditor flags first.

Field Mapping ROI Calculator
Estimate the annual value of field mapping and variable-rate input planning on your own acreage, using the AEM-cited 5% precision-ag yield gain as the productivity input you can adjust:
Run your own numbers
Assumes the yield gain applies uniformly across all mapped acres and that the monthly software cost is constant year-round; excludes hardware, labor for map interpretation, financing costs, and any yield variability from weather. The 5% default is the Association of Equipment Manufacturers’ precision-ag figure cited above — replace it with your own trial results once you have a season of field data.
How to Choose the Right Software Suite
Choosing between field mapping, CPQ, and accounting software — or a suite that bundles them — comes down to five practical checks:
- 🟢 Operation type: Row-crop, ranch, and vineyard mapping needs differ enough that a generic “farm software” tool often underserves one of them — check for paddock/grazing support if you run livestock, and zonal block mapping if you run a vineyard.
- 🟢 Integration: Can the field mapping system feed cost data into your accounting platform and quote data into your CPQ tool without manual re-entry?
- 🟢 Compliance support: Does it handle the FDA traceability rule’s July 20, 2028 requirements if you’re on the Food Traceability List, and does it support audit documentation for lenders or certifiers?
- 🟢 Deployment and price fit: Match the monthly cost ranges in the comparison table above against your acreage — a $200/month tool priced for large diversified operations is a poor fit for a 40-acre vineyard.
- 🟢 Ease of use: Is the interface usable by field crew on mobile, not just by the office manager on a desktop?
Ask vendors for references from operations near your acreage and crop mix specifically — a tool’s rating on a 4.8 scale doesn’t tell you whether it was built for 40-acre vineyards or 4,000-acre grain operations.
FAQ
What’s the difference between field mapping software and a field mapping app?
They’re the same category described two ways — “software” usually implies the full desktop/cloud platform including data storage and reporting, while “app” often refers to the mobile interface used in the field. Most vendors, including Farmonaut, ship both under one subscription.
Is ranch mapping software different from crop field mapping software?
Yes — ranch mapping needs paddock boundaries, grazing rotation tracking, and water-point locations layered with livestock counts, which is why livestock-specific platforms like AgriWebb exist alongside general crop-mapping tools. If you run both crops and livestock, check that your mapping software supports both layers rather than assuming a crop-focused tool covers grazing.
Does vineyard mapping software need anything a row-crop platform doesn’t have?
Vineyards typically need finer management zones — block- and row-level canopy and irrigation data — because vineyard blocks are smaller and more variable than row-crop fields. No separate US adoption rate for vineyard-specific mapping software is published in the sources used for this article, so the practical step is to pilot on one block and measure the result yourself.
How is CPQ software for agriculture different from general CPQ tools?
Agricultural CPQ software needs to model farm-specific variables — field size, soil type, climate zone, and regulatory rules — into the quote logic, plus batch invoicing for services like custom spraying. The underlying CPQ market (all industries) was valued at $3.49 billion in 2025, projected to reach $10.84 billion by 2035, per Custom Market Insights; no agriculture-specific slice of that figure is separately published.
Is FloQast agriculture-specific accounting software?
No. FloQast is a financial close-management platform built for accounting teams handling month-end close and reconciliation across industries. No agriculture-specific version or farm feature set for FloQast is documented in the sources reviewed for this article — evaluate it on general accounting-workflow merits if your farm’s finance team needs close-management automation.
What’s the deadline for agriculture traceability software compliance?
The FDA Food Traceability Rule compliance deadline is July 20, 2028, extended from its original date, for operations handling foods on the FDA’s Food Traceability List. Check FDA’s rule-implementation pages directly for any further changes as the deadline approaches.
Can I integrate Farmonaut’s satellite mapping with my accounting or CPQ software?
Yes — Farmonaut offers APIs so satellite-derived field data can connect to your existing ERP, financial, or CPQ software, keeping mapped field activity and financial records in sync.



Final Words
Field mapping, CPQ, and farm accounting solve three different problems, and the USDA adoption figures above show why all three markets are growing at once: 70% of large-scale US crop farms already use autosteer guidance, the global CPQ market is on a 16.5% CAGR toward $10.84 billion by 2035, and US farm management software is projected to grow from $691 million to $1,751 million by 2033. Whichever category brought you to this page, match the tool to your operation type — row crop, ranch, or vineyard — before comparing price, and use the FDA’s July 20, 2028 traceability deadline as a planning anchor if it applies to what you grow or pack.
Start with a satellite-driven, AI-enabled field mapping platform built to work across farm sizes and operation types:
—and build out CPQ, accounting, and traceability integrations around it as your operation’s needs grow.
Discussion
Questions, corrections or field experience? Share them below. First-time comments are reviewed before they appear, and your email is never published.
No comments yet. Be the first to add a question or your experience.

 Hayleys Agriculture
 Linx Agritech
 Adinet
 Save Your Soils
 YelloSkye
 GalaxEye Space
 Grandstream Algérie
 XOS Realty
 Geospatial Lab Africa
 Agro La Gándara
 HIPSAC
 ZOL Zimbabwe
 Juligerm
 AdBio
AdBio MISE Maroc
 NWNS
NWNS Red August Group
 Farm Inc
 WeMe Global
 Agrotoken
 Licence holder · Niger · Gold










