

Irrigation · Question answered with field data
Drip vs Sprinkler Study: Maximum Yield Was 9 Tons per Acre
Choice A, 9 tons per acre, is the usual answer to this graph question, but check your own graph. For comparison, the record US corn average was 186.5 bushels per acre in 2025, about 5.2 tons (USDA).
Key takeaways
- The question asks for the maximum in any condition: read the single highest value. The usual answer is 9 tons per acre, choice A; check your graph.
- 9 tons of corn is about 321 bushels per acre, against a record US average of 186.5 bushels in 2025 (USDA).
- In a one-season K-State trial, buried drip corn yielded 195.8-202.3 bu/acre on 6.9-11.2 inches of irrigation.
- K-State reports 35-55% water savings for buried drip on corn compared with traditional methods; efficient pivots narrow that gap.
- Drip covered 6.4 million of 53.1 million US irrigated acres in 2023 (USDA), much of it in California.
In this article
- How to answer the two-year drip vs sprinkler question
- Is 9 tons of corn per acre realistic?
- What real drip irrigation trials show
- Drip vs sprinkler irrigation efficiency compared
- How much US farmland uses drip irrigation?
- Would drip pay on corn or wheat?
- Moving from sprinklers to drip: practical steps
- FAQ
The usual answer given is choice A, 9 tons per acre, but we could not find the original graph, so check it on your copy. The question asks for the maximum yield “in any test condition”, so you read the single highest value on the graph. Agricultural researchers conducted a two-year study comparing the effectiveness of different irrigation methods on crop productivity is the opening line of a test-style reading question, and it is not tied to a named paper or journal. If your graph shows a different highest value, go with your graph.
This page shows how to get the answer in about ten seconds. It then does what the question cannot: it compares 9 tons per acre with real field data. A later section gives a calculator that tests whether drip would pay on your own farm.
How to answer the two-year drip vs sprinkler question
This question tests one skill: pulling the right number from a graph. You do not need to know anything about farming. Follow these steps.
- Find the task word. The word is “maximum”, and the phrase “in any test condition” means all crops and all methods count.
- Ignore the story. The two years, the similar soils and the crop names set the scene. They do not change which bar is tallest.
- Find the tallest bar or highest point. Compare all four groups: corn with drip, corn with sprinkler, wheat with drip and wheat with sprinkler.
- Read it on the axis. Use the unit on the graph, tons per acre, and round to the nearest choice.
- Check the wording. “Approximately” tells you the bar may not sit exactly on a gridline.
Why the other choices are wrong
| Choice | Verdict | Why |
|---|---|---|
| A. 9 tons | Likely answer | It fits if the tallest bar on your graph reads about 9. |
| B. 10 tons | Unlikely | It fits only if a bar reaches about 10. Do not round up to a gridline. |
| C. 5 tons | Unlikely | It fits only if no bar goes above about 5. |
| D. 7 tons | Unlikely | It fails if any bar goes above about 7. |
A common mistake is to answer a different question, such as the average, or the gap between drip and sprinkler. Another is to look at one crop and stop. The phrase “any test condition” rules that out.
Is 9 tons of corn per acre realistic?
As a test number it is fine. As a farm result it would be extraordinary. Grain is sold in bushels, and a bushel of corn is counted as 56 pounds. So 9 short tons is 18,000 pounds, or about 321 bushels per acre.
Chart
The four answer choices in corn bushels per acre
Bushels per acre, converted at 56 lb per bushel and 2,000 lb per short ton
The record US average is far lower. The USDA Crop Production 2025 Summary put average corn yield at 186.5 bushels per acre in 2025, which works out to about 5.2 tons. The same report gives all-wheat yield as 53.3 bushels per acre, or about 1.6 tons at 60 pounds per bushel.
So a wheat bar at 7 tons, for example, would be more than four times the US average. Treat the graph as practice data. Do not use it to plan a farm budget. For how corn output differs across states, see our guide to corn yield per acre by state.
Chart
The 9-ton figure against real yields
Short tons per acre, converted from bushels (corn 56 lb, wheat 60 lb)
What real drip irrigation trials show
Real trials do support part of the story, but with smaller and less tidy effects. Kansas State University has studied subsurface drip irrigation, where lines are buried below the soil, for corn on deep silt loam at Colby since 1989.

▶ How AI tools are being used in corn fields from Kansas to Alabama · 11:16
A K-State report on the 2023 season gave four irrigation amounts through a buried system. Corn yields ran from 195.8 to 202.3 bushels per acre, while applied water ran from 6.9 to 11.2 inches. Cutting about 4 inches of water cost about 6.5 bushels. That is one season on a deep soil that stores a lot of water, so a lighter soil could respond differently.
In earlier Colby studies from 1989 to 1991, a K-State review by Lamm (2009) says careful management of buried drip cut net irrigation needs by nearly 25% while keeping top yields of about 200 bushels per acre. The review says this could mean 35-55% water savings against sprinkler and furrow systems running at 85% and 65% application efficiency. The K-State 2023 report repeats that range, comparing buried drip with traditional methods for corn. Neither source claims that drip nearly doubles corn yield.
Why the water saving is real but the yield gain is not automatic
Drip wets a small soil volume close to the roots, with less loss to wind and surface evaporation. A sprinkler throws water through the air. FAO irrigation training notes say spray is easily blown about by even a gentle breeze, which can seriously reduce uniformity.
Yield is another matter. A crop that already receives enough water gains little from a more precise delivery. Drip tends to help yield when water is limited, when the well cannot keep up at peak demand, or when a sprinkler system applies water unevenly. Crop water needs also differ by crop, climate and season length, as FAO crop water guidance explains.
Chart
Corn yield and irrigation in a K-State buried drip trial
Average yield, bushels per acre, by inches of irrigation applied; Colby, Kansas, 2023, one season
Drip vs sprinkler irrigation efficiency compared
Application efficiency is the share of water delivered to the field that ends up available to the crop. FAO indicative values are 60% for surface irrigation, 75% for sprinklers and 90% for drip. A Texas A&M AgriLife bulletin used more detailed assumptions for the Texas High Plains, shown below.
Chart
Assumed application efficiency by system
Percent, assumptions used in a Texas High Plains study, not field measurements
Those Texas numbers matter for one reason. A modern low-pressure center pivot can come close to buried drip. So the old claim that drip uses half the water of sprinklers depends on which sprinkler you mean. In the Texas index, buried drip needs 91% of the water of a low elevation spray pivot and about 62% of furrow irrigation, for the same effective water.
| Factor | Drip | Sprinkler or pivot |
|---|---|---|
| Water delivery | Slow, at or below the soil near roots | Sprayed over the canopy or just above it |
| Main water losses | Deep drainage if overwatered; leaks | Wind drift, evaporation, runoff at the outer span |
| Upfront cost | High initial cost, noted by K-State | Lower on large square fields |
| Field shape | Fits odd shapes | Pivots leave corners unless fitted with extras |
| Main risks | Clogging, rodents, hidden leaks | Uneven wetting, wind, wheel tracks |
| Seeing a fault | Hard when buried | Easier to see from the field edge |
How much US farmland uses drip irrigation?
Sprinklers remain the main method. The USDA 2023 Irrigation and Water Management Survey tables list 30.8 million acres under sprinklers, 18.3 million under gravity systems and 6.4 million under drip, trickle or low-flow micro systems. Some acres use more than one method, so the parts add to more than the 53.1 million total.

▶ Six plain steps to start precision agriculture on a farm · 4:18
Drip grew from 5.9 million acres in 2018, and California holds about 4.4 million of the 2023 total. That points to orchards, vines and vegetables far more than to grain. Only about 1.1 million US acres use sub-surface drip. The USDA release on the 2023 survey also reports an average of 1.5 acre-feet of water per irrigated acre, unchanged from 2018. For an older view, the USGS water-use report for 2015 estimated 5.49 million microirrigation acres on a different survey basis, so do not compare the two directly.
Chart
US drip and micro irrigation acres by type
Million acres irrigated in the open; acres can be counted under more than one type
Would drip pay on corn or wheat?
The answer depends on four numbers: extra cost per acre, system life, water and energy saved, and any yield change. Corn and wheat earn far less per acre than vegetables, so the margin for extra equipment is thin. The K-State report lists high initial cost as a major disadvantage of buried drip, though it says the economics can compare well with center pivots in some cases. It also names rodent damage, leak repair and constant monitoring as concerns.
System life matters a great deal. Lamm’s review says a life of 20 years or longer looks obtainable with consistent maintenance and good-quality water. Small-scale costs are a different picture: a University of Kentucky fact sheet estimated US$2,585 for the first acre of a vegetable drip system in 2015, plus about US$400 per added acre up to about 10 acres. Do not apply this to a buried grain system. Get a written local quote, and take professional advice before you borrow money for a system.
Try the numbers for your own farm below.
Calculator
Would drip pay for itself on your field?
Enter your own quote, water cost and crop price.
- Yearly benefit per acre (US$): $46
- Yearly cost of the extra system per acre (US$): $47
All default values are examples near break-even, not benchmarks or forecasts. Upkeep, interest and tax are left out, so add them to the extra cost. Get professional advice before you invest.
Moving from sprinklers to drip: practical steps
- Test the water first. Check hardness, pH, iron and sulfur. The Kentucky fact sheet advises this partly to prevent clogging, and it says filters are required for systems using surface water.
- Map the soil. Sandy and heavy zones need different run lengths and timing. Yield maps and soil surveys help here.
- Audit the existing system. A worn pivot may waste more than you think. The University of Nebraska center pivot handbook covers system capacity, application efficiency and runoff, and a nozzle upgrade may be the cheaper fix.
- Start with a pilot. Try one field or one zone, and keep a nearby sprinkler area as your comparison.
- Measure water and yield. Fit a flow meter and record inches applied and yield per zone for at least two seasons.
- Plan the upkeep. Budget for flushing, filter cleaning and leak checks. Follow product labels and local rules when injecting acid, chlorine or fertilizer, and check local rules on water rights and backflow prevention.
Spotting irrigation problems from above
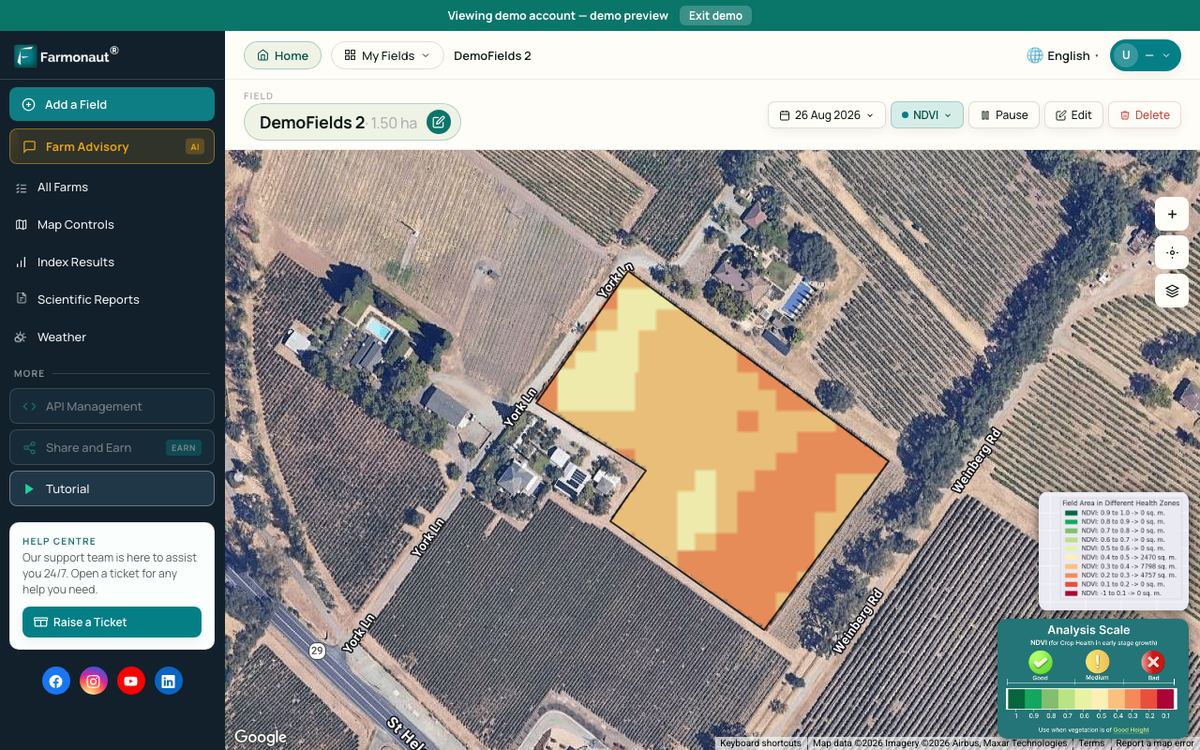
Buried lines give few visual signs of how water is spreading, which Lamm’s review lists as a drawback. Crop vigour is one way to catch a problem. A strip of weak canopy can follow a blocked line or a failed zone, although a satellite shows the change and not the cause, so walk the spot before you act. The Farmonaut Satellite + AI Farm Monitoring System tracks this kind of field-level crop change.
A quick check for any graph question
The same routine works for most graph items on reading tests. Name the task word first, such as maximum, minimum, difference or trend. Then check the axis label and unit before you read a value. Finally, match your reading to the choices and test the sentence once it is complete. If the sentence claims more than the graph shows, pick again. These habits take seconds, and they protect you from choices that are true of one crop or one method but not of the whole graph.

▶ Tutorial: monitoring crops with satellite imagery in the web system · 8:43
FAQ
What was the maximum crop yield in the two-year irrigation study?
The usual answer given is about 9 tons per acre, choice A. We could not find the original graph, so confirm it on the copy printed with your question.
Is the two-year drip and sprinkler study a real published paper?
The wording reads as a test-preparation item, and it names no authors or journal. Use it to practise reading a graph, and use trials such as the K-State reports for real farm decisions.
Does drip irrigation really cut water use by half?
It can against some systems, but not against all. K-State reports 35-55% for buried drip on corn compared with traditional methods, while a Texas A&M index shows buried drip needing 91% of the water of a low elevation spray pivot.
How many bushels is 9 tons of corn?
About 321 bushels, at 56 pounds per bushel and 2,000 pounds per ton. The US average in 2025 was 186.5 bushels per acre, a record, according to USDA.
Is drip irrigation worth it for wheat?
It is hard to justify in many cases, since wheat brings in less per acre than corn or vegetables. The US all-wheat yield was 53.3 bushels per acre in 2025 (USDA). Run your own numbers in the calculator on this page and get a local quote.
Related pages on our site: crop monitoring home, web and mobile app, large farm administration, carbon footprinting, crop loans and insurance, fleet management, product traceability, satellite API documents and API access.
Farmonaut crop monitoring
Watch your irrigated fields from space
Track crop vigour by field and zone with satellite imagery.



Keep reading


Sources
- USDA NASS, Crop Production 2025 Summary (January 2026): release.nass.usda.gov
- USDA NASS, 2023 Irrigation and Water Management Survey tables: nass.usda.gov
- USDA NASS, release on 2023 irrigation data (2024): nass.usda.gov
- Reyes Esteves, K-State, Analysis of SDI Strategies (2024): journals.newprairiepress.org
- Lamm, K-State review of SDI for corn (ASABE 09-5923, 2009): milab.ksu.edu
- FAO, Annex I: Irrigation efficiencies: fao.org
- FAO, Irrigation training manual, sprinkler irrigation: fao.org
- FAO, Irrigation water management: crop water needs: fao.org
- Texas A&M AgriLife Extension, bulletin B-6113: agecoext.tamu.edu
- University of Kentucky, drip irrigation fact sheet: publications.ca.uky.edu
- USGS Circular 1441, water use in the US, 2015: pubs.usgs.gov
- University of Nebraska-Lincoln, Center Pivot Irrigation Handbook EC3017: extensionpublications.unl.edu
Discussion
Questions, corrections or field experience? Share them below. First-time comments are reviewed before they appear, and your email is never published.
No comments yet. Be the first to add a question or your experience.

 Andex
 AgroRangers
 FCF India
 Unifrutti Gulf
 Deluxe Conseil
 TVS Electronics
 BW Pipelines
 WICO
 Gen Chayat
 Chimera Innovation
 SkyHarvest
 Polaris Digitech
 Teledarbas
 Wild Oak Farm
 SFX

 Licence holder · Niger · Gold
 Client · Tanzania · Gold










