

Copper and AI · Data guide
How Much Copper Does a Data Center Use? Calculator
Published estimates run from about 8 to 66 tonnes of copper per megawatt; modern AI sites sit near 20 to 40 (S&P Global, Bloomberg Intelligence). A 1 GW campus at 27 t/MW holds about 27,000 t, roughly 0.12% of 2025 world mine output (USGS).
Key takeaways
- Estimates of copper per megawatt range from 8 to 10 tonnes for traditional sites to 20 to 40 tonnes for AI-optimized sites (S&P Global, via Skillings); Bloomberg Intelligence uses 27 to 33 and Linesight 11.6.
- Bloomberg Intelligence (June 2024) estimated data centers could add about 2 million tonnes to world copper consumption by 2030, against about 28 million tonnes of total demand in 2025 (S&P Global, via Skillings).
- Data centers used about 415 TWh of electricity in 2024, 1.5% of the world total, with about 945 TWh projected for 2030 (IEA); US data centers used 4.4% of US power in 2023 (Lawrence Berkeley National Laboratory).
- LME copper settled at US$14,751 per tonne on 14 October 2026 (Westmetall); the World Bank’s third-quarter 2026 average of US$14,114 is 41.9% above its 2025 average of US$9,947; tariffs and stocks also drive the price.
- World mine output was flat at about 23 million tonnes in 2024 and 2025 (USGS estimate), so new demand meets a supply that is not growing quickly.
In this article
- How much copper does a data center use per megawatt
- Why the estimates differ by a factor of three or more
- Copper for a 100 MW, 500 MW and 1 GW campus
- Calculator: copper in your data center and the ore behind it
- How big is data center demand against the whole copper market
- Copper price and data center demand: what the data show
- Supply: where the extra copper has to come from
- What the numbers mean for explorers and licence owners
- Checks before you rely on a copper-demand figure
- Frequently asked questions
A data center needs roughly 8 to 40 tonnes of copper for every megawatt (MW) of capacity, depending on who counts and what they count. Linesight, a cost consultancy, uses about 11.6 tonnes per MW, Bloomberg Intelligence 27 to 33 tonnes, and S&P Global, as reported by Skillings Mining Review, 20 to 40 tonnes for AI-optimized sites. At 27 tonnes per MW, a 1 gigawatt (GW) campus holds about 27,000 tonnes, which is roughly 0.12% of one year of world mine output (our arithmetic on the USGS figure of 23 million tonnes for 2025). This page shows where the range comes from, gives a calculator for your own site, and sets the demand against the copper price and the mine supply that has to meet it.
Terms used below. A megawatt (MW) is the electrical capacity of a site, and 1,000 MW make 1 gigawatt (GW). Copper intensity is the tonnes of copper per MW. A busbar is a solid copper bar that carries heavy current inside a rack or switchboard. LME is the London Metal Exchange, and COMEX is the New York futures exchange; both quote copper, the LME in US dollars per tonne and COMEX in US cents per pound. Grade is the share of copper in the rock, written as % Cu. A tonne here is a metric tonne (1,000 kg, about 2,205 lb). Spelling follows US usage. This page is for information only and is not investment advice.
How much copper does a data center use per megawatt
No official statistic exists, so the published figures are estimates from bottom-up studies of what is installed. They sit in a band of about 8 to 66 tonnes per MW, and the gaps between them are large because the studies measure different things. The table lists the main ones with their basis, so you can pick the one that matches your project.
Chart
Copper per megawatt, published ranges
Tonnes of copper per MW of data center capacity; each source defines capacity and scope its own way
| Source | Tonnes of copper per MW | What it describes |
|---|---|---|
| S&P Global (via Skillings) | 8 to 10 | Traditional data centers, mainly power distribution and cooling |
| Linesight | About 11.6 | Typical data center; cooling and electrical systems are over 80% of the copper |
| S&P Global (via Skillings) | 20 to 40 | Modern AI-optimized data centers, with heavy busbars and liquid cooling |
| Bloomberg Intelligence | 27 to 33 | Applied power; 27 comes from a study of a Microsoft data center in Chicago that cost US$500 million |
| Schneider Electric (cited by Bloomberg Intelligence) | 66 | Ten-year life cycle, including later refits |
The S&P Global range and the Bloomberg Intelligence range overlap at about 27 to 33 tonnes per MW, which is why we use 27 as the middle case in the calculator below. The 66 tonnes of the Schneider study is a life-cycle figure, not the copper in the building on day one, and Bloomberg Intelligence notes that later refit demand is likely to be met by recycling.
Why the estimates differ by a factor of three or more
Three choices explain most of the gap. First, the boundary. A count that stops at the building wall gives a lower figure than one that adds the substation, the transmission line and the generation behind it. Skillings says that connecting a 500 MW AI campus needs substantial substation upgrades and miles of high-voltage line, all of which are copper-intensive and none of which sits inside the site fence.
Second, the type of load. AI servers draw more power per rack, so they need low voltage at high current, which calls for thicker cables and larger busbars to limit losses. Air cooling stops being enough at high rack density, and liquid cooling adds copper cold plates, manifolds and heat exchangers. Third, the unit. Capacity can be quoted as installed MW (the electrical equipment you build) or applied MW (the power the servers actually draw). Bloomberg Intelligence uses applied power, so the same building can show a different tonnes-per-MW figure under each convention.
Unit errors also creep in. InvestingLive, a trading news site, pointed out in January 2026 that a widely repeated claim of half a million tonnes of copper for a 1 GW site conflicts with the 200 kg of busbar per MW rack in the same Nvidia technical brief. That brief’s figure covers only rack busbars, and the “half a million” is probably pounds mistaken for tonnes. Treat any single number you meet online as a scenario until you know its boundary and unit.
Copper for a 100 MW, 500 MW and 1 GW campus
The table multiplies three round intensities by three campus sizes. The low case is the Linesight figure, the middle case the Microsoft-Chicago study cited by Bloomberg Intelligence, and the high case the top of the S&P Global range for AI sites. The results are our arithmetic, not forecasts.
| Campus size | At 11.6 t/MW | At 27 t/MW | At 40 t/MW |
|---|---|---|---|
| 100 MW | 1,160 t | 2,700 t | 4,000 t |
| 500 MW | 5,800 t | 13,500 t | 20,000 t |
| 1,000 MW (1 GW) | 11,600 t | 27,000 t | 40,000 t |
For scale, world mines produced about 23 million tonnes of copper in 2025 (USGS estimate), or roughly 63,000 tonnes a day. A 1 GW campus at the middle case therefore holds less than half a day of world mine output. The pressure comes from how many campuses are planned at once, which the next sections cover.
Calculator: copper in your data center and the ore behind it
Use the two calculators below with your own capacity, intensity and price. Pick the intensity from the table above; the default of 27 tonnes per MW is the middle case, not a benchmark. The copper price is an input too: enter today’s LME or COMEX price converted to US dollars per tonne (US$1 per lb is about US$2,205 per tonne).
Calculator
How much ore sits behind that copper?
Enter the copper you need and an ore grade and recovery of your own.
- Ore before recovery loss: 6.14 Mt
Example values only, not a benchmark. The default grade of 0.44% Cu is the 2008 average porphyry grade in the USGS deposit model; your deposit will differ. Recovery is an input. Mining and processing costs are not included.
Calculator
How much copper would your data center hold?
Enter your own capacity, copper intensity and price.
- Value at your price: $391,500,000
- Share of one year of world mine output: 0.12 %
- Days of world mine output: 0.43 days
Example values only, not a benchmark or forecast. Pick the intensity from the table above (11.6, 27 or 40 t/MW are published estimates). The price is an input: use today’s price in US dollars per tonne (US$1 per lb is about US$2,205 per tonne). The share line divides by 23 million tonnes, the USGS estimate of world mine output in 2025, a constant in the formula. Cables, grid connection and refits outside the site are not included.
How big is data center demand against the whole copper market
Small today, large as a share of growth. Bloomberg Intelligence estimated in June 2024 that global copper consumption could be 2 million tonnes higher by 2030 because of data center growth, with over half from the United States, and that North American data centers alone could add 1.1 to 2.4 million tonnes. It put the extra demand outside North America at 800,000 to 1.3 million tonnes, about the output of four to five mid-sized mines. These regional ranges are gross scenarios and should not be added together: the 2 million tonne figure is Bloomberg Intelligence’s net global headline, which allows for US reshoring and trade barriers reducing demand elsewhere. Linesight sees data centers and their power infrastructure needing more than 4.3 million tonnes over the next decade.
Chart
US data center electricity use
Terawatt-hours per year; 2028 values are the low and high ends of a scenario range
Against a total of about 28 million tonnes of world demand in 2025 and 42 million tonnes by 2040, the S&P Global figures reported by Skillings Mining Review, a 2 million tonne addition is about 7% of the 2025 level (our arithmetic). Data centers are one of several drivers, together with electric vehicles, grids and renewables. Skillings describes the AI build-out as a rival force to electric vehicles in that growth, and, citing S&P Global, reports production peaking near 33 million tonnes around 2030, leaving a possible shortfall of 10 million tonnes by 2040. These are forecasts from one study, and other banks and agencies publish different balances.
The electricity numbers give a second angle, because copper follows power. The International Energy Agency’s Energy and AI report puts data center electricity use at 415 terawatt-hours in 2024, about 1.5% of world electricity, rising to about 945 terawatt-hours by 2030. In the United States, the Department of Energy’s Lawrence Berkeley National Laboratory found that data centers used about 4.4% of US electricity in 2023, 176 terawatt-hours, and could use 6.7% to 12% by 2028, or 325 to 580 terawatt-hours. The 2028 numbers are a scenario range and depend on how fast AI hardware is adopted and how efficient it becomes. A terawatt-hour (TWh) is one billion kilowatt-hours.
Electricity and copper do not move one-for-one. More efficient chips can cut the power per task, while higher rack density raises the copper per MW. For that reason, treat both the TWh and the tonnes-per-MW figures as ranges. Our guide to edge data centers and copper demand covers the smaller sites that sit closer to users, and our article on global copper demand in million tonnes gives the wider consumption picture.
Copper price and data center demand: what the data show
Prices have risen sharply, but demand from AI is only one of several drivers. On 14 October 2026 the LME copper cash-settlement price was US$14,751 per tonne, with LME warehouse stocks of 228,000 tonnes, down from 251,350 tonnes on 28 September (Westmetall daily data). On 15 October 2026, COMEX futures were at US$6.52 per pound, below the record of US$6.72 set on 13 May 2026 (MetalCharts, a secondary aggregator). The two readings are a day apart and from different sources, so do not read a spread into them.
Chart
LME copper, quarterly average
US$ per tonne, third quarter 2025 to third quarter 2026
The World Bank’s Pink Sheet gives the longer run on a consistent basis. Its LME copper average was US$9,947 per tonne for 2025, and US$14,114 for the third quarter of 2026. That is 41.9% higher (our arithmetic) in under two years. The chart shows the quarterly path.
Why did the price rise? The World Bank’s April 2026 Commodity Markets Outlook says base metals, including copper, are expected to reach record highs on demand from data centers, electric vehicles and renewables. USGS adds a US-specific reason. It attributes the projected record 2025 COMEX average of US$4.80 per pound mainly to uncertainty over US tariffs on copper imports. In its table, the 2025 COMEX average (480 cents per pound) sat well above the LME average (440 cents), a gap of about US$880 per tonne (our arithmetic). US refined imports rose from 903 thousand tonnes in 2024 to an estimated 1,700 thousand in 2025, and year-end US refined stocks from 123 to 450 thousand tonnes.
The lesson for anyone budgeting a build: data center demand is a real part of the price story, but tariffs and stockbuilding move the price too, and the US and LME prices can diverge. Procurement teams that quote copper in a contract should name the exchange and the date.
Supply: where the extra copper has to come from
Mine output is not rising fast. The USGS estimates world mine production at 23 million tonnes in both 2024 and 2025, with Chile down from 5,510 to 5,300 thousand tonnes and Indonesia down from 1,010 to 710 thousand. Congo (Kinshasa) rose from 2,990 to 3,200 thousand and Russia from 1,020 to 1,300 thousand. Chile alone provided about 23% of mined copper in 2024, according to Natural Resources Canada. The chart below compares five producers.
Chart
Copper mine output, five producers
Selected producers (not the five largest; China and the United States are omitted), thousand tonnes of recoverable copper
New supply takes time. Skillings, summarizing the S&P Global study, says bringing a new copper mine into production can take 15 to 20 years from discovery. Two other points matter. First, recycling: the USGS estimates that scrap provided about 30% of US copper supply, 160,000 tonnes from old scrap and 760,000 tonnes from manufacturing scrap in 2025. Skillings lists permitting delays as one of the factors that keep the industry from filling the gap S&P Global projects.
The International Copper Study Group (ICSG) published its 2026/2027 forecast on 14 October 2026. It projects a refined copper surplus of about 104,000 tonnes for 2026 and 368,000 tonnes for 2027, with usage supported by digitalization (data centers and AI) among other sectors, and it warns that outcomes have deviated from its forecasts before. It also says output at Grasberg and Kamoa-Kakula remains constrained by incidents in 2025. Forecasts differ by publisher and date, so check the ICSG press releases for the latest.
▶ Explains why electric vehicles need more copper than gasoline cars and how much of the world’s copper comes through Chile. · 6:03
What the numbers mean for explorers and licence owners
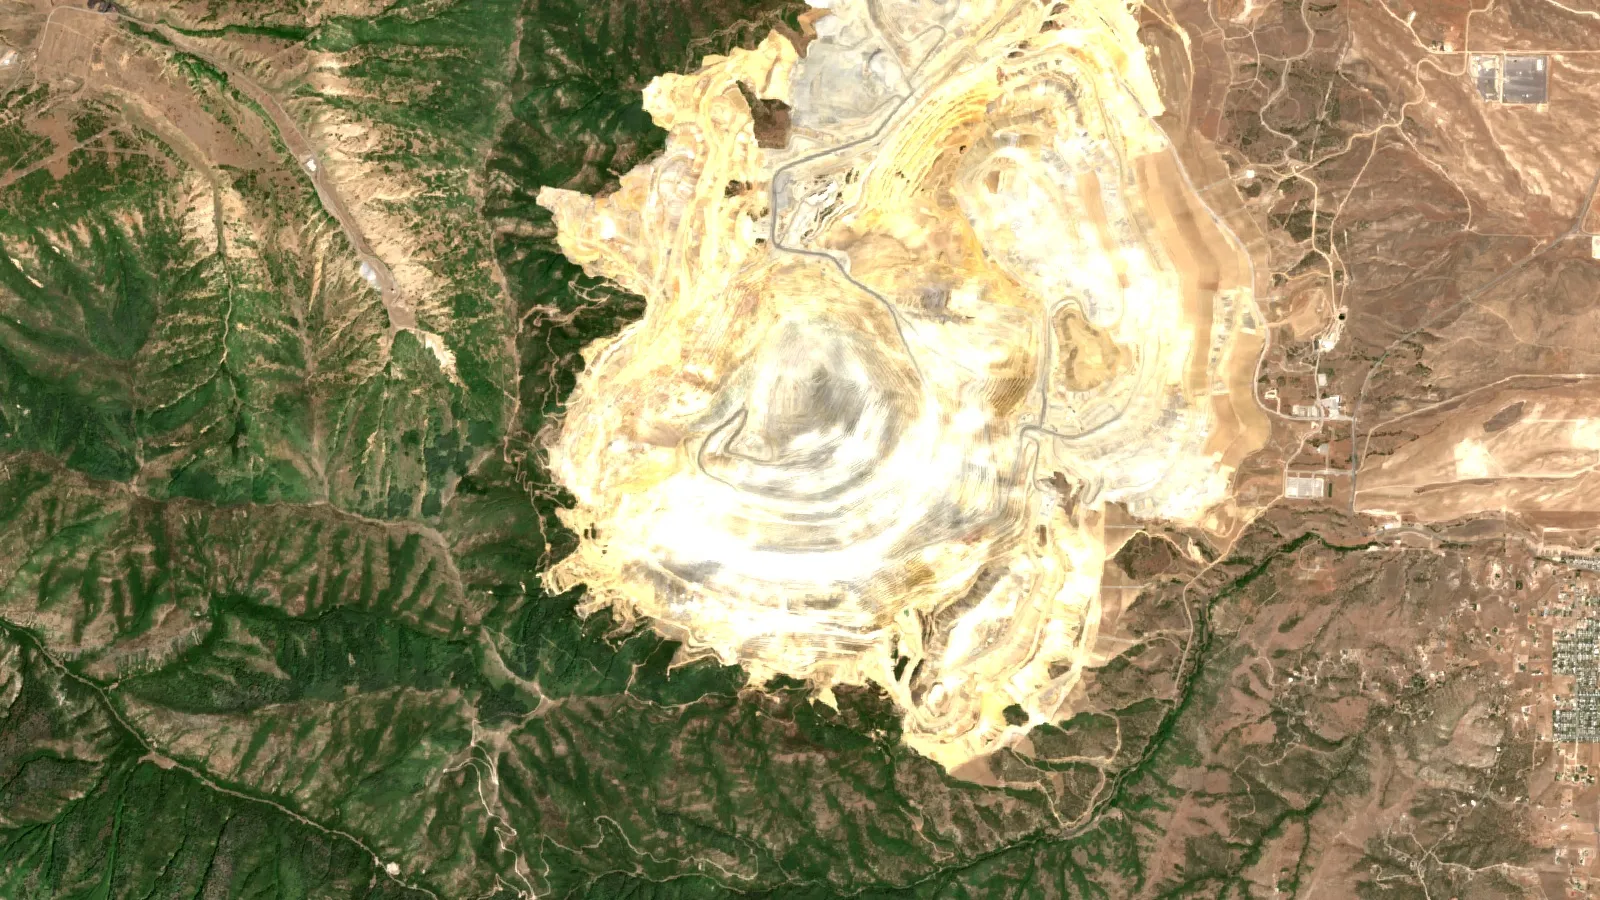
For a licence owner or a mining business, the useful translation is from megawatts to rock. Porphyry deposits supply about 60% of world copper at an average grade of 0.44% Cu, according to the USGS deposit model (2008 figure). At that grade, 27,000 tonnes of copper, the middle-case content of a 1 GW campus, sits in about 6.1 million tonnes of ore before any recovery loss (our arithmetic). That is one campus; several dozen of them multiply the figure. This is why developers and investors follow the grade, the size and the permitting stage of a project, and not only the copper price.
Exploration is where the supply response starts. Satellite screening can narrow an area before drilling by mapping the clay, mica and iron-oxide minerals that surround many copper systems. It points to targets, not to metal in the ground, and it sits ahead of any resource estimate. Our guides to copper deposits and where to explore and porphyry copper deposits explain the deposit types, and the satellite mineral detection page describes how a licence boundary is screened. Business owners who want a scoped quote can use the mining query form.
Checks before you rely on a copper-demand figure
Whether you are an investor reading a report or a developer planning a campus, five checks catch most errors.

▶ Explains how AI is used in mineral exploration, what it does well and where it fails. · 4:37
- Find the boundary. Does the figure cover the building only, or the substation and grid connection too?
- Find the unit. Installed MW, applied MW or GW of campus; tonnes or pounds; metric or short tons.
- Find the date and scenario. A 2024 estimate of 2030 demand is a scenario, and the sources above give different 2030 outcomes.
- Check who publishes it. A cost consultancy, a bank research desk, a trade magazine and a geological survey have different aims and data.
- Name the price. LME and COMEX can differ by hundreds of dollars a tonne, as USGS data show for 2025.
Nothing on this page predicts the copper price or recommends a purchase. Price levels, company outlooks and forecasts change; always check the date next to a number.
For a closer look at a related question, see our guide: Copper Mining Risk Management: 7 Steps and Calculator.
If this topic matters to you, read Energy Costs in Mining: Share of Gold and Copper Cost next.
Frequently asked questions
How much copper does a data center use per megawatt?
Published estimates range from about 8 to 66 tonnes per MW. Linesight uses about 11.6 tonnes, Bloomberg Intelligence 27 to 33 tonnes, and S&P Global 20 to 40 tonnes for AI-optimized sites (see the table above for bases and sources).
How much copper does a 1 GW data center campus need?
At 11.6, 27 and 40 tonnes per MW, a 1,000 MW campus holds about 11,600, 27,000 and 40,000 tonnes. That is our arithmetic on the published intensities, and the grid connection outside the site adds more.
Do AI data centers use more copper than traditional ones?
Yes, according to S&P Global as reported by Skillings: traditional sites needed 8 to 10 tonnes per MW and modern AI-optimized sites need 20 to 40, because of higher power density, bigger busbars and liquid cooling.
What share of world copper demand do data centers take?
It is a small share today. Bloomberg Intelligence expects data centers to add about 2 million tonnes to world consumption by 2030, against roughly 28 million tonnes of total demand in 2025 (S&P Global), which is about 7% of the 2025 level.
Will AI data centers push the copper price up?
They are one of the demand drivers the World Bank names for expected record highs in base metals. Tariffs and inventories also move the price, so no single factor explains it, and this page does not forecast prices.
What is the copper price today?
LME copper cash settled at US$14,751 per tonne on 14 October 2026 (Westmetall), and COMEX futures were at US$6.52 per pound on 15 October 2026 (MetalCharts). Prices change by the minute, so check the exchange before you quote.
Where in a data center is the copper?
Mostly in electrical and cooling systems. Linesight puts cooling and electrical infrastructure at over 80% of the copper, in items such as cabling, busway, switchgear, transformers and distribution equipment.
How much electricity do data centers use?
The International Energy Agency estimated 415 terawatt-hours in 2024, about 1.5% of world electricity, with about 945 terawatt-hours projected for 2030. In the US, Lawrence Berkeley National Laboratory found 4.4% of electricity in 2023 and a 2028 range of 6.7% to 12%.
Can recycling supply the copper for data centers?
Recycling helps but does not close the gap alone. The USGS estimates that scrap provided about 30% of US copper supply in 2025, and Bloomberg Intelligence expects later refit demand to be met by recycling, but new sites need new metal.
Is there enough copper for the AI build-out?
Reserves are large: the USGS lists 980 million tonnes of world copper reserves. The constraint is the pace of new mines, which Skillings says can take 15 to 20 years, not the quantity underground.
This page is for information only. It is not investment advice. Prices and forecasts change; confirm current figures with the exchange or publisher.
Farmonaut mining
Screen your copper licence from space
Send a licence boundary as KML, KMZ or a polygon and receive satellite-derived exploration targets, ahead of any resource estimate.

Mining Pro sample view, synthetic data
Keep reading


Sources
- USGS, Mineral Commodity Summaries 2026: Copper (February 2026): pubs.usgs.gov
- USGS SIR 2010-5070-B, Porphyry copper deposit model (2010): pubs.usgs.gov
- Bloomberg Intelligence, Copper demand is set for data-center boost (17 June 2024): bloomberg.com
- Skillings Mining Review, The 40-Ton Rule (reporting S&P Global): skillings.net
- Linesight, Copper volatility and APAC data centres (2026): linesight.com
- InvestingLive, The 500,000-ton typo (13 January 2026): investinglive.com
- IEA, Energy and AI: Executive summary (April 2025): iea.org
- US Department of Energy, report on data center electricity demand (Lawrence Berkeley National Laboratory, 2024): energy.gov
- World Bank, Commodity Price Data (Pink Sheet), October 2026: thedocs.worldbank.org
- World Bank, Commodity Markets Outlook, April 2026 press release: worldbank.org
- Westmetall, LME copper cash-settlement daily prices and stocks: westmetall.com
- MetalCharts, COMEX copper price (15 October 2026): metalcharts.org
- Natural Resources Canada, Copper facts: natural-resources.canada.ca
- International Copper Study Group, press releases: icsg.org
Discussion
Questions, corrections or field experience? Share them below. First-time comments are reviewed before they appear, and your email is never published.
No comments yet. Be the first to add a question or your experience.

 African Venture Partners Holding
 Congo Mining Solutions
 Mining SARL
 SenGold Invest SAS
 Sania Corporation
 Sean Mining Limited
 NTS Group (Pty) Ltd
 Mine4Africa
 Lithspo Minerals Limited
 Tintina Mining Group
 Dalgety Minerals Pty Ltd
 Vortex Minerals Pty Ltd
 Faith At Work (Pty) Ltd
 Geotech Mining Solutions plc
 Vulcan International Limited
 Kidepo Associates
 GKY Mining
 Alkimy SARL
 Double A Trading
 GemSprout Metals Limited











