

Battery metals · Producer guide
EV Battery Metals: Who Mines Each One and How Much
Five metals make up most of an EV battery. Australia mines the most lithium, the DRC the most cobalt, Indonesia the most nickel and China the most graphite (USGS, 2026). This guide gives output, per-car quantities and supply risks.
Key takeaways
- A 300-mile NMC-811 car holds about 68 kg of nickel, 10 kg of lithium, 8 kg of manganese and 8 kg of cobalt in its cathode (ICCT, 2024; US model-year 2023 average).
- The largest miner holds 78% of graphite, 74% of cobalt, 67% of nickel, 38% of manganese and 32% of lithium mine output in 2025 (USGS, 2026; our shares).
- World lithium mine output rose from about 222,000 t to an estimated 290,000 t of contained lithium between 2024 and 2025 (USGS, 2026).
- LFP cells, with no cobalt, were over 55% of EV batteries deployed in 2025 (IEA, 2026), and the DRC cobalt export quota runs to the end of 2027 (Cobalt Institute, 2026).
- Lithium reserves of about 37 Mt are around 2.5 times 2026 to 2040 demand in the IEA’s most demanding scenario, so timing and refining are the limits, not geology.
In this article
- Which metals go into an EV battery
- How much battery metal is in one electric car
- Where EV battery metals are mined
- Lithium: brine, hard rock and clay
- Cobalt and nickel: Congo, Indonesia and by-products
- Graphite and manganese: the quiet battery metals
- How battery chemistry changes metal demand
- Supply risks: export quotas and refining
- Environmental and community checks for battery metal mines
- Are there enough EV battery metals in the ground
- How new battery metal deposits are found
- What a consultant should check before chasing a battery metal project
- Frequently asked questions
Which metals go into an EV battery
Five materials do most of the work in an electric car battery: lithium, nickel, cobalt, graphite and manganese. Lithium is in every lithium-ion cell. Nickel, cobalt and manganese sit in the cathode of some chemistries and not others, and graphite forms the anode. Each one comes from a different part of the world, and for four of the five a single country mines more than a third of the world total.
The table shows the largest miner of each material and its share of world mine output in 2025 (estimates from the USGS Mineral Commodity Summaries, February 2026). Mine output is the first step only. Refining is even more concentrated, which we cover below.
| Material | Job in the battery | Largest miner, 2025e | Output of that country | World mine output, 2025e |
|---|---|---|---|---|
| Lithium | Carries the charge between anode and cathode | Australia | 92,000 t (32%) | 290,000 t of contained lithium |
| Cobalt | Stabilises the cathode in NMC cells | Congo (Kinshasa), the DRC | 230,000 t (74%) | 310,000 t |
| Nickel | Raises the energy stored per kilogram in high-nickel cathodes | Indonesia | 2,600,000 t (67%) | 3,900,000 t |
| Graphite (natural) | Anode material | China | 1,400,000 t (78%) | 1,800,000 t |
| Manganese | Cathode component in NMC cells; high-purity grades only | South Africa | 7,600,000 t (38%) | 20,000,000 t of contained manganese |
The shares are our own division of USGS country figures by the USGS world totals. Two notes on reading the table. First, NMC means lithium nickel manganese cobalt oxide, the cathode family used in many long-range cars. Second, most electric car batteries today use synthetic graphite rather than mined flake, according to the International Council on Clean Transportation, so the natural graphite row understates the anode story.
How much battery metal is in one electric car
A long-range electric car carries tens of kilograms of nickel but only about ten kilograms of lithium. The ICCT calculated that an NMC-811 cathode (80% nickel, 10% manganese, 10% cobalt in the metal part) holds about 0.10 kg of lithium, 0.08 kg of manganese, 0.65 kg of nickel and 0.08 kg of cobalt per kilowatt-hour (kWh) of battery in 2023. For an average 300-mile model-year 2023 US battery electric car, which the ICCT puts at a battery of about 104 kWh, that means about 10 kg of lithium, 8 kg of manganese, 68 kg of nickel and 8 kg of cobalt in the cathode.
Chart
Cathode metals in one 300-mile NMC-811 car
Kilograms per car, US model-year 2023 average, about 104 kWh pack
These are cathode metals only; graphite, copper and aluminium come on top. Cars with lithium iron phosphate (LFP) cells use different amounts: no cobalt at all, as the IEA Global EV Outlook notes. The ICCT assumes battery mass per kWh falls about 20% by 2032, mainly from less inactive material and a graphite-silicon anode, while the lithium, manganese, nickel and cobalt per kWh stay the same.
For scale, the metals are a small part of the sticker price. The IEA estimates that critical minerals make up about one quarter of battery cell cost but only about 3% of the price of an average electric vehicle, and that a tripling of battery material prices would lift EV prices by around 5% (IEA, Global Critical Minerals Outlook 2026). The calculator below turns a fleet size and pack size into tonnes of metal and compares it with the whole world mine supply.
Calculator
How much battery metal does your EV fleet need?
Enter your own fleet size, pack size and metal content per kWh. Results update as you type.
- Nickel needed (tonnes): 67,600
- Cobalt needed (tonnes): 8,320
- Share of world lithium mine output (%): 3.6%
- Share of world nickel mine output (%): 1.7%
- Share of world cobalt mine output (%): 2.7%
- Lithium carbonate value (US$): $553,592,000
Example values only, not benchmarks. Defaults for kg per kWh come from the ICCT NMC-811 cathode figures (2023). The default 104 kWh pack is an example, set to the ICCT basis; the ICCT’s 2023 US average 300-mile car has about 104 kWh, which gives the 10 kg lithium, 68 kg nickel and 8 kg cobalt per car quoted above; LFP packs hold no cobalt. World mine output of lithium, nickel and cobalt (290,000 t, 3,900,000 t and 310,000 t in 2025, estimates) is from USGS, Mineral Commodity Summaries 2026. Lithium carbonate holds 18.8% lithium (5.323 tonnes of carbonate per tonne of lithium). The carbonate price is an input in US$ per tonne: use today’s price.
Where EV battery metals are mined
Mining is spread across four continents, but each metal has its own centre. Lithium comes mainly from Western Australia hard-rock mines, Chilean and Argentine salt flats and Chinese operations. Cobalt comes from the copper belt of the DRC. Nickel comes mostly from Indonesia. Graphite comes from China, with African growth. The chart ranks the five materials by how much of the world mine output the single largest country holds.
Chart
Share of world mine output held by the top country
Percent, 2025 estimate: graphite China, cobalt DRC, nickel Indonesia, manganese South Africa, lithium Australia
Concentration at the mine is only half of the picture. According to the IEA, the top refining country held an average 72% market share across critical minerals in 2025 (excluding rare earths), up from 70% in 2023, and over the last two years Indonesia (for nickel) and China (for other key energy minerals) accounted for over three quarters of the growth in refined supply (IEA, Global Critical Minerals Outlook 2026).
Lithium: brine, hard rock and clay
World lithium mine output rose from about 222,000 tonnes of contained lithium in 2024 to an estimated 290,000 tonnes in 2025, an increase of roughly 31% (USGS, 2026). Australia produced an estimated 92,000 t, China 62,000 t, Chile 56,000 t, Zimbabwe 28,000 t and Argentina 23,000 t. Mali is the newest name on the list: output rose from 770 t to 9,400 t as two new operations started in 2024.
Chart
Lithium mine output rose in all six countries shown
Thousand tonnes of contained lithium, selected countries
Lithium comes from three kinds of deposit. Hard-rock deposits are pegmatites rich in spodumene, a lithium aluminium silicate; they are mined like any open pit or underground mine and the ore is crushed into a concentrate. Brines are salty water under dry lake beds that is pumped to the surface and concentrated in evaporation ponds or by direct lithium extraction (DLE), a family of filters and sorbents that pull lithium from the brine without long pond times. Clays are lithium-bearing sedimentary rocks. A 2026 commodity profile from the International Institute for Sustainable Development shows global lithium reserves split 57% in salar-brine deposits and 26% in hard rock, the rest in clays and other sources.
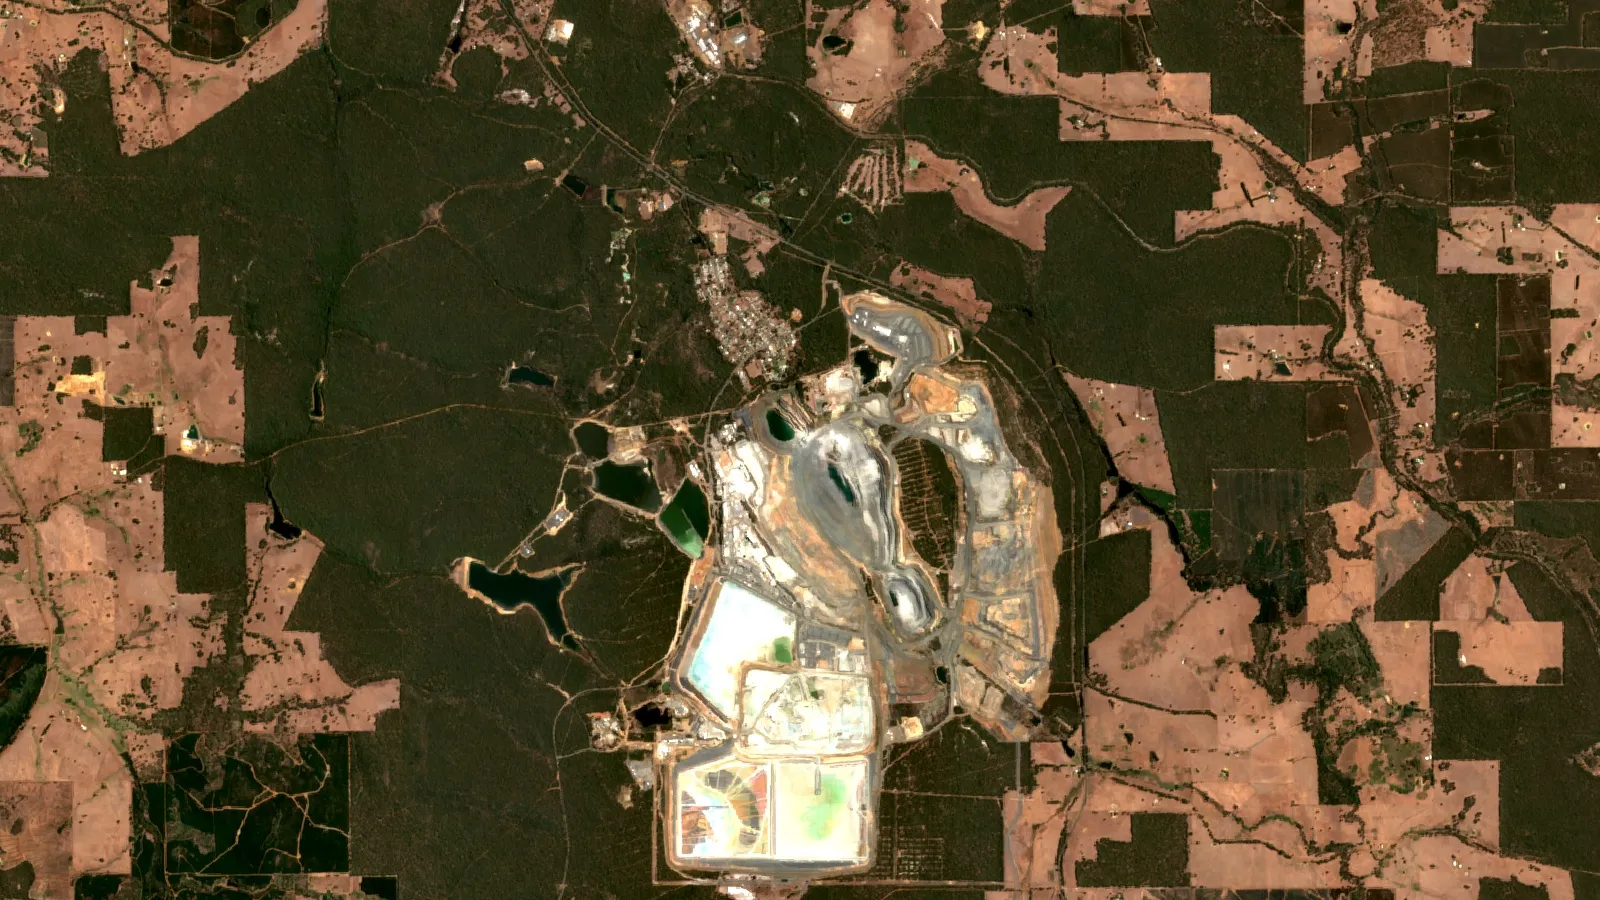
The best-known hard-rock mine is Greenbushes, about 250 km south of Perth in Western Australia. It is run by Talison Lithium Australia, which Albemarle describes in its annual filing as owned 49% by Albemarle and 51% by Tianqi Lithium Energy Australia, itself held by Tianqi Lithium (26.01%) and IGO Limited (24.99%). The filing reports probable ore reserves of 164.5 million tonnes at an average 1.9% Li2O as at 30 June 2025 on a 100% basis, with a mine life that runs to 2048 (Albemarle technical report summary, filed with the SEC). Li2O is lithium oxide, the way hard-rock grade is quoted; a concentrate sold as SC6 carries about 6% Li2O.
Lithium resources (the part of the ground that may one day be mined) are even more spread out than output. The USGS lists measured and indicated lithium resources of about 150 million tonnes worldwide, of which Argentina holds 28 million, Bolivia 23 million and Chile 13 million. Those three countries, often called the Lithium Triangle, together hold about 64 million tonnes, or 43% of the world total. Our post on lithium mining effects in the Lithium Triangle covers the water side, and lithium brine extraction in seven steps shows how a salt flat becomes carbonate. For the miners themselves, see the ranking of the largest lithium mining companies.
Prices explain a lot about what gets built. The USGS gives the average annual price of battery-grade lithium carbonate, in real dollars, as US$63,700 per tonne in 2022, US$39,000 in 2023, US$11,800 in 2024 and an estimated US$9,000 in 2025. The IEA reports that lithium prices then more than doubled across 2025 and early 2026 on strong energy storage demand and constrained supply. Use a current quote from your own price source in the calculator, not these historic averages.
Cobalt and nickel: Congo, Indonesia and by-products
Cobalt is rarely mined for itself. In the DRC it is a by-product of copper, and in Indonesia a by-product of nickel. In its 2025 market report the Cobalt Institute puts world cobalt demand at 276,000 t, up 13% on the year, with electric vehicles the largest single use at 113,000 t (39% of demand, up 25%). Mined supply was flat near 270,000 t, and the DRC supplied 73% of it, down from 77% a year earlier. Indonesia was second with 42,500 t, 14% of the total (Cobalt Institute, Cobalt Market Report 2025, May 2026).
Chart
Where world cobalt demand came from
Thousand tonnes of cobalt, 2025 (total 276)
The same report names the largest single cobalt asset as CMOC’s Kisanfu mine in the DRC, which started production in 2023 and is estimated to have made more than 80,000 t of cobalt in hydroxide in 2025, almost double all Indonesian assets combined. Three groups, CMOC, Glencore and Eurasian Resources Group, accounted for over 78% of DRC production and over 57% of world production.
Policy now moves the cobalt market as much as geology. The DRC banned cobalt exports on 22 February 2025, then moved to an export quota system from October 2025 that the regulator ARECOMS announced would initially run to the end of 2027; the first quota for the fourth quarter of 2025 was 18,125 t, and miners prepay a 10% royalty on their maximum quota. The Cobalt Institute records cobalt hydroxide prices rising over 300% during 2025, with sulphate up 266% and metal up 130%. The IEA now projects a cobalt supply gap because of the quota.
Nickel is far bigger by weight. World mine output was an estimated 3.9 million tonnes in 2025, and Indonesia mined 2.6 million of them, ahead of Russia (200,000 t), Canada and New Caledonia (140,000 t each), China (120,000 t) and Brazil (70,000 t). Australian output fell from 98,000 t to 45,000 t between 2024 and 2025 (USGS, 2026). The USGS estimates nickel resources above 350 million tonnes of contained nickel, 54% in laterites (weathered tropical rock) and 35% in magmatic sulphide deposits. The only US primary nickel mine, the underground Eagle Mine in Michigan, made about 10,000 t of nickel in concentrate in 2025 according to the USGS. Cobalt and nickel exploration targets are discussed in our guide to graphite, nickel, cobalt and vanadium targets.
Graphite and manganese: the quiet battery metals
Graphite attracts less attention than lithium but is the most China-centred of the five. The USGS estimates China mined 1.4 million tonnes of natural graphite in 2025, out of a world total of 1.8 million. Behind China come Madagascar (80,000 t), Tanzania (75,000 t), Brazil (65,000 t) and Mozambique (60,000 t). World reserves are 310 million tonnes, 100 million of them in China. The United States produced no natural graphite and relied on imports for 100% of its apparent consumption of 71,000 t.
The processing step matters more than the mine. The IEA estimates that China produced more than 90% of the anode active material used in electric car batteries in 2025. In October 2025 China announced export controls on graphite anode materials, cathode materials and cathode precursors, and the IEA says that a full disruption of battery-grade graphite trade would put over US$300 billion a year of downstream production outside China at risk. Mozambique has also introduced trade restrictions on graphite (IEA, Global Critical Minerals Outlook 2026).
Manganese is mostly a steel input, so battery use is a small slice of a large market. South Africa mined 7.6 million tonnes of manganese content in 2025 (estimate), followed by Gabon (5.0 million), Ghana (2.0 million) and Australia (1.6 million), out of 20 million tonnes worldwide, and South Africa holds an estimated 70% of the world’s manganese resources (USGS, 2026). Battery cells need high-purity manganese, a processed chemical product, and the IEA notes that nearly all of the supply growth in manganese refining in recent years came from the dominant supplier.
How battery chemistry changes metal demand
Which metals a car needs depends on its cell. In 2025 lithium iron phosphate (LFP) cells made up over 55% of the EV batteries deployed worldwide, up from nearly 50% in 2024, and LFP now powers two thirds of electric car sales in emerging and developing economies outside China. LFP cells use iron and phosphate in the cathode, contain no cobalt, and were on average more than 40% cheaper per kWh than NMC in 2025, though part of that gap reflects the lower energy density needed for stationary storage, where LFP dominates (IEA, Global EV Outlook 2026).
Regional patterns differ. LFP supplied more than 10% of EV battery demand in the European Union in 2025, almost all of it imported from China directly (30%) or inside cars (nearly 70%), while the LFP share in the United States almost halved from a low base after higher tariffs and tax-credit sourcing rules. Sodium-ion batteries are entering scale-up in China. The IEA says the latest sodium-ion cells reach up to 175 Wh/kg against up to 205 Wh/kg for the newest LFP, which suits shorter-range cars and storage rather than long-range models.
Size matters too. The IEA counts more than 20 million electric car sales worldwide in 2025, up 20%, and EV battery deployment of 1.2 terawatt-hours, nearly 30% more than in 2024 and more than seven times the 2020 level. More cars with fewer nickel and cobalt atoms per kWh means lithium demand grows faster than cobalt demand, and the Cobalt Institute still saw EV cobalt demand rise 25% in 2025.
Supply risks: export quotas and refining
For a consultant or investor, the practical risk is no longer only geology. It is who controls the next step after the mine. China was the leading refiner for 19 of 20 strategic minerals in 2024, with an average share of about 70% (IEA, Global EV Outlook 2026). The number of mineral tariff codes under Chinese export controls has tripled since 2023, and the DRC, Zimbabwe (lithium) and Mozambique (graphite) have added restrictions of their own (IEA, Global Critical Minerals Outlook 2026).
Money has not kept pace. The IEA reports that capital spending on battery metals fell by more than 20% in 2025, its largest drop in over a decade, with lithium companies cutting investment by about 40%. Exploration spending fell by more than 10% overall, with roughly 45% declines in lithium and nickel. New refining outside the dominant supplier costs more: capital costs are 20% to over 150% higher and operating costs about 50% higher on average. Planned cathode capacity outside the leading supplier is only about one third of projected lithium mining capacity, so mines can be ready before the next step in the chain.
Processing inputs add another risk. The IEA notes that disrupted sulphur supplies in 2026 pushed China to curb sulphuric acid exports in May, and that acid costs overtook energy costs as the largest cost item in some processing cases for lithium, cobalt and nickel.
Environmental and community checks for battery metal mines
Mining for EVs is a small part of total mining. The IEA estimates that of about 8 billion tonnes of critical mineral ore mined in 2024, around 320 million tonnes were related to EV batteries and motors, and copper made up roughly 85% of the total by mass. The impacts are real all the same: land clearing at open pits and laterite mines, tailings storage, water use in dry brine regions. Plan for three checks on any battery-metal project: the water source and how brine or process water is returned; the tailings and waste rock plan; and the traceability of the product to the buyer.
Recycling will not remove the need to mine soon, but it grows. The IEA expects battery recycling in its Stated Policies Scenario to meet 10% to 20% of lithium and nickel demand and over 30% of cobalt demand by 2050, and average recycling rates across key energy minerals could rise from around 10% today to close to 20% by 2040. China held over three quarters of global battery recycling pre-treatment capacity and 90% of material recovery capacity.

▶ Walks through the seven environmental impacts of mining in plain words. · 2:31
Are there enough EV battery metals in the ground
On geology, yes. The IEA says global lithium reserves of around 37 million tonnes are about two and a half times the cumulative demand projected for 2026 to 2040 in its most demanding scenario (Net Zero Emissions by 2050), and more than four times the demand in its Stated Policies and Current Policies scenarios. Nickel and cobalt reserves are one and a half to two times the NZE demand over the same period. Lithium reserves grew by about 75% between 2020 and 2025 as exploration continued (IEA, Global EV Outlook 2026).
The IEA projects the global EV fleet, excluding two- and three-wheelers, to grow more than sixfold by 2035 from 2025 levels to as many as 510 million vehicles under current policies. The gap that matters is therefore time and place: how fast new mines and refineries can be permitted and built where the buyers need them, not how many tonnes exist. That is where early-stage exploration, permitting data and honest grade information carry the most weight.
▶ Follows the money from the ground up: what mining does for an economy and why the world needs energy-transition minerals. · 5:03
How new battery metal deposits are found
Exploration for these metals follows the deposit type. Pegmatite lithium is found by mapping granite-related intrusions, then following surface sampling and drilling. Brine projects rely on basin geometry, water chemistry and test wells. Nickel laterites form over ultramafic rocks in tropical climates, while nickel sulphides are found with geophysics and drilling. Cobalt in the DRC sits in sediment-hosted copper deposits, as the USGS notes.
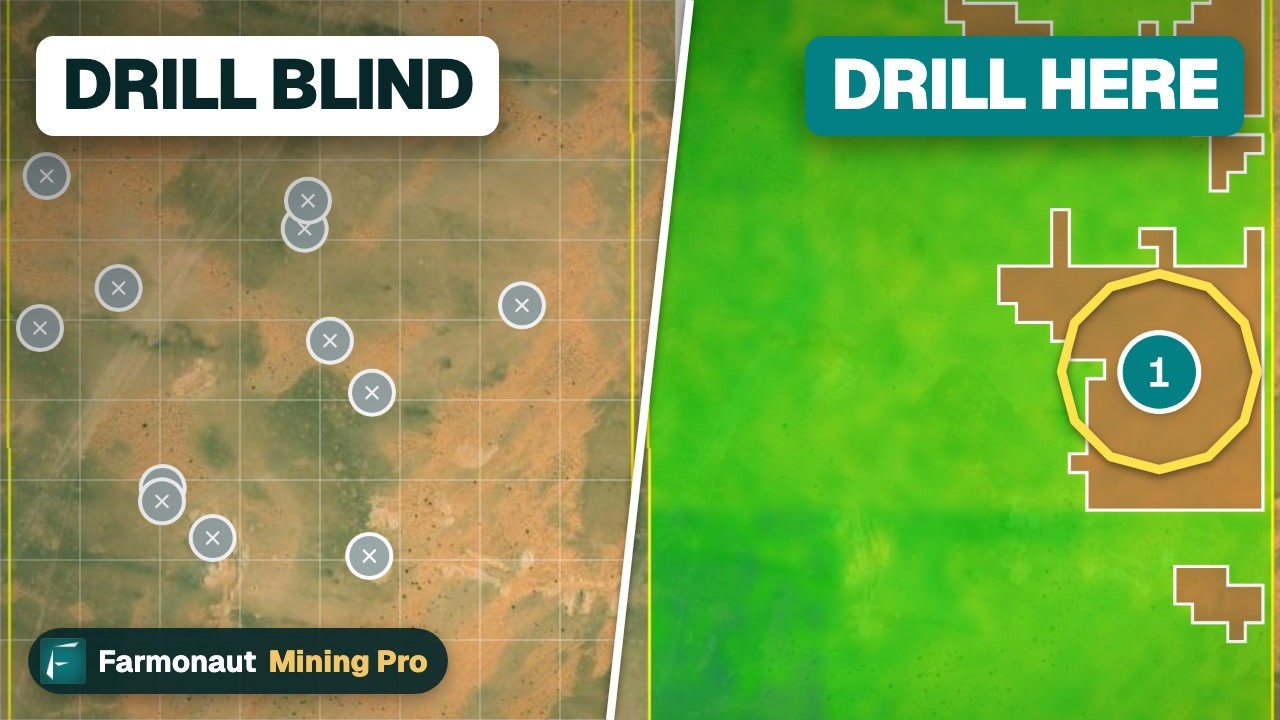
Satellite data helps at the first screening stage. Multispectral and hyperspectral images show surface alteration, iron staining, clay minerals and fractures over large areas, so a team can rank parts of a licence before sending crews. Satellites cannot measure lithium or cobalt grade under the ground. Any satellite result is an exploration target that has to be confirmed by sampling and drilling. One example is our 300-hectare lithium exploration case study in Nigeria. Farmonaut’s mineral detection reports start from a KML, KMZ or polygon of your area and are delivered in 5 to 20 business days; they are exploration-stage targets, not a JORC or NI 43-101 resource estimate. When a project moves on, the next step is a resource model, covered in our note on ore reserve estimation methods.

▶ Explains what AI in mineral exploration really does, where it fails and how to check a claim. · 4:37
What a consultant should check before chasing a battery metal project
- Product form. Spodumene concentrate, lithium carbonate, cobalt hydroxide and nickel sulphate are different products with different buyers and prices. Check which one the project would sell.
- Path to a cathode or anode plant. Ask where the product would be refined and whether that country restricts exports or taxes them.
- Chemistry exposure. A project that depends on cobalt-heavy cathodes faces more risk than one that serves both NMC and LFP makers.
- By-product economics. Cobalt follows copper and nickel output. Its supply does not respond quickly to cobalt prices alone.
- Quota and royalty rules. The DRC quota and prepaid royalty show how fast terms can change.
- Grade and reserve category. Compare grades in the same unit (Li2O or lithium, nickel or nickel equivalent) and check whether figures are reserves or resources.
- Water, tailings and community terms. These often decide the permit timeline.
- Source quality. Prefer company filings, geological surveys and the IEA over promotional pages.
We cover a connected topic in Cobalt Demand for EV Batteries: Chemistry and Outlook.
For a closer look at a related question, see our guide: Cobalt Mining for Electric Cars: Who Mines It and Where.
Frequently asked questions
What are the main EV battery metals?
Lithium, nickel, cobalt, graphite and manganese. Lithium is in every lithium-ion cell. Nickel, cobalt and manganese appear in NMC cathodes, while LFP cells use iron and phosphate and contain no cobalt (IEA, 2026).
Which country mines the most lithium?
Australia, with an estimated 92,000 t of contained lithium in 2025, about 32% of the world total of 290,000 t. China (62,000 t) and Chile (56,000 t) follow (USGS, 2026).
Which country produces most of the world’s cobalt?
The DRC. The USGS estimates 230,000 t of 310,000 t in 2025, and the Cobalt Institute puts its share of mined supply at 73%.
How much lithium and nickel is in one electric car?
For an average 300-mile model-year 2023 NMC-811 car, the ICCT calculates about 10 kg of lithium and 68 kg of nickel in the cathode, plus 8 kg each of manganese and cobalt. LFP cars carry no cobalt.
Do all EV batteries use cobalt?
No. LFP batteries contain no cobalt and made up over 55% of EV batteries deployed worldwide in 2025 (IEA). Cobalt use in EVs still grew 25% that year because overall battery volume rose.
Is there enough lithium for electric cars?
The IEA says reserves of about 37 million tonnes are roughly two and a half times the lithium demand projected for 2026 to 2040 even in its most demanding scenario. The challenge is how fast mines and refineries can be built, not the amount in the ground.
Why is graphite a supply-chain risk?
China mines about 78% of natural graphite and makes over 90% of the anode material used in electric car batteries (USGS and IEA). China announced export controls on graphite anode materials in October 2025.
Why did cobalt prices jump?
The DRC banned exports in February 2025 and then set export quotas. The Cobalt Institute reports hydroxide prices up over 300% during 2025 and metal up 130%.
Can recycling replace new mines?
Not soon. The IEA expects recycling to meet 10% to 20% of lithium and nickel demand and over 30% of cobalt demand by 2050 in its Stated Policies Scenario, so new mines remain needed.
Can satellites find lithium, nickel or cobalt deposits?
They can help screen a large area for alteration, rock types and structures that point to a target. They cannot measure underground grade, so every target still needs sampling and drilling.
Who are the biggest cobalt miners?
In the DRC, CMOC, Glencore and Eurasian Resources Group together produced over 57% of the world’s cobalt in 2025, and CMOC’s Kisanfu mine is the largest single asset (Cobalt Institute, 2026).
This page is for information only. It is not investment advice. Production figures are USGS estimates and change when revised; confirm current prices and quotas with the regulator or price reporting agency.
Farmonaut mining
Map your mining site from space
Send a KML, KMZ or polygon and Farmonaut screens the area from satellite images for exploration targets before ground crews go in.

Mining Pro sample view, synthetic data
Keep reading
Sources
- USGS, Mineral Commodity Summaries 2026: Lithium (2026): pubs.usgs.gov
- USGS, Mineral Commodity Summaries 2026: Cobalt (2026): pubs.usgs.gov
- USGS, Mineral Commodity Summaries 2026: Nickel (2026): pubs.usgs.gov
- USGS, Mineral Commodity Summaries 2026: Graphite (2026): pubs.usgs.gov
- USGS, Mineral Commodity Summaries 2026: Manganese (2026): pubs.usgs.gov
- IEA, Global EV Outlook 2026: iea.blob.core.windows.net
- IEA, Global Critical Minerals Outlook 2026, executive summary: iea.org
- Cobalt Institute, Cobalt Market Report 2025 (May 2026): cobaltinstitute.org
- ICCT, EV supply chain and Inflation Reduction Act report (2024): theicct.org
- IISD, Commodity profile: lithium (2026): iisd.org
- Albemarle, Greenbushes technical report summary (SEC, FY2025 10-K): sec.gov
Discussion
Questions, corrections or field experience? Share them below. First-time comments are reviewed before they appear, and your email is never published.
No comments yet. Be the first to add a question or your experience.

 Mine4Africa
 Lithspo Minerals Limited
 Tintina Mining Group
 Dalgety Minerals Pty Ltd
 Vortex Minerals Pty Ltd
 Faith At Work (Pty) Ltd
 Geotech Mining Solutions plc
 Vulcan International Limited
 Kidepo Associates
 GKY Mining
 Alkimy SARL
 Double A Trading
 GemSprout Metals Limited
 Qader Group
 Ileys General Trading
 SG Gold Mining LLC
 VRV Global Pte Ltd
 Omsri International FZE
 G.I.T.T.
 Jaunita Erss Ltd
 Almosi SARL
 SRK Consulting
 Berks Gold Limited
 Mwerezi Minerals Company Limited

 Exploration consultancy · South Africa · Gold










