

Uranium · Country and deposit guide
Largest Uranium Deposits in the World by Country
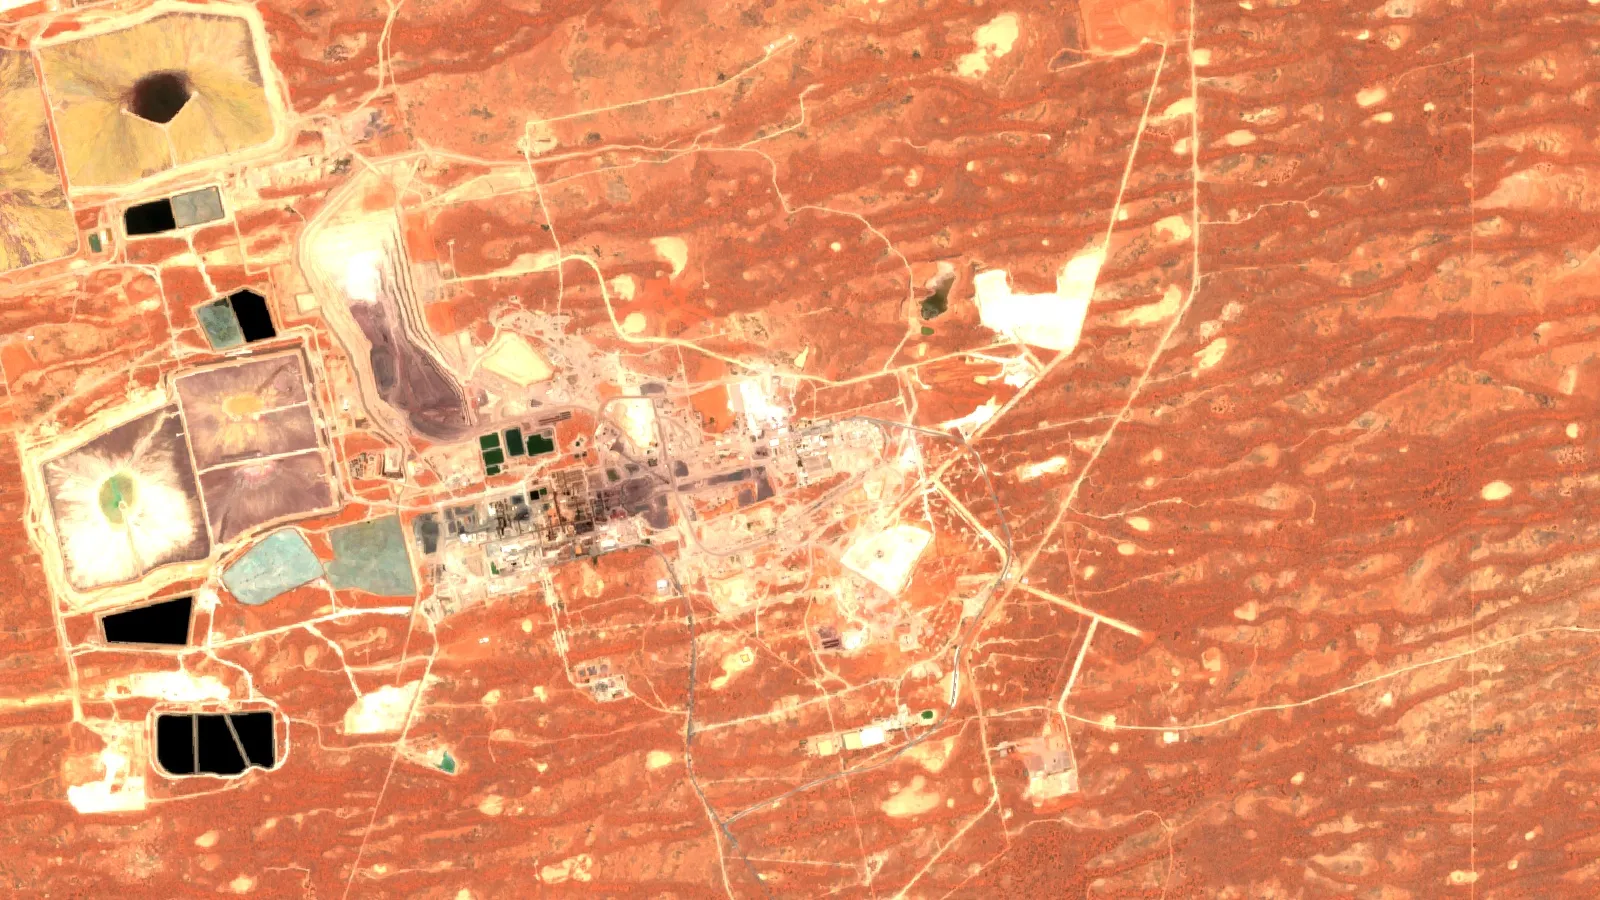
Australia holds the most uranium (29% of identified resources) and Olympic Dam is the largest single deposit, but Kazakhstan mines the most and Canada has the richest ore.
Key takeaways
- Australia has 1,701,600 tU, or 29% of identified resources up to US$130/kg U, at 1 January 2025 (Red Book 2026, via World Nuclear Association).
- Olympic Dam is the largest known deposit, at about 2.08 million tonnes U3O8 in total resources (30 June 2020), and is mined mainly for copper.
- Kazakhstan mined 39% of world uranium in 2024 from 14% of resources, mostly by in situ leaching.
- Cigar Lake reserves grade 16.33% U3O8 at end 2025 (Cameco), against about 0.03% at Inkai.
- Older figures for Niger are out of date: COMINAK closed in 2021 and SOMAÏR was nationalised after the 2023 coup.
In this article
- Largest uranium deposits in the world by country: the table
- Which country has the largest uranium reserves, and what "reserves" means here
- The biggest uranium deposits in the world, deposit by deposit
- Australia: Olympic Dam and why a low grade still works
- Kazakhstan: the top producer, in soft sandstone
- Canada: where the highest-grade uranium is found
- Russia: large but mostly undeveloped
- Namibia, Niger and uranium in Africa
- Uzbekistan and the United States
- Top uranium producing regions compared with where the uranium is
- Why high-grade uranium deposits and low-grade ones both pay
- Compare any uranium deposit: tonnes, pounds and gross value
- What to check before relying on a uranium tonnage figure
- Frequently asked questions
Australia holds the largest uranium deposits in the world by country, with 1.70 million tonnes of uranium (tU), or 29% of the world total, in the Red Book figures for 1 January 2025 at costs up to US$130 per kg. The largest single deposit is Olympic Dam in South Australia. Kazakhstan (14%) and Canada (9%) follow, but they mine far more than Australia does.
That gap between what lies in the ground and what reaches the market is the main point of this page. Below you will find a country table, the flagship deposit in each country with its reported tonnage and grade, the status of each project, and a calculator that puts any deposit on the same basis. If you want locations rather than sizes, our map of uranium deposits in the world covers the geography.
Largest uranium deposits in the world by country: the table
Resources here are identified recoverable resources, which means reasonably assured plus inferred tonnage that could be recovered at up to US$130/kg U. Output is 2024 mine production from the World Nuclear Association production table. The world totals were 5,864,500 tU of resources and about 60,200 tU mined.
| Country | Resources (tU) | World share | Mined 2024 (tU) | Flagship deposit |
|---|---|---|---|---|
| Australia | 1,701,600 | 29% | 4,598 | Olympic Dam |
| Kazakhstan | 827,500 | 14% | 23,270 | Inkai, Budenovskoye |
| Canada | 551,700 | 9% | 14,309 | McArthur River, Cigar Lake, Arrow |
| Russia | 471,700 | 8% | 2,738 | Elkon, Streltsovskiy district |
| Namibia | 392,800 | 7% | 7,333 | Husab, Rössing |
| Niger | 351,100 | 6% | 962 | Imouraren, Arlit |
| China | 325,400 | 6% | 1,600 (est.) | None listed here |
| South Africa | 320,900 | 5% | 200 (est.) | Witwatersrand gold by-product |
Two more producers are worth a note. Uzbekistan mined an estimated 4,000 tU in 2024 and reports 91,500 tU of recoverable resources to US$130/kg. The United States mined 260 tU in 2024 and ranks 14th for known resources, with 67,800 tU of reasonably assured resources (2023), about 1% of the world total.
Which country has the largest uranium reserves, and what “reserves” means here
Search results often use reserves, resources and deposits as if they were the same. They are not, and the difference can change a ranking.
Chart
Identified uranium resources by country
Thousand tonnes U recoverable at up to US$130/kg U, 1 January 2025
- Mineral resource: a known concentration with reasonable prospects of eventual economic extraction. It is split by geological confidence into inferred, indicated and measured.
- Ore reserve: the part of a measured or indicated resource that studies show can be mined at a profit.
- Recoverable resource: the national measure used in the Red Book. It allows for mining and processing losses and is tied to a cost ceiling.
The cost ceiling matters. At up to US$260/kg U the world figure rises to more than 8.1 million tU, up 2.1% from the previous edition. So “Australia has 29%” is true of one cost class on one date. A claim that does not name its class is hard to check.
The Red Book, published by the OECD Nuclear Energy Agency and the IAEA, is the only government-sponsored publication tracking these trends. That is why this page uses it for the national figures and company filings for individual deposits.
The biggest uranium deposits in the world, deposit by deposit
No public list ranks every deposit on one basis. Companies report at different dates and in different categories, and some state-held tonnage is not published. So we chose by a simple rule: the deposits with the largest uranium figures in filings and in World Nuclear Association tables, which draw on the Red Book, with the basis shown beside each one. Figures reported in U3O8 (uranium oxide, the form uranium is sold in) are converted at 0.848 tU per tonne of U3O8. Treat the order as a guide rather than a strict league table.
Chart
Selected uranium deposits: size against grade
Horizontal: thousand tU, log scale. Vertical: % U. Bases differ as shown in the table.
| Deposit | Country | Uranium (tU) | Basis and date | Grade | Status |
|---|---|---|---|---|---|
| Olympic Dam | Australia | about 1,764,000 | Total resources, 30 June 2020 | 0.021% U3O8 | Operating, copper by-product |
| Elkon | Russia | 303,000 | Red Book 2026 | 0.15% U | Undeveloped |
| Imouraren | Niger | about 200,000 | Reserves 171,426 tU plus resources 28,843 tU, added; may overlap (Red Book 2026) | 0.07-0.08% U | Permit revoked |
| Husab | Namibia | 183,870 | Measured, indicated and inferred | 0.04-0.048% U | Operating |
| McArthur River | Canada | about 133,000 | Reserves, 31 Dec 2025 | 6.48% U3O8 | Operating |
| Arrow (Rook I) | Canada | 129,750 | Measured, indicated and inferred | 3.7% U measured | Licensed for construction |
| Budenovskoye | Kazakhstan | about 111,000 | Resources, sites 1-4, mid-2013 | Not shown here | Operating |
| Inkai (sites 1-3) | Kazakhstan | about 93,000 | Reserves, 31 Dec 2025 | 0.03% U3O8 | Operating |
| Cigar Lake | Canada | about 66,000 | Reserves, 31 Dec 2025 | 16.33% U3O8 | Operating |
| Dasa | Niger | 61,810 | Indicated and inferred, May 2023 | 0.42-0.45% U | In development |
Reserves are a stricter test than resources, so the Canadian and Inkai rows understate the total mineralised tonnage compared with the rows that report resources. Sources: Olympic Dam, Elkon, Imouraren and Dasa, Husab, Arrow, Budenovskoye and Cameco’s 2025 Annual Information Form for McArthur River, Cigar Lake and Inkai.
Australia: Olympic Dam and why a low grade still works
The World Nuclear Association calls Olympic Dam the world’s largest deposit of uranium. It lists total resources of about 2.08 million tonnes of U3O8 in 10,070 million tonnes of ore at 30 June 2020, with reserves of about 261,700 tonnes U3O8 included in that total. Grade is only about 0.021% U3O8 across the resource.
It can work at that grade because copper is a co-product, with reserves at 1.88% copper, and gold and silver are recovered too. The mine is operated by BHP and is underground. It produced 2,693 tU in 2024, about 5% of world output.
Notice that Olympic Dam’s 1.76 million tU of contained uranium is larger than Australia’s 1.70 million tU national recoverable figure. These are different measures: one is metal in the ground, the other allows for losses and a cost ceiling. The quoted recovery from Olympic Dam reserves is 68%, partly because some of the uranium sits in a mineral that dissolves poorly in acid. Australia’s resources are concentrated in five deposits: Olympic Dam, Ranger, Jabiluka, Kintyre and Yeelirrie.
Kazakhstan: the top producer, in soft sandstone
Kazakhstan has been the leading producer since 2009 and mined about 25,839 tU in 2025, about 40% of the world total. It holds 14% of resources. The deposits are roll-front sandstone bodies, mainly in the Chu-Sarysu and Syrdarya basins. The Chu-Sarysu district alone has more than half of the country’s known resources.
Almost all of this is mined by in situ leaching (ISL), where a solution is pumped through wells to dissolve uranium underground and bring it to the surface, with no pit or shaft. It suits permeable sandstone between impermeable layers, which is how a grade of 0.03% can pay. You can compare it with the leaching used for other metals in our guide to in situ and heap leaching. ISL now accounts for about 55% of world mine output.
Inkai is 60% Kazatomprom and 40% Cameco. Karatau, on Budenovskoye 2, was the largest ISL producer in 2024 at 3,299 tU.
Canada: where the highest-grade uranium is found
Northern Saskatchewan’s Athabasca Basin holds the richest uranium deposits known. Cameco describes Cigar Lake as the world’s highest-grade uranium mine, with reserves at 16.33% U3O8. That compares with about 0.03% at Inkai. These are unconformity deposits, formed where old basement rock meets younger sandstone, and some ore runs around 20% uranium.
McArthur River with Key Lake was the world’s largest producer in 2024 at 7,808 tU, followed by Cigar Lake at 6,501 tU. Cameco owns 69.8% of McArthur River and about 57.4% of Cigar Lake, with Orano the other partner in both. Natural Resources Canada says Canada produced 14.3 kilotonnes in 2024, or 24% of the world total.
Two new projects will change this picture if they go ahead as planned:
- Rook I (Arrow deposit), NexGen Energy: the regulator issued a site preparation and construction licence on 4 March 2026. It does not authorise operation, which needs a later hearing and decision.
- Phoenix (Wheeler River), Denison Mines: licensed in February 2026, with first production targeted by mid-2028. Indicated resources are 27,000 tU at 16.22% U. The ISL plan uses a first-of-a-kind freeze wall to contain the leach solution.
Russia: large but mostly undeveloped
Russia has 471,686 tU to US$130/kg and mined 2,738 tU in 2024. Output is centred on the Priargunsky operation (PIMCU) in the Streltsovskiy district of Zabaykalsky Krai, with 71,800 tU of recoverable resources at 0.16% U.
The biggest tonnage is at Elkon in Yakutia, which holds the largest reserves in the country but remains undeveloped. Rosatom has said it plans to bring the project out of hibernation, with a concept of about 5,000 tU per year by 2036. Khiagda and Dalur are smaller ISL operations.
Namibia, Niger and uranium in Africa
Namibia mined 7,333 tU in 2024, third in the world, at very low grades. Husab (Swakop Uranium, majority-owned by Chinese interests with 10% held by Namibia’s state company Epangelo) produced 4,437 tU in 2024, the third-largest mine in the world by output. Rössing, majority-owned by China National Uranium Corporation, produced 2,205 tU. Both are large open pits in hard alaskite rock. Langer Heinrich and the Tumas project are calcrete or palaeochannel deposits, formed in old river valleys.
Niger’s story has changed sharply and many older articles are out of date. The COMINAK mine at Akouta closed in 2021. After the July 2023 coup, the authorities revoked Orano’s permits at Imouraren and Arlit, and nationalised SOMAÏR. In May 2026 the Council of Ministers adopted draft decrees to annul the Arlit concession and create a new state company. Output fell to 962 tU in 2024. Global Atomic’s Dasa project targets first production in the second half of 2028, subject to financing.
Elsewhere, the Red Book gives Tanzania 72,200 tU in situ, and Mkuju River is its main project. Our guide to African uranium mines covers the continent in more depth.

▶ A short explainer on whether Zimbabwe has uranium and what is known about Kanyemba. · 4:27
Uzbekistan and the United States
All significant Uzbek sandstone resources lie in the Central Kyzylkum belt. State company Navoiyuran announced JORC-reported reserves of 96,600 tU and resources of 53,900 tU in April 2026. A 2022 resolution set a goal of raising output from 3,500 tU to 7,100 tU by 2030, and in March 2026 the president raised the 2030 target to 15,000 tonnes.
US deposits are many but small. Examples include Crow Butte in Nebraska (5,800 tU at 0.22% U), Reno Creek in Wyoming and the high-grade Pinyon Plain breccia pipe in Arizona. At about 1% of the world total, the US is a minor holder. Output is growing from a low base: mines produced 534 tU in 2025, more than double 2024 and the highest in nine years. Cameco’s Smith Ranch-Highland and Crow Butte have had no commercial production since 2018. Readers who want the state detail can start with uranium mining in Utah.
Top uranium producing regions compared with where the uranium is
Three countries produce about three-quarters of the world’s mined uranium: Kazakhstan, Canada and Namibia. Australia has twice Kazakhstan’s resources but about a fifth of its output. Policy, deposit type and by-product economics explain much of this: Olympic Dam’s uranium output depends on copper plans, and Russia’s and Niger’s largest tonnage has not been developed.
Chart
Largest uranium mines by 2024 output
Tonnes U mined, 2024
Chart
Share of world resources against share of mine output
Percent. Resources at 1 January 2025 up to US$130/kg U; output in 2024
The ten largest mines produced 62% of world output in 2024. Production is more concentrated than resources, and a single mine can move the market. Canada’s output fell from 14,039 tU in 2016 to 3,885 tU in 2020 during mine suspensions and returned to 14,309 tU in 2024.
Why high-grade uranium deposits and low-grade ones both pay
Grade tells you how much uranium is in each tonne of rock, and it is usually given as a percentage. It does not decide value alone. Four things do the work:
- Mining method: ISL avoids moving rock, so a 0.03% deposit can compete. Inkai’s reserve-life operating cost is estimated at C$12.94 per pound, on Cameco’s basis in its 2025 filing.
- By-products: copper carries Olympic Dam.
- Ground conditions: Cigar Lake needs ground freezing and remote jet boring at about 480 metres, because its orebody sits in soft sandstone.
- Time and permits: typical lead times of 15-20 years mean a large deposit may not produce for a generation.
The main deposit families are described by the World Nuclear Association: unconformity (Athabasca), sandstone (Kazakhstan, Uzbekistan, Niger, US), breccia complex (Olympic Dam), intrusive (Rössing, Husab), volcanic (Streltsovskiy) and surficial or calcrete (Yeelirrie, Langer Heinrich). See types of ore deposits for how these compare with other metals.
▶ A plain-language explainer of remote sensing for mining. · 2:01
Compare any uranium deposit: tonnes, pounds and gross value
Consultants often receive figures in mixed units. Use the calculator below to turn ore tonnes and grade into contained tU and pounds of U3O8, so a project can sit beside the table above. Uranium has no open exchange: Cameco’s published industry averages, based on UxC and TradeTech month-end prices, were US$91.55/lb U3O8 spot and US$98.00/lb long-term at 30 October 2026. Most uranium is sold under private contracts, so check both.
Calculator
How much uranium is in this deposit?
Enter your own ore tonnage, grade, recovery and price.
- Contained U3O8 (million lb): 22.0
- Recoverable U3O8 (million lb): 18.7
- Gross value at your price (US$ million): $1,687
Example values only, not a benchmark or forecast. Constants: 0.848 tU per tonne U3O8 and 2,204.62 lb per tonne. Price is an input: example, use today’s price. Result is gross value in US$, before costs, royalties and payability; it is not a resource estimate.
What to check before relying on a uranium tonnage figure
- Unit: tU, tonnes U3O8 or million pounds U3O8? One tonne of U3O8 holds 0.848 tU, and one million pounds U3O8 holds about 385 tU.
- Category: reserves, measured, indicated or inferred? Check if resources include reserves. Olympic Dam’s do.
- Share: 100% basis or a company’s attributable share? Cameco’s filing shows both.
- Date and cost class: the national figures here are for 1 January 2025 at up to US$130/kg U.
- Legal status: a permit can be withdrawn, as in Niger. Confirm with the regulator.
- Recovery: contained is not recoverable. Olympic Dam’s quoted recovery is 68%.
Screening satellite imagery can help a consultant review a licence area before field work by mapping surface alteration, structure and access. Farmonaut’s satellite-based mineral detection gives exploration targets, ahead of any resource estimate rather than in place of one. To discuss a specific area, use the mining query form or contact us.
▶ A claymation on the seven environmental impacts of mining. · 2:31
Frequently asked questions
Who has the largest uranium deposits in the world?
Australia, with 1,701,600 tU or 29% of identified recoverable resources up to US$130/kg U at 1 January 2025. Kazakhstan is second with 14% and Canada third with 9%.
What is the largest uranium deposit in the world?
Olympic Dam in South Australia, with total resources of about 2.08 million tonnes of U3O8 (about 1.76 million tU) at 30 June 2020. It is mined mainly for copper.
Which country has the largest uranium reserves?
Australia on the Red Book resource measure. The Red Book reports recoverable resources by cost class rather than company-style ore reserves, so check the basis of any “reserves” ranking.
Where is uranium mostly found?
About 29% of identified resources are in Australia, 14% in Kazakhstan, 9% in Canada, 8% in Russia, 7% in Namibia and 6% each in Niger and China. It occurs in small amounts in most rocks, but economic concentrations are far rarer.
Which region has better uranium deposits?
It depends on the measure. Canada’s Athabasca Basin has the highest grades, Kazakhstan’s basins have the largest output, by ISL, and South Australia has the largest single tonnage.
Where are the world’s high-grade uranium deposits?
Mainly in Saskatchewan. Cigar Lake reserves grade 16.33% U3O8 and McArthur River 6.48% U3O8, at end 2025. Phoenix, in the same basin, has indicated resources at 16.22% U.
Which country produces the most uranium?
Kazakhstan, with 23,270 tU in 2024 (39% of world supply) and about 25,839 tU in 2025.
What are the top uranium producing regions in the world?
The Chu-Sarysu and Syrdarya basins in Kazakhstan, the Athabasca Basin in Canada, the Erongo region’s Namib Desert in Namibia, and South Australia.
How much uranium is left in the world?
More than 8.1 million tU of identified resources were recoverable below US$260/kg U at 1 January 2025. The Red Book says this is enough for its highest demand scenario to 2050, but that investment is needed to turn it into supply.
Does the United States have large uranium deposits?
Not by world standards. The US has about 1% of known resources at up to US$130/kg U, in many small deposits across Wyoming, Texas, Nebraska, New Mexico and Arizona.
Can a satellite detect uranium directly?
No satellite measures buried uranium directly. Imagery can show surface clues such as alteration and structure, which help rank ground for follow-up. Drilling and assays are still needed to establish a deposit.
This page is for information only. It is not investment advice or legal advice. Confirm licence and permit rules with the regulator. Uranium is radioactive: do not prospect or sample without permission, a licence and radiation-safety training.
Farmonaut mining
Map your mining site from space
Consultants can screen a licence boundary for surface clues and get exploration targets, ahead of any resource estimate.
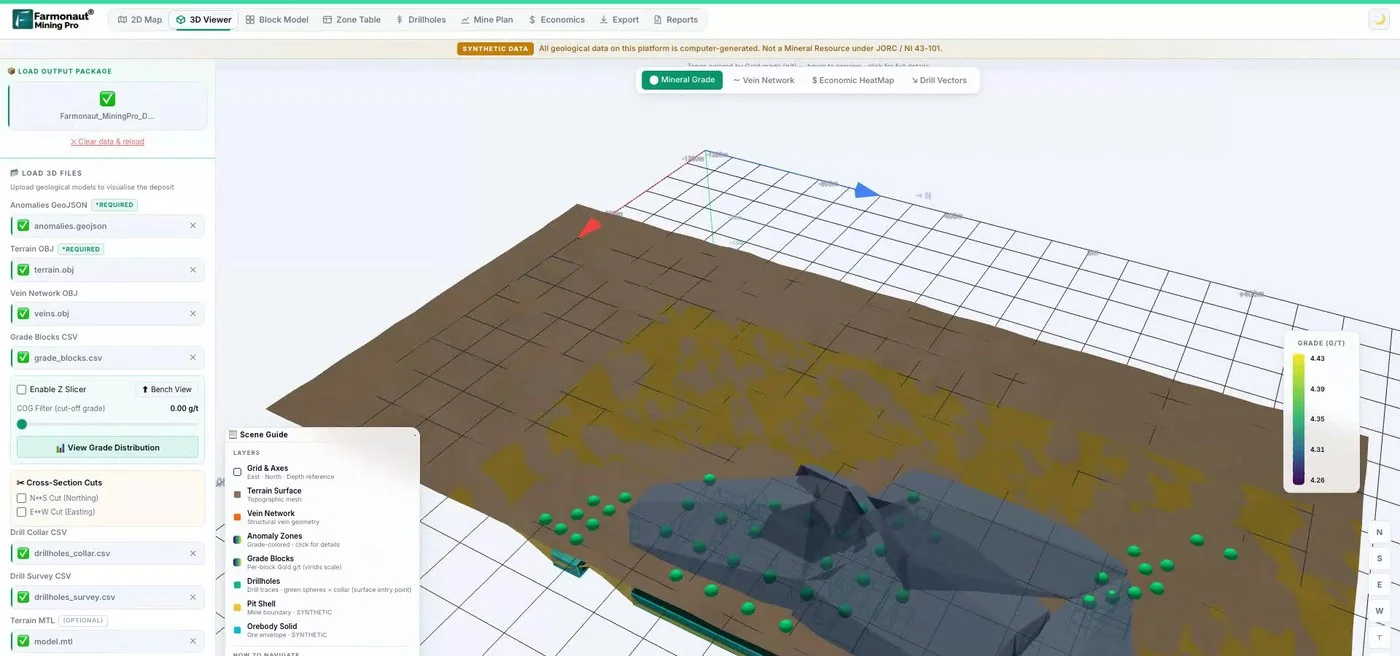
Mining Pro sample view, synthetic data
Keep reading
Sources
- World Nuclear Association, Supply of Uranium (Sept 2026): world-nuclear.org
- World Nuclear Association, World Uranium Mining Production (Oct 2026): world-nuclear.org
- World Nuclear Association, Geology of Uranium Deposits: world-nuclear.org
- World Nuclear Association, Australia’s Uranium Mines: world-nuclear.org
- World Nuclear Association, Australia’s Uranium: world-nuclear.org
- World Nuclear Association, Uranium in Canada: world-nuclear.org
- World Nuclear Association, Uranium and Nuclear Power in Kazakhstan: world-nuclear.org
- World Nuclear Association, Uranium in Namibia: world-nuclear.org
- World Nuclear Association, Uranium in Niger: world-nuclear.org
- World Nuclear Association, Russia’s Nuclear Fuel Cycle: world-nuclear.org
- World Nuclear Association, Uzbekistan: world-nuclear.org
- World Nuclear Association, US Nuclear Fuel Cycle: world-nuclear.org
- World Nuclear Association, US Uranium Mining: world-nuclear.org
- World Nuclear Association, Uranium in Africa: world-nuclear.org
- Cameco, 2025 Annual Information Form: cameco.com
- Cameco, Uranium Price (30 Oct 2026): cameco.com
- Canadian Nuclear Safety Commission, Rook I: cnsc-ccsn.gc.ca
- World Nuclear News, Red Book confident on uranium resources (Sept 2026): world-nuclear-news.org
- American Nuclear Society, Newest Red Book (Sept 2026): ans.org
- Natural Resources Canada, Uranium and nuclear power facts: natural-resources.canada.ca
- World Nuclear News, US uranium production up again: world-nuclear-news.org
Discussion
Questions, corrections or field experience? Share them below. First-time comments are reviewed before they appear, and your email is never published.
No comments yet. Be the first to add a question or your experience.

 Energy and Resources Ltd
 Mwerezi Minerals Company Limited
 Congo Mining Solutions
 Mining SARL
 SenGold Invest SAS
 Sania Corporation
 Sean Mining Limited
 NTS Group (Pty) Ltd
 Mine4Africa
 Lithspo Minerals Limited
 Tintina Mining Group
 Dalgety Minerals Pty Ltd
 Vortex Minerals Pty Ltd
 Faith At Work (Pty) Ltd
 Geotech Mining Solutions plc
 Vulcan International Limited
 Kidepo Associates
 GKY Mining
 Alkimy SARL

 Licence holder · Nigeria · Gold + lithium
 Client · Somalia · Gold










