

Rare earth prices · Chart and drivers
Rare Earth Metals Prices: Chart and Drivers
Ex-China NdPr oxide was assessed at $95,000 a tonne in August 2026, below the $110 per kilogram US floor, while ex-China terbium oxide reached $5,000 to $8,000 per kilogram on 1 October 2026. Dated quotes, four charts and a revenue calculator.
Key takeaways
- Ex-China NdPr oxide fell 7.3% between 6 and 20 August 2026 to $95,000 per tonne, under the $110 per kilogram floor that Benchmark says applies to MP Materials and Lynas (Benchmark Minerals, 21 August 2026).
- Trading Economics showed its neodymium benchmark at CNY 947,500 per tonne on 15 October 2026, 30.69% above a year earlier and under the February 2022 high of CNY 1,520,000.
- Ex-China terbium oxide rose 41% in a week to $5,000-$8,000 per kilogram and dysprosium oxide to $2,500-$3,500 on 1 October 2026 (Fastmarkets).
- USGS yearly averages show NdPr oxide at $124 per kilogram in 2022 and an estimated $69 in 2025; lanthanum oxide averaged about $1 (USGS, 2026).
- Lynas reported a record average selling price of A$98.2 per kilogram across its products in the June 2026 quarter (ASX report, July 2026).
In this article
- Rare earth price chart: dated quotes by oxide
- NdPr oxide price history in five annual averages
- Why China and ex-China prices have split
- Heavy rare earths: dysprosium, terbium and yttrium
- Light rare earths: lanthanum and cerium stay cheap
- What moves rare earth prices
- Recycling and substitution as price hedges
- How to read a rare earth price chart
- What producers actually receive
- Estimate oxide revenue at your own prices
- Who should watch these charts
- Where to find current quotes
- Frequently asked questions
The latest dated quotes show two different markets. Outside China, neodymium-praseodymium (NdPr) oxide, the main magnet material, was assessed at $95,000 per tonne in August 2026, about 14% under the $110 per kilogram US price floor (Benchmark Minerals). The heavy elements dysprosium and terbium, which are added to magnets for heat resistance, are far dearer: ex-China terbium oxide was assessed at $5,000 to $8,000 per kilogram on 1 October 2026 (Fastmarkets). This page puts those dated numbers in one table, charts them against the long-run averages, and shows how to read any rare earth price chart you find.
Prices on this page are examples of what was reported on the dates given. They change weekly and are not a quote. Always check the date and the basis (where the metal is delivered and in which form) before you compare two numbers.
Rare earth price chart: dated quotes by oxide
Rare earth elements are 17 metals that are usually sold as oxides, which are powders of the element combined with oxygen. They are quoted in dollars or yuan per kilogram or per tonne. The table below lists the most-searched materials with the date, the basis and the publisher. For a plain definition of each element, see our guide to the rare earth metal definition and the top critical minerals.
| Material | Reported price | Basis | Date | Source |
|---|---|---|---|---|
| NdPr oxide, outside China | $95,000 per tonne ($95 per kg) | CIF Europe and North America (cost, insurance and freight paid) | 20 Aug 2026 | Benchmark Minerals |
| PrNd oxide, inside China | RMB 721,500 per tonne ($107,504 per Benchmark) | China domestic assessment | 6-20 Aug 2026 window | Benchmark Minerals |
| Neodymium benchmark | CNY 947,500 per tonne | Contract-for-difference benchmark; grade not stated on the page | 15 Oct 2026 | Trading Economics |
| Dysprosium oxide 99.5% | $2,500 to $3,500 per kg | CIP global (carriage and insurance paid), outside China | 1 Oct 2026 | Fastmarkets |
| Terbium oxide 99.99% | $5,000 to $8,000 per kg | CIP global, outside China | 1 Oct 2026 | Fastmarkets |
| Yttrium oxide | About $1,100 per kg | Outside China, Argus data as cited by Reuters | May 2026 | The Oregon Group |
Two points about the neodymium line. Trading Economics reported the benchmark flat on the day, 0.26% lower over a month and 30.69% higher over a year, with an all-time high of CNY 1,520,000 per tonne in February 2022. The page does not say whether it tracks metal or oxide, so use it for direction rather than for a purchase price. At the USD/CNY rate Trading Economics showed on the same page (about 6.69), CNY 947,500 is roughly $141,600 per tonne, which is a different product from the $95,000 NdPr oxide quote above.
Yttrium has its own page in our series: see yttrium metal prices and the trends behind them.
NdPr oxide price history in five annual averages
The US Geological Survey (USGS) publishes yearly average prices for the main oxides, taken from Argus Media, on an FOB (price at the port of loading, before sea freight) basis. The series shows how far NdPr fell from its 2022 peak. The average NdPr oxide price was $124 per kilogram in 2022, $75 in 2023, $55 in 2024 and an estimated $69 in 2025 (USGS Mineral Commodity Summaries 2026). Neodymium oxide alone followed the same path, from $134 in 2022 to $56 in 2024 and $73 in 2025.
Chart
Neodymium and NdPr oxide, yearly average
US$ per kilogram, FOB, 2021 to 2025 (2025 estimated)
An annual average hides the swings inside the year, so treat the chart as the level around which spot prices moved. The August 2026 ex-China quote of $95 per kilogram sits above the 2025 average but well below the 2022 peak of $124.
Why China and ex-China prices have split
China mined an estimated 270,000 tonnes of rare earth oxide equivalent (REO) in 2025 out of a world total of about 390,000 tonnes, roughly 69% (USGS, 2026). It also does most of the separation, the chemical step that splits mixed concentrate into individual oxides: Natural Resources Canada puts China’s share of refined rare earth output at 90%, and magnets take the largest share of demand at about 48% (2024). That is why a price for the same oxide can differ by market.
Three rules explain the gap:
- Export controls. In April 2025 China added licence requirements for samarium, gadolinium, terbium, dysprosium, lutetium, scandium and yttrium. It widened the list in October 2025 and suspended that widening for a year in November; the April controls stayed in force, with general licences for selected exporters (USGS, 2026).
- A US price floor. The US Department of Defense (now styled the Department of War) agreed to pay MP Materials the difference between $110 per kilogram and the market price for NdPr products from Mountain Pass, California (MP Materials, fourth quarter 2025 results). Benchmark says the same $110 floor was set for Lynas. Lynas signed a binding letter of intent with the Department of War in March 2026 for a four-year supply deal at that floor; a final contract was still to follow (Mining Weekly, 16 March 2026).
- Where producers sell. Benchmark’s analyst said that ex-China producers prefer to sell to non-Chinese buyers even at a discount, which has built stock outside China while Chinese domestic PrNd stayed at a premium.
For buyers who can reach both markets, the gap is a cost choice. For producers with a floor contract, the spot price matters less than the volume they can sell.
Heavy rare earths: dysprosium, terbium and yttrium
Heavy rare earths are the less abundant members of the group, and they are the ones where prices outside China have jumped. Argus data cited by Reuters shows yttrium oxide outside China up about 140 times since April 2025, and dysprosium and terbium oxide up four to five times, while Chinese exports of the three fell about 50% (The Oregon Group, 10 June 2026).
Chart
Ex-China heavy oxide prices, one week apart
US$ per kilogram, midpoint of the assessed range, CIP global
The move continued into autumn. Fastmarkets assessed terbium oxide at $5,000 to $8,000 per kilogram on 1 October 2026, up 41% from $4,200 to $5,000 a week earlier, and dysprosium oxide at $2,500 to $3,500, up from $1,910 to $2,500. Market participants linked the rise to US buyers securing supply before Pentagon rules that, from January 2027, bar magnets with China-linked materials (Fastmarkets, 6 October 2026). The same report quotes Lynas as saying demand for heavy rare earths outside China is around 400 tonnes a year, so small tonnages move prices.
The USGS annual averages are far lower, because they average the whole year and use a different basis. The 2025 average was $239 per kilogram for dysprosium oxide and $1,010 for terbium oxide (USGS, Rare Earths (Heavy), 2026). Do not mix the two series on one chart without labelling the basis.
Light rare earths: lanthanum and cerium stay cheap
Lanthanum and cerium are the most abundant elements and are used in catalysts, glass and polishing powders. Their oxides averaged $1.00 and $1.71 per kilogram in 2025, against $73 for neodymium oxide and $74 for praseodymium oxide (USGS, 2026). Samarium oxide averaged $2.82, while europium and gadolinium oxides averaged $27 and $30. A mine that produces a mixed concentrate earns most of its revenue from the magnet metals, which is why project studies quote a basket price rather than one oxide.
Chart
Average oxide prices, 2025 estimate
US$ per kilogram, yearly average
For the economics of a single concentrate product, see our guide to monazite and xenotime concentrate price per tonne.
What moves rare earth prices
These are the drivers that the sources above point to, in rough order of weight for the next few quarters:
- Export policy in China. Licence rules decide how much heavy oxide reaches buyers. The suspension of the October 2025 controls ends after one year, which makes the next review a date to watch (USGS, 2026).
- Government price support and procurement. The $110 floor, defence sourcing rules and stockpiling change who buys and at what price.
- Magnet demand. Electric vehicles, wind turbines and defence systems use NdFeB (neodymium-iron-boron) magnets. Fastmarkets notes magnet makers keep cutting dysprosium and terbium use per unit, so demand growth is slower than unit growth.
- New supply outside China. Lynas reported combined dysprosium and terbium output of 19 tonnes in the June 2026 quarter (Lynas quarterly report) and announced on 30 September 2026 that it will acquire Meteoric Resources for A$968 million; Meteoric holds the Caldeira project (Fastmarkets). More separation capacity usually pushes ex-China NdPr down first.
- Stock and inventory. Benchmark links the August fall to a build-up of ex-China material that is chasing limited demand.
- Exchange rates. Chinese prices are quoted in yuan; a move in USD/CNY changes the dollar figure without any change in the market.
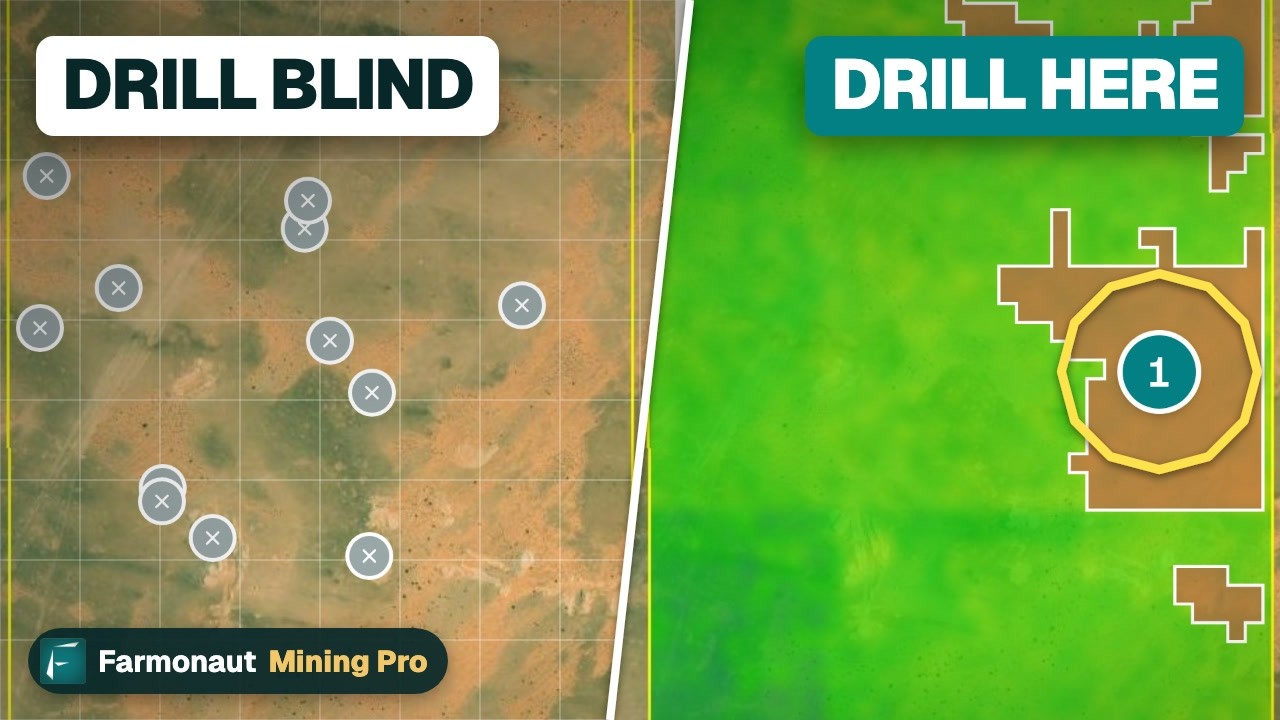
▶ Explains what mining adds to an economy and why energy-transition minerals are in demand. · 5:03
Recycling and substitution as price hedges
Buyers who cannot control the price look for ways to need less of the metal. The USGS says substitutes exist for many rare earth uses but are generally less effective, and that only limited quantities are recovered from batteries, permanent magnets and fluorescent lamps (USGS, 2026). The United States still relied on imports for an estimated 67% of its apparent consumption of rare earth compounds and metals in 2025.
Recycling is receiving public money. In 2025 the Department of War lent $80 million to a recycler in Marion, Indiana, and awarded $5.1 million to another in Houston, Texas, to recover rare earths including terbium and dysprosium (USGS, Rare Earths (Heavy), 2026). Fastmarkets adds that magnet makers keep cutting dysprosium and terbium use per unit. Both routes lower demand for new oxide at the margin, but neither has yet removed the premium for ex-China heavy supply shown in the table above.
How to read a rare earth price chart
Most mistakes come from comparing numbers that are not like for like. Check five things before you trust a line on a chart:
- Oxide or metal. Metal costs more than oxide because it needs another processing step.
- Purity. A 99.99% oxide is dearer than 99.5%.
- Unit. A price of $95,000 per tonne equals $95 per kilogram. Yuan per tonne must be converted at the day’s rate.
- Basis. CIF, CIP and FOB (price at the port of loading, before sea freight) include different freight and insurance costs.
- Assessment or average. A weekly price assessment is a snapshot; a USGS yearly average smooths the year. A range such as $5,000 to $8,000 means the market was wide; a midpoint is a convenience for charting, not an assessed price.
Where a chart plots a single line with no basis printed, treat it as a trend indicator only.
What producers actually receive
Producers rarely sell at a headline spot price. Australian producer Lynas Rare Earths reported an average selling price across all its rare earth products of A$98.2 per kilogram in the June 2026 quarter, a record and 63% above the same quarter a year earlier. It said the rise came from better NdPr prices, more heavy rare earth sales and higher premiums over the market index (Lynas quarterly report, July 2026). The company produced 1,857 tonnes of NdPr in that quarter.
Chart
Lynas average selling price, all products
A$ per kilogram, by quarter
The average blends many products, so it is not an NdPr price. It does show how product mix and contract premiums move a producer’s revenue away from the spot chart. For the operating cost side of Australian projects, see our page on Australia rare earth mining costs.
Estimate oxide revenue at your own prices
Use the calculator below to test what a change in price does to a project or a purchase. Enter your own tonnes and prices, and compare revenue at your price with revenue at the $110 per kilogram floor.
Calculator
What is your oxide revenue at today’s prices?
Enter your own tonnes and prices. Results update as you type.
- NdPr share of revenue: 86.2%
- NdPr revenue at the floor price: $110,000,000
- Floor minus your NdPr price, per year: $10,000,000
Example values only, not forecasts or benchmarks. Prices are inputs: use today’s quote and state the basis. The $110 per kilogram floor is the NdPr price in the US Department of Defense agreement with MP Materials reported by MP Materials and Benchmark; edit it if your contract differs. Tonnes are oxide, money is in US$, and 1 tonne = 1,000 kg.
Who should watch these charts
Mining investors and analysts use the NdPr line to judge project economics, because capital cost, separation cost and recovery are fixed in the study while the price is not. Project developers compare the ex-China price with the cost to produce, and a price below cost means either a floor contract or a delayed build. Procurement teams at magnet and motor makers watch the heavy oxide lines, where supply risk is higher. Exploration teams follow the same charts to decide which targets are worth drilling; a project with heavy rare earths can carry a higher value per tonne of ore than one with only light elements.
A satellite screen cannot read grade, but it can narrow the search for alteration and structure before drilling. If you hold a licence and want targets ranked before a field programme, see our satellite mineral detection service. For a map of where the elements occur, see our rare earth elements map. To discuss a project, use the mining query form or contact us.
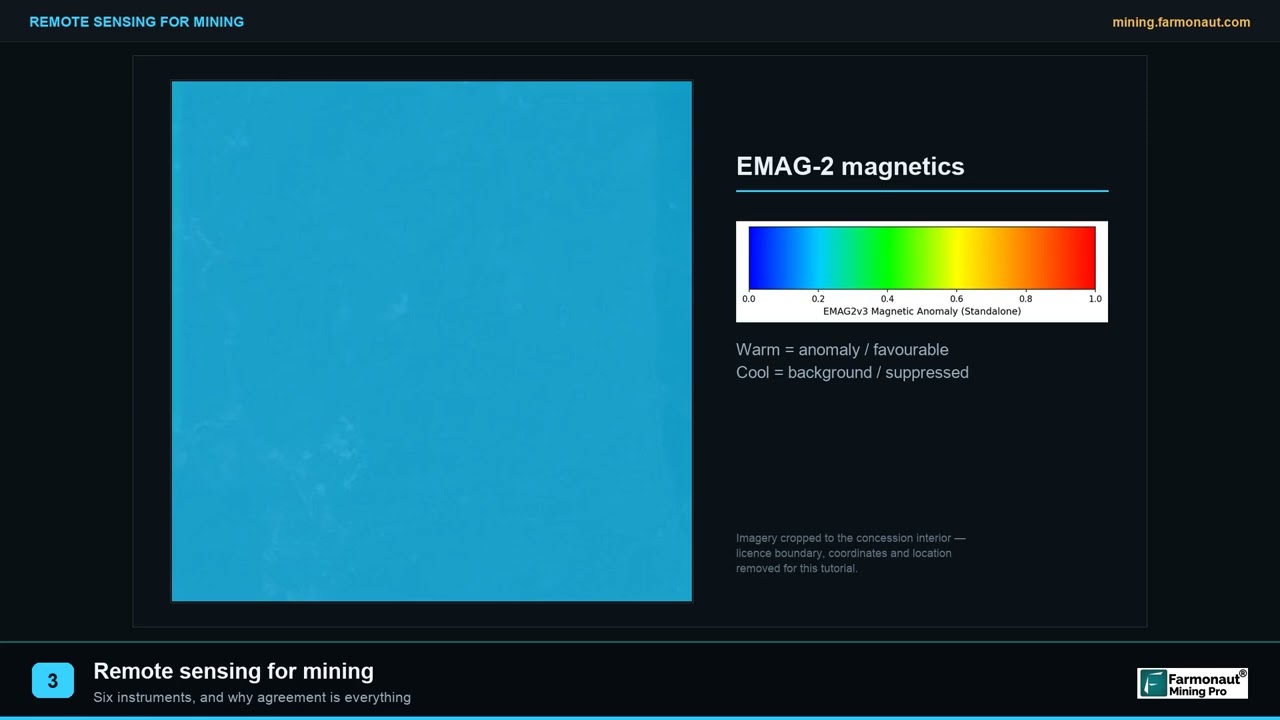
▶ Explains remote sensing for mining in three minutes, the method behind satellite screening of a licence area. · 2:01
Where to find current quotes
- Trading Economics shows a daily neodymium line with a history back to 2012.
- Benchmark Minerals and Fastmarkets publish assessments for NdPr, dysprosium and terbium; full price series need a subscription, but weekly articles quote the headline numbers.
- Argus Media and Shanghai Metals Market (SMM) publish assessments for China and for ex-China markets.
- USGS Mineral Commodity Summaries gives annual averages at no charge for each oxide, published each January or February.
- Company quarterly reports, such as Lynas on the ASX, give realised prices.
Our own pages on the topic include neodymium-praseodymium oxide and its uses.
We cover a connected topic in Lynas Rare Earths: Output, Plants and Prices in Charts.
Frequently asked questions
What is the price of neodymium today?
Trading Economics showed its neodymium benchmark at CNY 947,500 per tonne on 15 October 2026, up 30.69% on a year earlier. Check the live page for the current figure.
Why are rare earth prices different in China and outside China?
China controls most separation and sets export licences, while the US and its partners support ex-China producers with price floors. Benchmark found Chinese PrNd at RMB 721,500 per tonne in August 2026, a premium to the ex-China NdPr quote.
What is NdPr oxide and why do charts track it?
NdPr is a mix of neodymium and praseodymium oxides that is the raw material for the strongest permanent magnets. It makes up most of the revenue of the mines that produce it, so it is the benchmark for the sector.
Which rare earth is the most expensive?
Among the oxides quoted on this page, terbium oxide is the dearest at $5,000 to $8,000 per kilogram outside China on 1 October 2026 (Fastmarkets). The USGS 2025 average for terbium oxide was $1,010 per kilogram.
Are rare earth prices rising or falling?
It depends on the element. Ex-China NdPr fell 7.3% between 6 and 20 August 2026, while dysprosium and terbium oxide outside China rose sharply by 1 October 2026.
What is the $110 per kilogram NdPr price floor?
It is a price-protection agreement under which the US Department of Defense pays MP Materials the difference between $110 per kilogram and the market price for NdPr from Mountain Pass. Benchmark says Lynas has a $110 floor too; Lynas signed a binding letter of intent for it in March 2026 and a final contract was still to follow.
Where can I see a live rare earth price chart?
Trading Economics has a public daily neodymium chart. Argus, Fastmarkets, Benchmark and SMM hold fuller price series behind a subscription.
Why is yttrium so expensive now?
Ex-China yttrium oxide rose from single digits to nearly $1,100 per kilogram by May 2026 after China restricted exports in April 2025 (Argus via Reuters). Our yttrium page covers its uses and supply.
How do I convert yuan per tonne to dollars per kilogram?
Divide the yuan price by 1,000 to get yuan per kilogram, then divide by the USD/CNY rate. At 6.69, RMB 721,500 per tonne is about $108 per kilogram.
Do price changes affect a rare earth project’s value?
Yes. Revenue is tonnes times grade times recovery times price, so a change in the basket price changes the margin directly. A floor contract can limit the downside for the volume it covers.
Do recycling and substitution lower rare earth prices?
They reduce the need for new oxide, but the USGS says substitutes are generally less effective and recovery is still limited. Public loans to recyclers, such as the $80 million for a Marion, Indiana plant, aim to build that supply.
Is this investment advice?
No. The page reports dated prices from named sources. Check current quotes and speak to a licensed adviser before any decision.
This page is for information only. It is not investment advice. Prices are dated quotes from the named sources and change often; check current quotes before any decision.
Farmonaut mining
Screen exploration targets from space
Farmonaut maps an area of interest from satellite images to rank exploration targets before drilling, and takes KML, KMZ or polygon input.

Mining Pro sample view, synthetic data
Keep reading
Sources
- USGS, Mineral Commodity Summaries 2026: Rare Earths: pubs.usgs.gov
- USGS, Mineral Commodity Summaries 2026: Rare Earths (Heavy): pubs.usgs.gov
- Benchmark Minerals, Ex-China NdPr prices slip below $110/kg price floor (21 August 2026): source.benchmarkminerals.com
- Fastmarkets, US demand drives sharp increases in CIP global terbium, dysprosium prices (6 October 2026): fastmarkets.com
- Trading Economics, Neodymium Rare Earth price (15 October 2026): tradingeconomics.com
- The Oregon Group, Rare Earth prices surge as China keeps export restrictions (10 June 2026): theoregongroup.com
- MP Materials, fourth quarter and full year 2025 results: mpmaterials.com
- Lynas Rare Earths, quarterly report to 30 June 2026 (ASX): announcements.asx.com.au
- Lynas Rare Earths, quarterly report to 31 March 2026 (ASX): announcements.asx.com.au
- USGS, Mineral Commodity Summaries 2025: Rare Earths: pubs.usgs.gov
- Natural Resources Canada, Rare earth elements facts: natural-resources.canada.ca
- Mining Weekly, Lynas one step closer to supplying rare earths to US Department of War (16 March 2026): miningweekly.com
Discussion
Questions, corrections or field experience? Share them below. First-time comments are reviewed before they appear, and your email is never published.
No comments yet. Be the first to add a question or your experience.

 Faith At Work (Pty) Ltd
 Geotech Mining Solutions plc
 Vulcan International Limited
 Kidepo Associates
 GKY Mining
 Alkimy SARL
 Double A Trading
 GemSprout Metals Limited
 Qader Group
 Ileys General Trading
 SG Gold Mining LLC
 VRV Global Pte Ltd
 Omsri International FZE
 G.I.T.T.
 Jaunita Erss Ltd
 Almosi SARL
 SRK Consulting
 Berks Gold Limited
 Mwerezi Minerals Company Limited
 Mining SARL
 SenGold Invest SAS
 Exploration consultancy · South Africa · Gold










