

Plant health · Accuracy guide
AI Plant Apps: Accuracy Tests, Limits and Lab Costs
An AI plant app can name a tree from a leaf photo about 84% of the time (best of six apps, New Jersey test), but disease checks are harder: 65% on cassava in Tanzania, and a 99% lab model fell to 31% on outside images. Use it as a lead, then confirm.
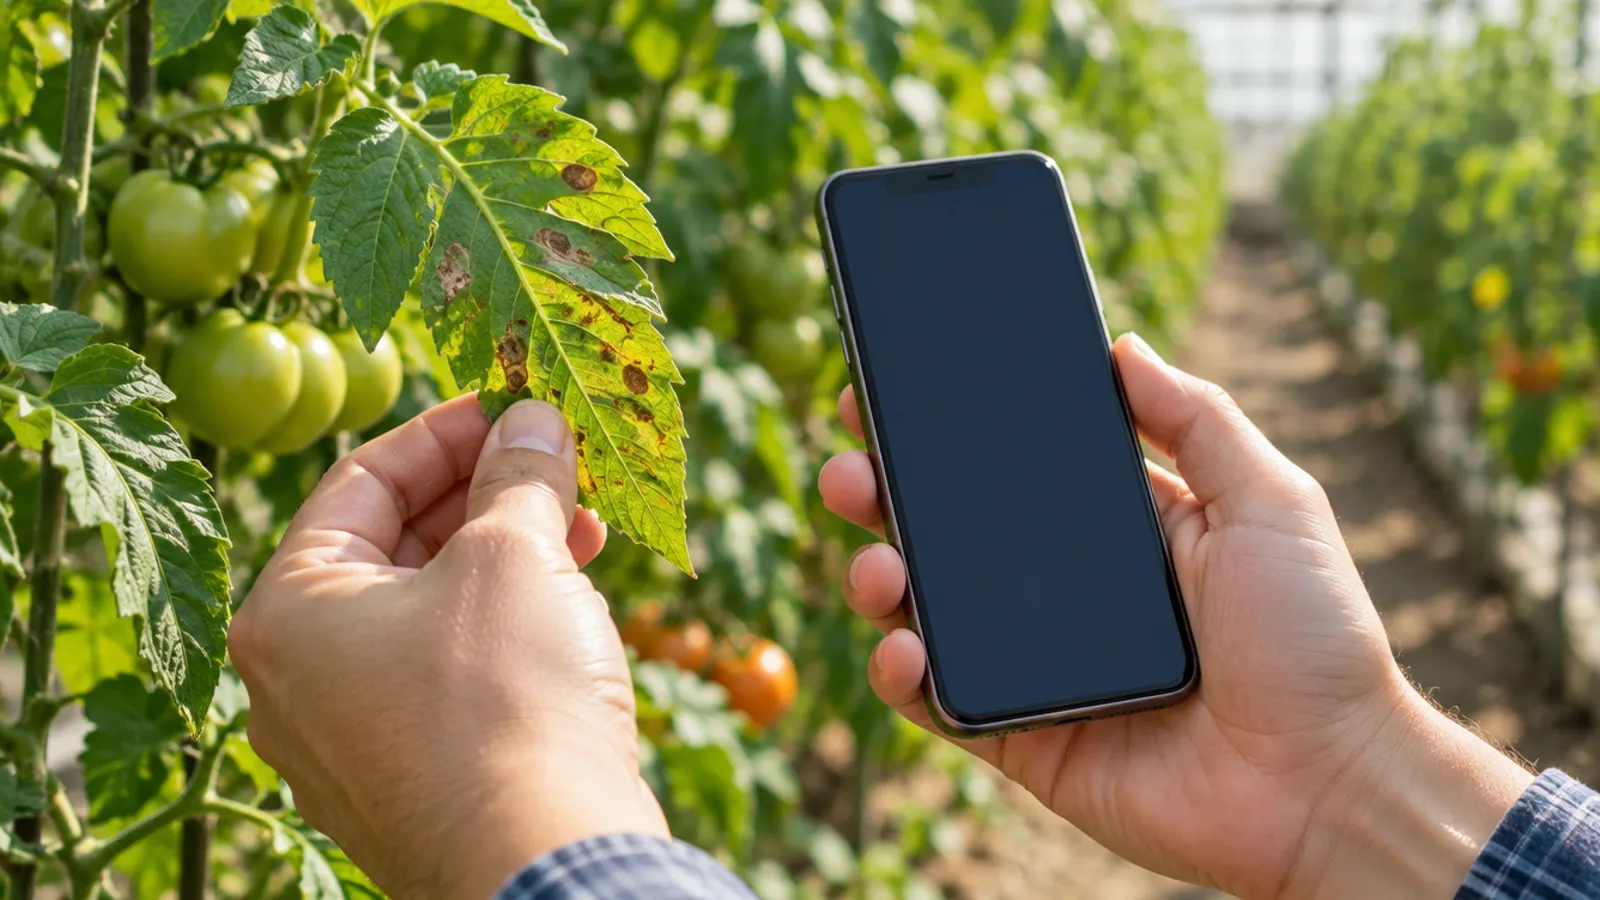
Key takeaways
- Best of six apps named tree species from leaf photos 83.9% of the time and genus 97.3% (Arboriculture & Urban Forestry, 2022); bark photos did much worse.
- A deep-learning model scored 99.35% on lab photos but 31.4% on images from other sources (Frontiers in Plant Science, 2016).
- In a Tanzanian field test the PlantVillage Nuru app scored 65% on cassava disease, against 40-58% for extension agents and 18-31% for farmers (Frontiers, 2020).
- Photographing six leaves per plant lifted the Nuru score to 74-88%.
- University clinics charge from US$20 to US$70 per sample (URI, Virginia Tech, read 26 October 2026); the calculator shows when a lab test beats a wrong spray.
In this article
- What an AI plant app actually does
- How accurate is an AI plant app?
- Look-alikes that fool a photo
- Why an early, correct diagnosis matters
- 7 ways to get a better answer from an AI plant app
- Notable AI plant apps and what each is for
- How to choose an app: six questions
- When to send a sample to a lab instead
- Photo or lab test: a cost calculator
- From one leaf to the whole field
- Privacy and other limits to check
- FAQ
- Related pages on our site
An AI plant app names a plant, or a problem on its leaves, from a phone photo. How often it is right depends on the job. In one New Jersey test, the best app named tree species from leaf photos 84% of the time (Arboriculture & Urban Forestry, 2022). For disease, a model that scored 99% on lab photos got about 31% on images from other sources (Frontiers in Plant Science, 2016), and a field test on cassava in Tanzania gave 65% (Frontiers, 2020).
So treat the answer as a lead, not a verdict. This guide shows the test data, how to take photos that help, when a lab test is cheaper than a wrong guess, and a calculator to check that for your own field. Always follow the product label and local rules before you spray anything, and ask a qualified adviser when the loss is large.
What an AI plant app actually does
The name covers three different tools. They answer different questions, so compare them one by one.
| Type | Question it answers | Input | Examples |
|---|---|---|---|
| Species ID | What plant is this? | Photo of leaf, flower or bark | Pl@ntNet, PictureThis, iNaturalist |
| Disease check | What is wrong with this leaf? | Photo of symptoms | Plantix, PlantVillage Nuru |
| Field monitoring | Which parts of my field look different? | Satellite images over time | Satellite crop-monitoring platforms |
Species apps compare your photo with a large image library. Pl@ntNet says it is a citizen-science platform with several million contributors in over 200 countries, and that it can identify tens of thousands of plant species from a photo (Pl@ntNet, About page, read 26 October 2026). Users share observations, the community reviews them, and the model learns from the reviewed set.
Disease apps are harder to build. A leaf spot can come from a fungus, a bacterium, a virus, an insect, a nutrient problem or herbicide drift, and many of these look alike. A 2022 review in the journal Agronomy searched three app stores and found 606 apps. It rated 17 of them. Most scored acceptably on design and speed but poorly on their AI functions, and the authors said that only one app, Plantix, could identify the plant, detect the disease, keep a plant database and suggest treatments (Siddiqua et al., 2022). Apps change quickly, so test any app on plants where you already know the answer.

▶ How AI is used for plant disease and pest detection, from diagnosis to yield prediction. · 11:10
How accurate is an AI plant app?
Three studies give a fair picture. Each one measures something different, so do not mix the numbers.
Chart
One disease model, three scores
% correct, 38 crop-disease classes; lab test set versus the first of two small sets of images from other sources (about 120 images)
Lab photos versus new photos
In 2016, researchers trained a deep-learning model on 54,306 leaf images taken under controlled conditions. It covered 14 crops and 26 diseases and reached 99.35% accuracy on a held-out part of the same set (Mohanty, Hughes and Salathé, 2016). On two small sets of images from other sources, about 120 images each, the same model got 31.4% and 31.7% right, while random guessing among 38 classes would get 2.6%. On the first set, the correct answer was in its top five guesses 52.9% of the time (65.6% on the second set). That gap is the main reason a lab score tells you little about your own field.
App versus people in the field
A team at the International Institute of Tropical Agriculture tested the PlantVillage Nuru app on cassava virus diseases and green mite damage in Tanzania. Its 2020 model scored 65% against 40-58% for extension agents and 18-31% for farmers (Mrisho et al., 2020). Checking six leaves per plant raised the app’s score to 74-88%. The older 2018 model scored 54% on the phone used in the field and 30-41% on three other phones, so the camera matters too.
This is one crop, one region and one app, and cassava is not a US or European crop. It shows two general points. A well-trained app can beat both farmers and extension agents, and it still misses about a third of cases.
Naming a tree from a leaf or from bark
Researchers tested six apps on 440 photos of leaves and bark from 55 tree species common in New Jersey. PictureThis was the most accurate and iNaturalist came second. Leaf photos worked far better than bark photos, and genus names were far more reliable than species names. The best app named the genus from leaf photos 97.3% of the time and the species 83.9% of the time (Schmidt et al., 2022). The authors suggest using the apps to narrow the list of options, not to replace field identification.
Chart
Who diagnoses cassava disease best?
% of cassava plants diagnosed correctly, Tanzania field test; ranges as reported, app shown as 65 plus or minus 3
Look-alikes that fool a photo
Many problems share the same signs, so a photo of one leaf may point to the wrong cause. Clemson Extension’s tomato factsheet (updated 11 July 2025) shows how different the causes can be for plants that look similar from a distance (Clemson HGIC). The table is for tomato, but the pattern holds for other crops.
| Problem | What the source says | Cause type |
|---|---|---|
| Bacterial wilt | Plant wilts fast while leaves stay green; a cut stem is brown and may ooze | Bacterium in soil |
| Late blight | Water-soaked spots, white mold on leaf undersides; can strip a plant within 14 days in cool, wet weather | Water mold |
| Spotted wilt | Bronze or dark spots, purple veins, cupped upper leaves | Virus spread by thrips |
| Blossom-end rot | Water-soaked spots at the fruit’s blossom end that turn black | Calcium disorder, not an infection |
| Herbicide injury | Distorted stems and leaves, or white-yellow leaflet bases | Spray drift or residue |
A drooping plant can come from a soil bacterium or from drought stress, and a dark fruit spot can come from a calcium disorder or from a rot caused by an organism. A single photo may not separate them. That is why the best habit is to add context to any photo: the weather of the last two weeks, what was sprayed nearby, when symptoms began, and how many plants are affected. Write these facts down before you look at the app’s answer, so the answer cannot steer your memory.
Why an early, correct diagnosis matters
FAO says that up to 40% of global food crops are lost to plant pests every year (IPPC, July 2025), and that trade losses linked to plant pests are worth over US$220 billion a year (FAO One Health). Those are world figures, not a forecast for your farm.
What a grower can control is speed and accuracy. A quick photo check costs nothing in time. A wrong answer can cost a spray pass for the wrong problem and a late fix for the right one. The calculator below puts a number on that trade-off.
7 ways to get a better answer from an AI plant app
- Photograph several leaves. In the Nuru field test, six leaves per plant lifted accuracy to 74-88%. The study assessed six leaves per plant, three from the top and three from the bottom.
- Show healthy and affected tissue side by side. The change between them is what separates a disease from normal variation.
- Use leaves, not bark or stems, when the app asks for a plant part. In the New Jersey tree test, leaf photos beat bark photos for the two best apps (PictureThis and iNaturalist).
- Use sharp, daylight photos on a clean background. Models trained on tidy images fall back sharply on messy ones, as the 31% result above shows.
- Read the top few suggestions, not just the first. The correct class was in the top five far more often than in first place in the 2016 study.
- Try more than one phone or app on a hard case. The Nuru results varied by phone, and the apps in the tree test ranked very differently.
- Confirm before you spend. Send a sample to a plant clinic when the loss is large, the symptoms are new, or the label would require a costly product.
A simple routine for each photo
Use the same routine for every check so you can compare results later. Photograph the whole plant from about 3 feet (1 metre) away, then the affected leaf from both sides, then a healthy leaf from the same plant. Add a coin or ruler for scale. Note the date, field name, crop stage and weather. Repeat on a second plant well away from the first, because the edge of a field often shows different stress from the middle. If three plants in different spots give the same answer, you can trust the pattern more than any single result.
Notable AI plant apps and what each is for
| App | Best for | What the sources show |
|---|---|---|
| Plantix | Crop disease checks | The only app in the 2022 Agronomy review to identify plants, detect disease and suggest treatments |
| PlantVillage Nuru | Cassava virus symptoms | 65% in a Tanzanian field test, above extension agents and farmers |
| Pl@ntNet | Wild and garden species | Community-reviewed library; tens of thousands of species |
| PictureThis | Trees and ornamentals | Top of six apps for tree leaf photos in New Jersey |
| iNaturalist | Wild species, with expert review | Second in the same tree test; gives several suggestions |
Chart
Tree species named correctly by photo type
% of photos named to species level; the two best of six apps, 440 photos of 55 New Jersey tree species
Your crop matters more than the brand. Most disease models are trained on a small list of crops, so an app that is strong on tomato or cassava may know little about your pasture grass, grape variety or barley. Ask the maker which crops and diseases the model covers, and test it on three or four plants you already know.
How to choose an app: six questions
- Does it cover your crop? Ask for the list of crops and diseases. A short list means more wrong answers on everything outside it.
- Does it show confidence and alternatives? An app that gives several ranked guesses helps you more than one that gives a single confident answer, because the right class is often in the top few.
- Has anyone tested it in the field? Look for published results on real farms, not only a lab score. Be wary of a single accuracy figure with no test described.
- Does it work offline? Test it in flight mode at the edge of your coverage.
- Where do your photos go? Check whether images and locations are stored, shared or used to train models.
- What does it cost over a season? Prices and plans change often, so read the current store page and compare it with a US$20-70 lab fee for the hard cases.
Which tool for which grower
A vineyard or orchard manager mostly needs help with a few known diseases, so a strong result on those crops and a quick route to a lab matters most. A row-crop farm with hundreds of acres needs to know where to look first, so field-level monitoring comes before leaf photos. A market gardener or hobby grower with a few beds gets the most from a species and disease app plus a local extension service. In the UK, Europe, Australia and New Zealand, the same logic applies, but the lab route runs through national or state plant-health bodies instead of US land-grant clinics.
When to send a sample to a lab instead
US land-grant universities run plant clinics that identify the cause with microscopes, culture and DNA or antibody tests. The National Plant Diagnostic Network lists labs in all US states and territories (live page read 26 October 2026), so contact your state clinic directly to confirm what it offers (NPDN).
Fees are modest next to a wrong spray. Virginia Tech charges US$35 for an in-state sample and US$70 for one from another state, and accepts digital, physical or combined samples (Virginia Tech Plant Disease Clinic). The University of Rhode Island charges US$20 per sample (URI Plant Diagnostic Laboratory). These are list fees on the clinics’ own pages, read on 26 October 2026, and other states differ. In Canada, the UK, Australia and New Zealand, ask your provincial, national or state plant-health service or a university lab.
Photo or lab test: a cost calculator
The calculator compares the expected cost of acting on an app result alone with the lab fee. Enter your own numbers.
Try the numbers for your own farm below.
Calculator
Is a lab test worth it for this field?
Enter your own field, costs and the app’s hit rate.
- Cost if the diagnosis is wrong: $210
- Lab fee: $35
- Expected cost minus lab fee: $7
- App hit rate at which both cost the same (0% means the lab never pays at this size): 83.3%
Example values only, not benchmarks or forecasts; use today’s prices. The model is simple: if the photo answer is wrong, you pay for a treatment that does not work and lose the share of crop value you entered. It ignores partial fixes and repeat sprays. The lab fee is an input; list fees at university clinics were US$20 (URI) and US$35 in-state (Virginia Tech) on 26 October 2026. Hit rate: use your own log of app answers versus lab results.
From one leaf to the whole field
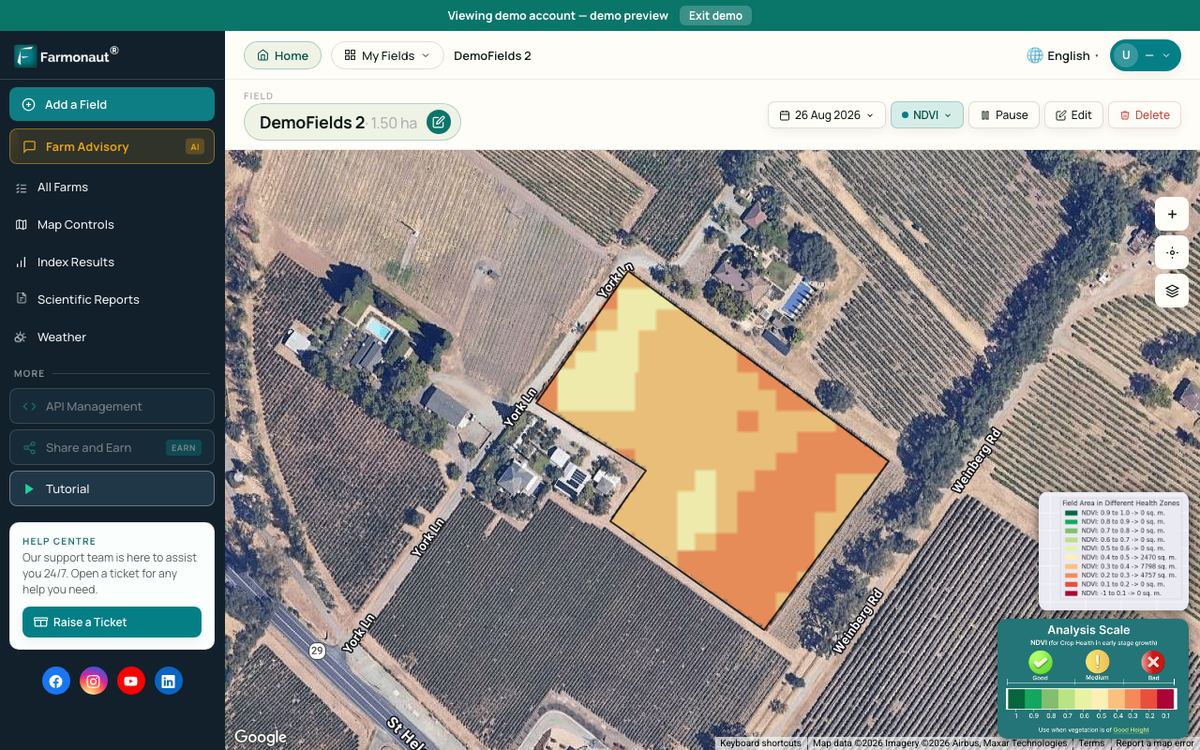
A phone photo covers one leaf. A disease or pest outbreak plays out across a whole field. Satellite images fill that gap in a different way. They show where a crop looks different from the rest of the field, and when the change began. They do not name the cause. Use them to decide which parts of a field to walk first, then take photos or samples there.
Farmonaut Satellite + AI Farm Monitoring System shows satellite vegetation maps for the fields you draw, so you can pick the spots worth a closer look before you open a diagnosis app. The videos below show how it works.
▶ How satellite NDVI maps show crop stress across a large farm before it is visible from the ground. · 4:09
Privacy and other limits to check
Keep your own record too. A simple log of photo, app answer, lab result and what you did gives you a local test of the app. After ten or twenty entries you will know how often it matched the lab for your crop, and you can put that rate into the calculator in place of the example value.
Photos can carry GPS data, and some apps keep images to retrain their models. Read the privacy policy, and turn off location tagging if you do not want your farm’s position shared. Apps also cover only the plants and diseases they were trained on, so a new local disease may not appear in the results. Offline modes differ by app. Test one with your phone in flight mode before you rely on it at a remote site.
Pesticide advice from an app is not a spray recommendation. The EPA reminds users to read the pesticide label every time, (US EPA, Pesticide Labels). Follow the label’s crop, rate and safety directions. Outside the US, use your national regulator’s rules and get advice from a local agronomist.
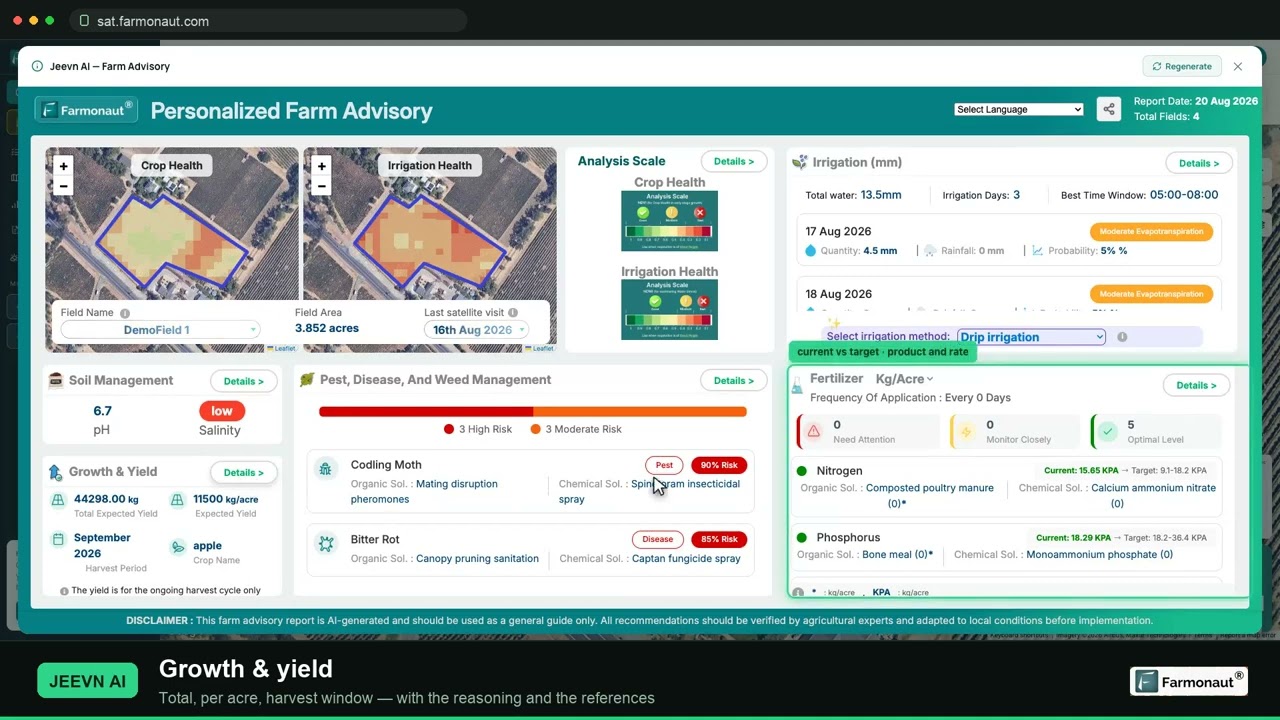
▶ A walkthrough of satellite crop monitoring: reading NDVI, running an AI farm advisory and pulling a field report. · 19:36
FAQ
What is an AI plant app?
It is a phone app that compares your photo with a large image library to name a plant or suggest what is wrong with it. Some also add care tips, reminders and a community of reviewers. The result is a suggestion and should be checked.
How accurate is an AI plant app?
It depends on the task and the test. The best of six apps named tree species from leaf photos 83.9% of the time. A disease app scored 65% on cassava in Tanzania. A model with a 99% lab score fell to about 31% on outside images. Ask for field results on your own crop.
Can an AI plant app diagnose a disease without internet?
Some can, because the model runs on the phone. Others need a connection to send the photo to a server. Check the app’s description, then test it in flight mode on a known plant.
Is an AI plant app better than a lab test?
No. Labs examine tissue and can culture the organism or run DNA or antibody tests. An app only sees a picture. Use the app for a first look and a lab test when the cost of being wrong is high.
Can I use satellite images to spot plant disease?
Satellite maps can show that part of a field looks different, such as a patch with lower vegetation index values. They cannot name the cause. Walk the flagged area, take leaf photos and send a sample if needed.
Related pages on our site
More on this topic: agriculture AI guide, aphids versus mealybugs, large-scale farm management app, carbon footprint tracking, product traceability, crop loan and insurance verification, fleet management, satellite and weather API docs, developer API and the crop monitoring market overview.
Farmonaut crop monitoring
See which parts of your field look different
Draw your fields once and Farmonaut shows satellite vegetation maps through the season, on web, Android or iOS, so you know where to take your leaf photos.


Keep reading
Sources
- Mohanty, Hughes and Salathé, Using Deep Learning for Image-Based Plant Disease Detection, Frontiers in Plant Science (2016): frontiersin.org
- Mrisho et al., Accuracy of PlantVillage Nuru for cassava virus diseases, Frontiers in Plant Science (2020): frontiersin.org
- Schmidt et al., Accuracy of photo-based plant identification apps on 55 tree species, Arboriculture & Urban Forestry (2022): auf.isa-arbor.com
- Siddiqua et al., Evaluating plant disease detection mobile apps, Agronomy (2022), arXiv: arxiv.org
- IPPC/FAO, Setting the standard: global efforts behind plant health protection (8 July 2025): ippc.int
- FAO One Health, The hidden health crisis: how plant diseases threaten global food security: fao.org
- National Plant Diagnostic Network, home page (read 26 October 2026): npdn.org
- Virginia Tech Plant Disease Clinic, Submitting samples (read 26 October 2026): spes.vt.edu
- University of Rhode Island Plant Diagnostic Laboratory (read 26 October 2026): web.uri.edu
- Pl@ntNet, About (read 26 October 2026): plantnet.org
- Clemson HGIC, Tomato Diseases and Disorders (updated 11 July 2025): hgic.clemson.edu
- US EPA, Pesticide Labels: epa.gov
Discussion
Questions, corrections or field experience? Share them below. First-time comments are reviewed before they appear, and your email is never published.
No comments yet. Be the first to add a question or your experience.

 Grandstream Algérie
 XOS Realty
 Geospatial Lab Africa
 KhetiBuddy
 Agro La Gándara
 HIPSAC
 ZOL Zimbabwe
 Juligerm
 AdBio
 MISE Maroc
 NWNS
 Red August Group
 Farm Inc
 WeMe Global
 Agrotoken
 Blue BearX
 Insignito
 Croptimum
 DnCubed
 Field Capacity
 Indosistim Teknologi

 Licence holder · Niger · Gold
 Licence holder · Nigeria · Gold + lithium










