

Reviewed September 2026 against USDA Economic Research Service, AgriFutures Australia, and IMARC Group.
Try it: Run your own numbers →
Introduction: Three Questions, One Page
If you searched “investing in seaweed farming,” “best farming apps,” or “what is O farming investing,” you’re really asking three connected questions: is seaweed aquaculture a real, fundable industry; which mobile and web tools actually help farmers and investors track a growing operation; and what does “O-farming” mean as an investment category. The short answers: yes, seaweed farming is a real and growing sector — Australia’s seaweed market alone was valued at $271.5 million in 2025 with a projected 7.45% compound annual growth rate through 2034, per IMARC Group; most working farm apps today are precision-agriculture and monitoring tools rather than seaweed-specific platforms; and “O-farming” (organic/ocean farming) is best understood as an umbrella term rather than a single regulated asset class, so due diligence has to be done manually.
This page treats all three as one topic: technology-driven ag and aquaculture investing, evaluated with the same due-diligence lens — real production costs, real adoption rates, and apps that publish verifiable data rather than marketing claims. We draw on USDA Economic Research Service farm technology surveys, AgriFutures Australia’s industry forecasts, and peer-reviewed seaweed cost data, because generic “top 10 apps” listicles don’t cite any of these.
Investing in Seaweed Farming: What “O-Farming” Actually Means
Seaweed farming (sometimes marketed under “ocean farming” or shortened to “O-farming” in search queries) is aquaculture: growing macroalgae — kelp, nori, and related species — on submerged lines or rafts, typically in nearshore coastal waters. It is not a stock ticker or a single regulated fund category. When someone asks “what is O farming investing,” the honest answer is that it spans several distinct entry points, each with different risk:
- Direct farm ownership or leasehold — securing a coastal aquaculture lease and operating grow lines yourself, subject to state/territory coastal-water permitting in Australia or state aquaculture leasing rules in the US.
- Equity in seaweed-processing or biotech companies — investing in firms that convert kelp into food ingredients, biostimulants, or bioplastics, rather than in the farms themselves.
- Cooperative or community-supported aquaculture shares — smaller-scale buy-ins tied to a specific coastal operation’s harvest, more common in early-stage US Northeast kelp ventures.
- Research and grant-backed pilot projects — government-supported trials, more a proof-of-concept investment than a revenue-generating one at this stage.
- Try it: Run your own numbers
None of these is wrong to call “seaweed farming investment,” which is exactly why the category confuses first-time searchers — and why generic finance sites rank above pages that actually explain it. AgriFutures Australia, the Australian government’s rural research and development body, projects the domestic seaweed industry could be worth more than $100 million by 2030, per AgriFutures Australia. That figure is a sector-level forecast, not a guaranteed return on any specific farm or fund — treat it as evidence the category is being taken seriously by public research bodies, not as a yield projection for your capital.
Seaweed Farm Economics: Costs, Growth Rate, and What’s Not Yet Published
The most citable, peer-reviewed cost figure available for seaweed farming comes from a Nature Plants study covering 2022–2024 research: production costs ranged from $350 to $7,150 per tonne on a dry-weight basis, per the Nature Plants peer-reviewed study. That is an unusually wide range for a single commodity, and the width is itself the finding — it reflects differences in species grown, labor cost by region, line-deployment method, and whether harvesting is manual or mechanized. Before treating any single seaweed cost figure as representative, confirm which end of that range the specific operation you’re evaluating sits on, and why.
What we could not verify, and will not invent a number for: US seaweed production volume in tonnes per year. No official USDA or NOAA Fisheries dataset publishes a national seaweed aquaculture production census at commercial scale — the US industry is still largely pre-commercial, concentrated in pilot and early-stage Northeast kelp operations. Similarly, there is no ABARES (Australian Bureau of Agricultural and Resource Economics and Sciences) or Australian Bureau of Statistics dataset on farm-level smartphone or app adoption rates specific to Australian growers — the adoption figures in the next section are US-only and should be read as a proxy, not an Australian data point.
If you need a current production-volume or yield figure for a specific US state or Australian territory, the two most reliable paths are: (1) contact the relevant state aquaculture leasing authority directly for permitted-acreage data, since permit records are public even where production totals aren’t aggregated; and (2) check NOAA Fisheries’ aquaculture program pages for any newly published national estimate, since this is an area where reporting is actively expanding.

Watch: how satellite and AI monitoring tools track growing operations for investors and operators, on land and adaptable to coastal leases.
Best Farming Apps: Adoption Data From US Row-Crop and Urban Growers
“Best farming apps” is the highest-volume query on this page, and it deserves a data-backed answer rather than a top-10 list with no sourcing. Two figures anchor how mainstream app-based farm management already is in the United States: 70%+ of US farmers report using mobile or agricultural apps routinely, and 82% of US farms report smartphone ownership for operational use, both per a 2023–2024 industry survey cited by Local Line’s review of farming apps. That’s a materially different starting point from five years ago, when smartphone-based farm management was a minority practice.
Underneath that headline number, adoption is uneven by technology and farm size, according to USDA’s Economic Research Service. In its 2016–2019 baseline survey: over 90% of US farms used GPS guidance or auto-steer technology, and 82% of farms used variable rate technology for fertilizer application (2018–2019 survey data). But guidance adoption split sharply by scale — 73% of the largest US corn farms used precision guidance in 2016, versus just 10% of the smallest, per USDA Economic Research Service. That gap is the real story behind “best app” searches: a tool that’s essential on a 2,000-acre operation can be irrelevant overhead on a 20-acre urban plot, and vice versa.
USDA’s ERS baseline data is from 2016–2019; the department’s National Agricultural Statistics Service runs a broader agricultural technology census on a multi-year cycle, with the next major update expected in 2026. If you’re citing adoption figures for a proposal or investor memo, check NASS directly for whatever is the most recently published cycle before using the 2016–2019 baseline as current — it’s the best available figure as of this review, not a permanently fresh one.
For urban and small-acreage growers specifically — the audience actually searching “best farming apps” alongside seaweed and O-farming queries — the practical shortlist splits into three categories: (1) general precision-ag platforms built for row crops but scalable down, (2) satellite/remote-sensing apps that need no in-field hardware, and (3) farm-record and compliance apps aimed at grant or insurance reporting. The comparison table below scores real platforms against those categories.
Precision Agriculture Tools and Farm Management Apps
Modern farm management apps integrate crop calendars, real-time soil and weather tracking, satellite analytics, and mobile dashboards. For an operation moving from spreadsheet record-keeping to app-based management, the features worth prioritizing are the ones tied to the adoption data above — GPS/guidance integration and variable-rate input planning, since those are the two technologies with the most US farms already using them.
- ✔ Crop and input tracking for every field and input (seed, fertilizer, pesticide) — the baseline record most apps now offer.
- 📊 Remote sensing integration — satellite or drone imagery for crop-stress and pest diagnostics without a farm visit.
- ⚠ Risk: an app that tracks inputs but not outcomes (yield, water use) can’t support an investment or loan case — insist on both.
- ✔ Variable-rate compatibility — matters most if you’re already at or above the 82% US adoption rate for fertilizer VRT.
- ✔ Export/reporting — dashboards that generate audit-ready records for lenders, insurers, or grant reporting.
Key Features to Expect in the Best Farming Apps:
- Field-level input tracking for seed, fertilizer, and pesticide applications.
- Integration with remote sensing for crop stress and pest-outbreak diagnostics.
- Yield prediction using historical plus current-season data.
- Water-use dashboards for both cost control and sustainability reporting.
- Alerts tied to soil health and optimal intervention timing.

Discover: AI-powered smart farming for precision agriculture and data-driven investment strategies.
Want to unlock satellite-driven crop monitoring, advisory, and precision farming tools?



Developers & Businesses: Use Farmonaut’s API to integrate real-time crop health, weather, and sustainability analytics into your platforms. Full developer docs: API Documentation
See also our companion piece on seven farm management apps revolutionizing precision agriculture for a deeper comparison of row-crop-focused platforms.
Crop Analytics & Satellite Data for Ocean and Land Assets
Satellite monitoring was built for land parcels, but the same due-diligence logic investors apply to farmland — near-real-time verification instead of relying on an operator’s self-reported figures — is exactly what’s missing from most seaweed and O-farming investment pitches. A coastal lease boundary can be checked against satellite imagery the same way a row-crop field boundary can; what’s harder to verify remotely is submerged biomass, which is why on-water sampling still matters for seaweed specifically.
- ✔ Near-real-time data: supports both daily operational decisions and longer-term investment monitoring.
- 📊 Historical performance: multi-season imagery supports trend analysis and asset valuation.
- ⚠ Limitation: apps without independent, verifiable data provenance are unsuitable for investment-grade due diligence — insist on knowing the imagery source and pass frequency.
- ✔ Integration: works alongside remote sensors, irrigation systems, and weather stations for fuller asset visibility.

Watch: soil health and carbon farming monitoring approaches, relevant to both land and coastal aquaculture due diligence.
Comparison Table: Apps and Platforms for Farming Investment
| App / Platform | Best For | Core Monitoring Features | Platform Availability | Pricing Model | Verified Data Source |
|---|---|---|---|---|---|
| Farmonaut | Land-based crop monitoring, urban farms, API integration | Satellite NDVI/soil metrics, Jeevn AI advisory, weather forecasts, blockchain traceability | Android/iOS/Web/API | Free tier + paid subscriptions | Multispectral satellite imagery, own AI models |
| USDA Farm Service Agency tools | US row-crop and program-eligibility record keeping | Compliance and program-payment records | Web | Free (government service) | USDA-verified farm records |
| Coastal state aquaculture lease portals | Direct seaweed farm lease verification (US, by state) | Public lease boundary and permit-status lookup | Web | Free (public record) | State agency filings |
| General precision-ag apps (row-crop focused) | Large-acreage US grain and row-crop operations | GPS guidance, variable-rate input mapping | Varies | Paid, often equipment-bundled | Depends on vendor — verify before citing yield claims |
| Farm record & grant-compliance apps | Smallholder and urban growers needing audit-ready reporting | Input logs, expense tracking, report export | Web/App | Free tier + paid | Self-reported unless paired with satellite verification |
Note what this table deliberately does not include: named seaweed-specific investment apps with public user ratings or verified ROI figures. As of this review, no such platform has independently audited performance data we could confirm against a primary source — which is itself the finding for anyone searching “investing in seaweed farming” expecting an app-store-ready answer.
Calculator: Is Your Operation a Fit for App-Based Monitoring?
Use your own acreage and current technology adoption to see where you sit against the USDA farm-size adoption gap described above, and get a plain-language read on which app category fits first.
Run your own numbers
Assumptions: based on USDA ERS 2016–2019 baseline adoption figures and a 2023–2024 industry survey of US mobile app use; excludes region-specific input costs, crop type, and any Australian-specific adoption data (not separately published). Treat results as a starting orientation, not a financial or agronomic recommendation.
How to Choose the Right App or Platform
- ✔ Due diligence: confirm any adoption, yield, or ROI figure against its named primary source before citing it further.
- 📊 Operational transparency: look for clear dashboards, verifiable imagery sources, and exportable records.
- ⚠ For seaweed/O-farming specifically: verify the coastal lease or corporate structure directly with the relevant state or territory agency — there is no unified investment-app equivalent yet.
- ✔ Match farm size to technology: the USDA guidance-adoption gap (73% largest vs. 10% smallest US corn farms) means the “best” app genuinely differs by scale.
- 🔗 Alignment with objectives: compliance reporting, yield optimization, and investment monitoring call for different feature sets — don’t pay for all three if you need one.
Access fleet and resource management solutions for larger operations, or explore satellite-based loan and insurance verification to support financing decisions with independently checkable data.

Learn: business models for low-investment agricultural ventures, useful context when comparing farm technology spend against expected returns.
Spotlight: Satellite, AI, and Blockchain-Driven Monitoring — Farmonaut
As a satellite technology company, we at Farmonaut build monitoring tools for agriculture, infrastructure, mining, and forestry — designed to be affordable for operations far smaller than the enterprise farms in USDA’s largest-adopter category.
How Farmonaut Serves Farming and Land-Asset Investors:
- ✔ Real-time monitoring: multispectral satellite imagery tracks crop health, soil quality, and vegetation index (NDVI) without in-field hardware.
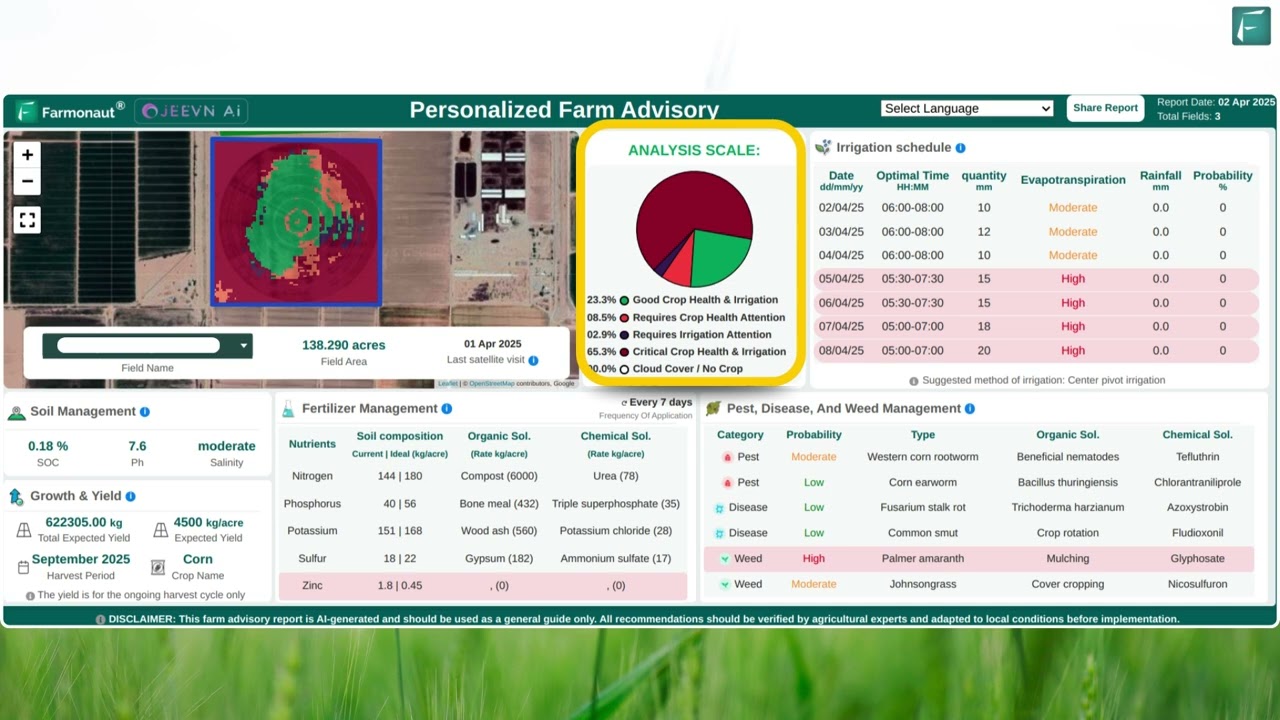
- 📊 AI-based advisory: our Jeevn AI system analyzes satellite data for custom advisory, weather forecasts, and yield predictions.
- 🔗 Blockchain traceability: secure farm-to-market traceability for supply-chain trust.
- 💡 Fleet and resource management: optimize logistics via fleet tracking and resource planning.
- 🌍 Environmental impact monitoring: meet regulatory and lender requirements via carbon and sustainability dashboards.

Explore: how drone and AI analytics are applied to real farm operations and investment monitoring.
- 📊 Lower barriers to entry: no expensive in-field hardware required — access insights via app or API.
- 📈 Scalable: from small urban plots to large operations, without needing the equipment-bundled guidance systems that drove the 73%-vs-10% USDA adoption gap.
- ⚡ Real-time data: satellite passes and AI models provide actionable insights on a regular cadence.
- 🌿 Sustainability tracking: carbon, soil, and resource monitoring aligned with current reporting expectations.
- 🔗 Accessible via app, web, and API: integrates into existing operational or investment-monitoring workflows.

See how satellite-based crop health monitoring supports both farm operations and investment due diligence.

Discover how AI and satellite tech combine for farm management decisions.
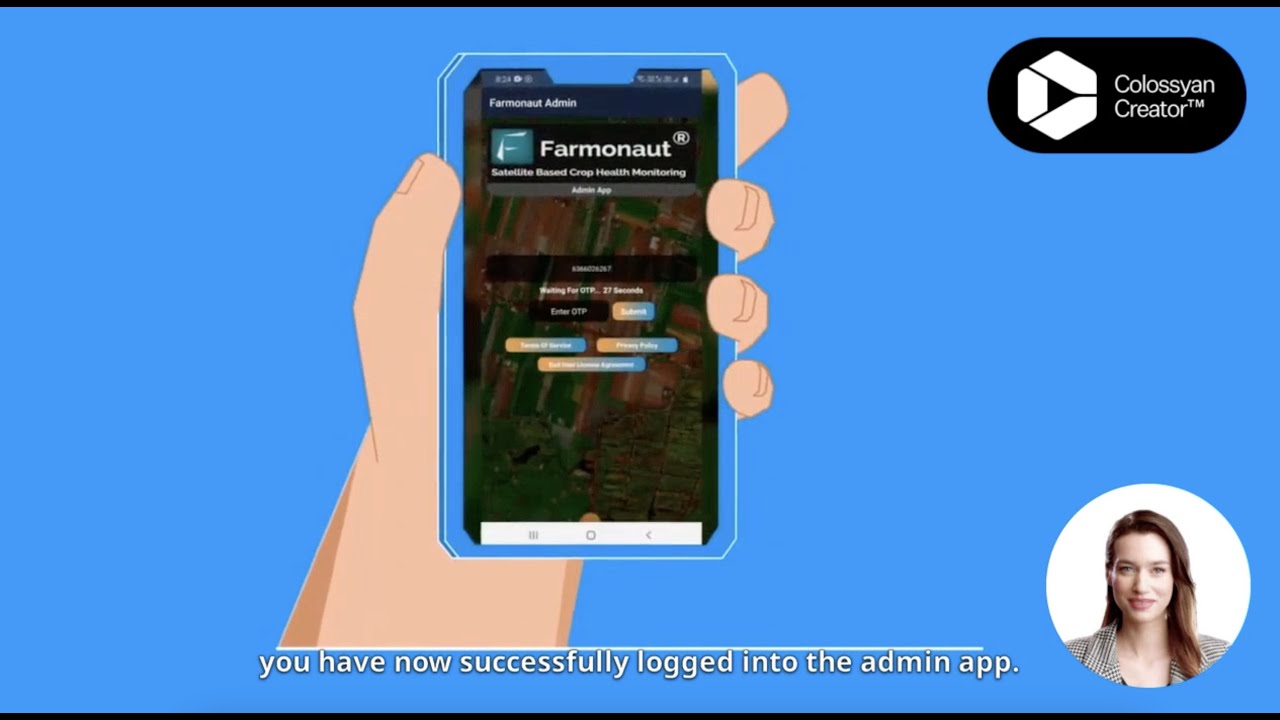
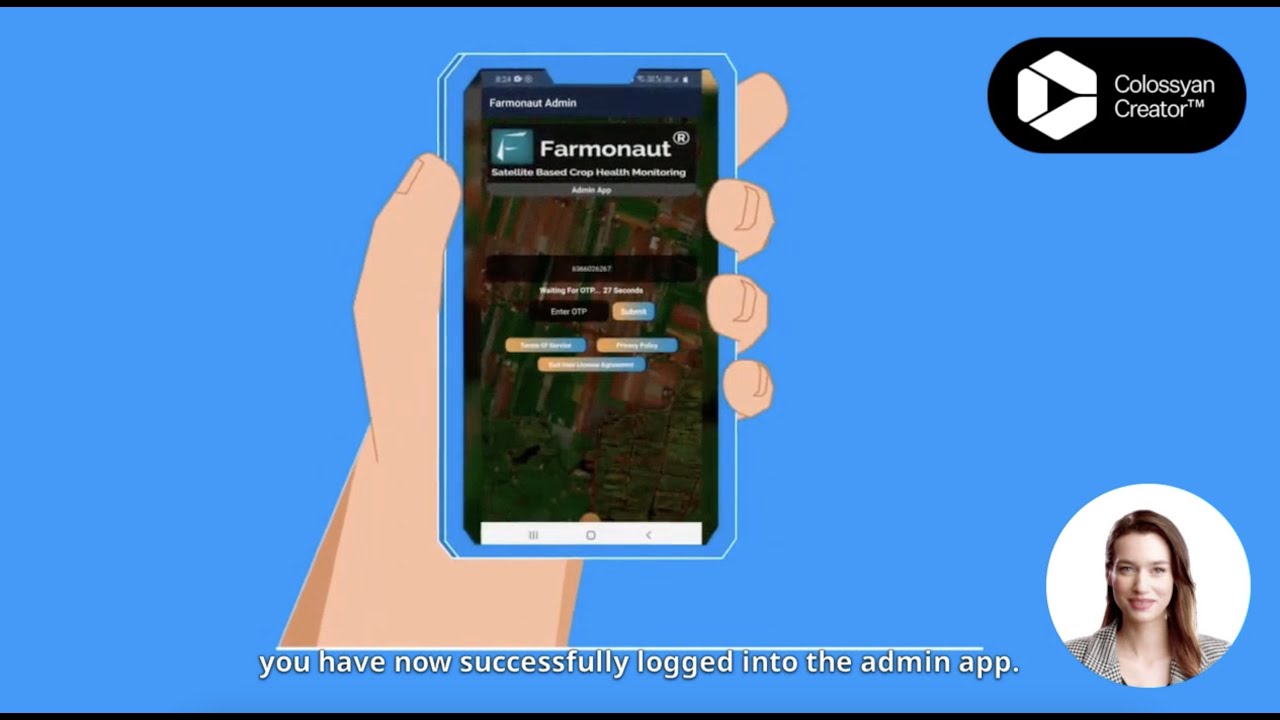
See how admin-level dashboards support larger portfolios via our large-scale farm management solution.
Farmonaut Subscription Options
We at Farmonaut offer flexible subscription plans for individual users, agribusinesses, and institutions — from basic remote crop health monitoring to full-scale infrastructure and forestry analytics.
Interested in starting? Access our web, Android, and iOS apps here. For API pricing, see our developer documentation.
Frequently Asked Questions
- Q. Is investing in seaweed farming a real opportunity, or mostly hype?
- A. It’s real but early-stage. Australia’s seaweed market was valued at $271.5 million in 2025 with a 7.45% projected CAGR through 2034 (IMARC Group), and AgriFutures Australia projects $100 million+ industry value by 2030. Production costs run $350–$7,150 per tonne dry weight depending on method and region (Nature Plants, 2022–2024 research). There’s no unified investment app or fund category yet — due diligence happens deal by deal.
- Q. What is “O-farming investing”?
- A. It refers to ocean/organic farming investment — most commonly seaweed and macroalgae aquaculture. It isn’t a single regulated product; entry points range from direct coastal lease ownership to equity in seaweed-processing companies to cooperative harvest shares.
- Q. What are the best farming apps in general use today?
- A. Adoption is high and uneven: 70%+ of US farmers use mobile ag apps routinely and 82% own smartphones for operational use (2023–2024 industry survey). Among precision tools specifically, over 90% of US farms use GPS guidance and 82% use variable-rate fertilizer technology, per USDA ERS — though guidance adoption ranges from 73% on the largest corn farms to just 10% on the smallest (2016 data).
- Q. Do these adoption figures apply to Australian farms too?
- A. Not confirmed. No ABARES or Australian Bureau of Statistics dataset on farm-level app/smartphone adoption was found for this review; the adoption figures above are US-only (USDA ERS and industry survey data) and should be treated as a proxy, not an Australian statistic.
- Q. What is Farmonaut and how can I use it?
- A. We at Farmonaut provide satellite-driven, real-time monitoring and AI advisory for farming, mining, infrastructure, and forestry via Android/iOS/Web apps or API integration, plus blockchain-based traceability and carbon-footprint dashboarding.






Conclusion & Next Steps
Seaweed farming investment is a genuine and growing category — backed by AgriFutures Australia’s $100 million-by-2030 projection and IMARC Group’s $271.5 million 2025 Australian market figure — but it remains a manual due-diligence exercise, not an app-store category, because no unified platform yet aggregates verified seaweed-farm performance data. Meanwhile, “best farming apps” already has a well-evidenced answer for land-based operations: match the app category to your acreage and existing technology, using USDA ERS’s adoption-by-farm-size data as your benchmark rather than a generic feature list.
- ✔ For seaweed/O-farming: verify leases and permits directly with state or territory coastal authorities before treating any pitch as a packaged investment product.
- 📊 For farm apps: match technology to scale — guidance/VRT for larger acreage, satellite/remote-sensing for smaller or urban operations.
- 🔗 Always check the vintage of any adoption or cost figure you cite, and confirm against the primary source before using it in a proposal.
- 💡 Choose platforms that publish their data sources — imagery provenance, survey methodology, and update cadence — not just a feature list.
Ready to start? Download Farmonaut or access our web and API tools to monitor crop health and land-asset performance with satellite-verified data.

 Godrej Agrovet
 Hayleys Agriculture
 Linx Agritech
 Adinet
 Save Your Soils
 GalaxEye Space
 Grandstream Algérie
 XOS Realty
 Geospatial Lab Africa
 Agro La Gándara
 HIPSAC
 ZOL Zimbabwe
 Juligerm
 AdBio
AdBio MISE Maroc
 NWNS
NWNS Red August Group
 Farm Inc
 WeMe Global
 Agrotoken
 Blue BearX
 Insignito
 DnCubed
 Indosistim Teknologi
 Liquify Digital
 CU Foods
 BeyondTech Global
 Rouge VC
 AgroRisk
 Oath Inc
 Esri North East Africa
 MDCV UK
 Etech Consulting Madagascar
 Vestlandsforsking
 WB Dev
 Sama Premium
 Tres Valles
 Blickwinkel
 Agricultural Credit Policy Council
 eKGIS
eKGIS Mostas Tech
 Andex
Andex Deluxe Conseil
 WICO
WICO Chimera Innovation
 SkyHarvest
 Teledarbas
 Exurbia Geospatial
 FieldZero
