

Crop protection · Diagnosis guide
Phytotoxicity: Symptoms, Causes and What to Do First
Phytotoxicity is injury to a plant from a chemical or a toxic level of a substance in soil or water. Doses can be tiny: In simulated drift trials, Nebraska recorded 20% to 50% injury on non-tolerant soybean from dicamba at 1/500 of the recommended rate.
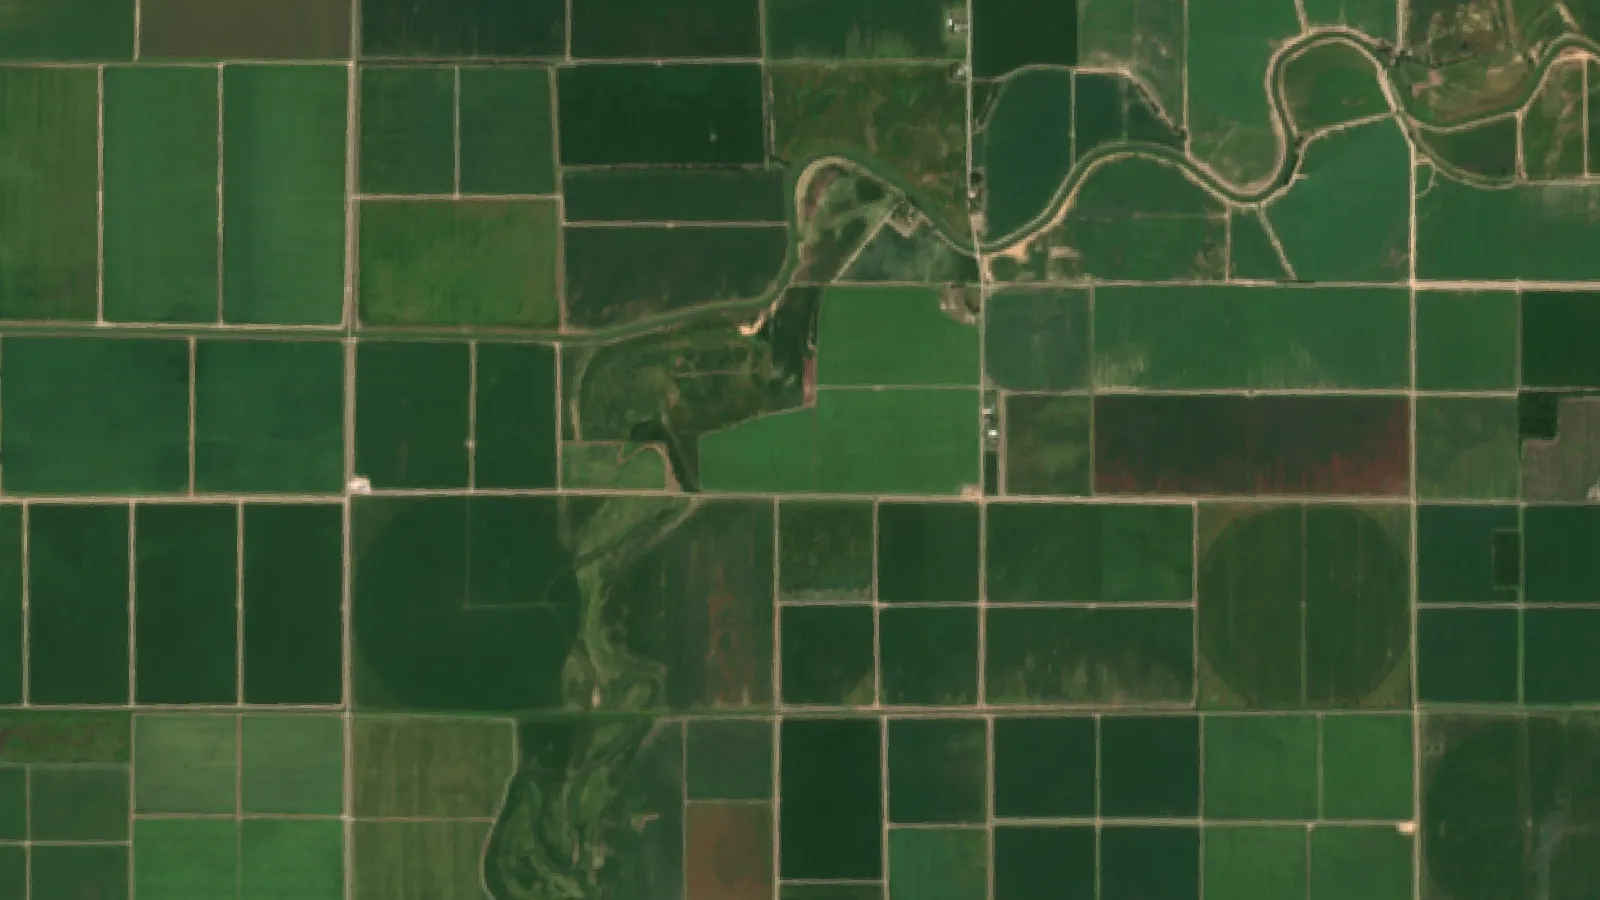
Key takeaways
- Phytotoxicity has a non-living cause, so it does not spread from plant to plant the way a disease can.
- Injury that follows spray passes, field edges or a wind path, or that hits several species, points toward a chemical.
- About 4% of US soybean fields had off-target dicamba damage in 2018, and about 1 in 13 in Nebraska and Illinois (USDA ERS).
- Calm air is not always safe: temperature inversions can carry fine droplets several miles (Ohio State).
- Act fast after suspected injury. Broadleaf herbicides can degrade within weeks, and Missouri requires incident reports within 30 days.
In this article
- What is phytotoxicity?
- Phytotoxicity symptoms: what to look for
- Phytotoxicity vs disease, deficiency and other look-alikes
- What causes phytotoxicity?
- Weather and phytotoxicity risk
- Herbicide drift: how small a dose can do harm
- What to do in the first 72 hours
- How to prevent phytotoxicity: a pre-spray checklist
- Is the prevention worth the cost?
- Phytotoxicity in organic systems
- Residue limits, records and regulators
- Can satellites help with phytotoxicity?
- FAQ
Phytotoxicity is injury to a plant caused by a chemical or by a toxic level of a substance in soil or water. Common sources are herbicides, fungicides, spray oils, copper and salts. Dose matters a great deal: Nebraska simulated drift studies recorded 20% to 50% injury on non-tolerant soybean from dicamba at just 1/500 of the recommended rate.
This guide explains what the word means, how symptoms look, how to tell chemical injury from disease, and what to do in the first days after you suspect it. It also has three charts of published data and a calculator to compare the cost of prevention with the crop value at risk.
What is phytotoxicity?
The word joins “phyto” (plant) and “toxic” (poisonous). A substance is phytotoxic when it harms plant tissue or stops normal growth. A phytotoxic effect can be as small as a few speckled leaves or as large as a dead crop.
Phytotoxicity is not a disease. No fungus, bacterium or virus is involved, so it does not spread from plant to plant. It is an abiotic disorder, which means it has a non-living cause. UC IPM lists phytotoxicity among the abiotic disorders in its citrus guide, next to frost, sunburn and wind damage.
The term also covers more than farm sprays. FAO names boron, chloride and sodium as common phytotoxic ions in treated wastewater used for irrigation, and it says the damage depends on the crop, its growth stage, the ion concentration, climate and soil. An EPA guide on soil amendments lists aluminum, borate, chromate and copper among soil contaminants linked to phytotoxicity, with pH affecting how toxic each one is.
The word in other languages
Readers searching in Indonesian will see “fitotoksisitas” or “fitotoksik”: fitotoksisitas adalah keracunan pada tanaman akibat bahan kimia. In Spanish, “fitotóxico” describes a substance that harms plants, and in Portuguese the word is “fitotoxidade”. The symptoms and checks below are the same in any language. Only the regulator and the label change.
Phytotoxicity symptoms: what to look for
Symptoms vary by chemical, crop and dose. Use this table as a starting point, then confirm the cause with the spray records and an expert.
| Symptom | What you see | Possible chemical cause |
|---|---|---|
| Cupped leaves | Leaves curl or pucker, often on new growth | Growth-regulator herbicides such as dicamba |
| Strapped leaves | Narrow leaves with parallel veins | 2,4-D on grapes; dicamba on tomato new growth |
| Vein clearing | Veins turn yellow or white | Root uptake of bromacil or diuron in citrus |
| Pale blotches | Blotches and yellowing between veins | Simazine in citrus |
| Needle-like leaves | Small, puckered or willow-like new leaves | Glyphosate in citrus |
| Leaf burn | Dead, scorched tissue | Oils or other sprays in hot weather |
| Twisted stems | Bent stems and petioles | Dicamba or 2,4-D |
| Poor fruit set | Delayed or uneven flowering and fruit | Dicamba or 2,4-D |
The Ohio State fact sheet on how these two herbicides damage plants adds stunting, necrosis, extra root growth on stems and lower yield to the list. It also warns that species differ too much for broad rules. On grapes, dicamba more often causes cupped leaves, while 2,4-D more often causes narrow strapped leaves. Snap beans and lima beans react more strongly to dicamba than to 2,4-D.
How fast symptoms appear
Timing depends on the product and on how fast the plant is growing. Dicamba and 2,4-D symptoms can show within hours on fast-growing plants, or within a few days when growth is slow, according to the Ohio State series. University of Nebraska photos show leaf cupping on soybean seven days after dicamba and on younger leaves at two weeks, with clear injury still visible on tomato, soybean and grape at 21 days.
Write the date you first see symptoms beside the date of each spray on or near the field. That simple match often says more than the leaf itself.
Does visible injury always mean lost yield?
No. Ohio State says dramatic-looking injury can appear on very sensitive species at very low doses, and that early season damage can fade within a few weeks with no yield loss. In other cases a crop seems to recover, and then harvest reveals misshapen or stunted produce. Perennial crops carry a longer risk, because drift may reduce winter hardiness and long-term vigor. So record everything, but do not write the crop off or replant too early.
Phytotoxicity vs disease, deficiency and other look-alikes
Damaged leaves have many causes. Treating the wrong one costs money and time, and another spray can add stress to an injured crop. These clues help you sort the options.
| Clue | Phytotoxicity | Disease | Nutrient deficiency |
|---|---|---|---|
| Field pattern | Follows spray passes, overlaps, field edges or a wind path | Often patches that grow over time | Often follows soil type or low spots |
| Spread | Does not spread between plants | Can spread | Does not spread between plants |
| New growth | Later growth may look normal once exposure ends, except with some growth regulators | Depends on the disease | Continues until the shortage is fixed |
| Several species | Several crops or weeds may show injury together | Usually limited to host plants | Depends on the nutrient and crop |
| Best proof | Spray records, residue test, site pattern | Lab identification of the pathogen | Soil and tissue test |
These are clues, not rules, and two problems can occur together. The University of Missouri points out that a drift event often brings an abrupt change across a planting, and possibly across several crops. It also gives a good warning: tomato leaf roll from high winds can look like herbicide injury. Ohio State adds that diagnosis gets harder when a crop is also short of nutrients or water, or has machinery, pest or disease damage. Its advice is that most growers will need a professional for a final diagnosis.
What causes phytotoxicity?
Field cases often have more than one cause. The main groups are below.
- Wrong product or rate. A product used on a crop not on its label, a rate above the label, or a double dose where boom passes overlap.
- Drift and vapor. Spray droplets or herbicide gas moving onto a crop that was never the target.
- Unsafe tank mixes. Products or adjuvants that injure the crop when combined.
- Hot or slow-drying conditions. Weather that raises the risk of leaf burn, even when the rate is correct.
- Dirty equipment. Traces of an earlier product left in the sprayer.
- Soil and water. Long-lasting herbicide residue, metals such as copper, and salty or boron-rich irrigation water.
Herbicide injury
Herbicides are designed to kill plants, so small errors can matter. Besides drift, watch for residue in soil. Ohio State says dicamba and 2,4-D typically persist in soil for a month or less, while other herbicides can last a year or more. If a new crop struggles evenly across a field that had a residual herbicide last season, check the rotation interval on that product’s label.
Off-target damage can also come from poorly cleaned sprayers, contaminated runoff water, and sometimes contaminated grass clippings or compost, according to Ohio State’s fact sheet on how drift happens. In Nebraska, one photo of a boom end shows how trace amounts of product build up inside spray lines, which is why those authors stress the label’s cleaning steps.
Fungicide, oil and insecticide injury
Crop protection products that do not target plants can still hurt them. Published guides give specific examples:
- Adjuvants: a University of Florida tomato guide notes that adding an adjuvant to Quadris Opti may cause phytotoxicity.
- Strong light: the same guide says Previcur Flex in the greenhouse can cause phytotoxicity if applied in intense sunlight.
- Oil and sulfur: UC IPM’s grape guide says never to mix oil and sulfur or apply one within two weeks of the other.
- Oil in warm areas: UC IPM’s citrus guidance says a lower oil rate reduces the risk, especially in warmer growing areas, and warns of serious hazards from oil on green lemons after sweating.
- Copper and oil: University of Florida citrus guidance warns that mixing copper with oil raises the risk, and that copper can build up in soil and may injure fruit peel.
These examples apply to the crops and products named. Labels change, so check the current label for your own product and crop.
Tank mixes
No company tests every combination. One neem oil label registered with EPA says plainly that not all mixtures of sprays, fertilizers, surfactants and adjuvants have been tested, and that the user is responsible for testing them on a small area first. That label also forbids tank mixing with elemental sulfur products or applying within 14 days of them.
▶ Our video on managing chemical applications and phytotoxicity symptoms in crops · 19:28
Weather and phytotoxicity risk
Weather changes both how much product reaches a crop and how a plant reacts to it. There is no single safe temperature for all products. Take the limits from your label. The neem oil label above, for example, says not to apply under high humidity and temperatures above 90°F, to spray when conditions favor fast drying, and to apply in the early morning or late afternoon to avoid leaf burn.
| Factor | Why it matters | Practical check |
|---|---|---|
| Heat | Can raise burn risk, and a spike in air temperature can turn dicamba or 2,4-D into gas | Read the label’s temperature limit and the forecast |
| Slow drying | Some labels ask for conditions that favor fast drying | Follow the label’s advice on timing |
| Strong light | Some greenhouse products injure plants in intense sun | Check the label; avoid the brightest hours if it says so |
| Wind | Carries droplets to nearby crops | Measure at the field and respect the label’s wind limit |
| Still air | May signal a temperature inversion | Do not assume calm means safe |
| Crop stage | Bud break, flowering and fruit set can be sensitive | Know what stage nearby crops are at |
Why calm air can be the worst time to spray
A temperature inversion occurs when air near the ground is cooler than the air above it. Air does not mix vertically, so fine droplets can stay suspended and then move sideways like fog. Ohio State says inversions commonly form during Midwestern summers, typically in late afternoon or evening, and last until 1 to 2 hours after sunrise. North Dakota State University says inversions are generally stable enough to resist mixing when wind is under 4 to 5 mph, and that significant inversions can still exist at 6 mph or more.
Signs of an inversion include heavy dew or fog, wind under 3 mph, and dust or smoke that forms layers and moves sideways. With a 2 to 3 mph breeze, drift within an inversion could move several miles overnight, according to Ohio State’s FAQ. Ordinary droplet drift has a shorter reach and is generally limited to adjacent fields.
Herbicide drift: how small a dose can do harm
EPA defines spray drift as the movement of pesticide dust or droplets through the air during or soon after application to any site other than the intended area. EPA says herbicide drift can injure crops, can leave a nearby crop unsellable if the pesticide is not registered for it, and that state and local agencies receive thousands of drift complaints each year.
Chart
Dicamba injury on non-tolerant soybean by dose
Visual injury range, %, at the V2 stage, by share of the recommended rate (simulated drift)
Very small doses can cause visible harm. In one study reported by the University of Nebraska, dicamba at 1/10 of the recommended rate caused 70% to 100% injury on V2 soybean without the tolerance trait. Lower doses still caused measurable injury, as the first chart shows. These were simulated drift treatments reported as preliminary results, so they show sensitivity at that stage, not what every field will lose.
Other crops show symptoms at low doses too. Ohio State reports symptoms on grapes at 1/800 of the labeled rate of dicamba or 2,4-D, and on tomato, pepper and watermelon at 1/300. Symptoms are not the same as yield loss, and the studies differ, so treat these as separate signals rather than a strict ranking.
How common was drift damage?
USDA’s Economic Research Service used farmer responses to its 2018 soybean survey and found about 4% of US soybean fields were damaged by off-target dicamba that year. Damage was reported on about 1 in 13 fields in Nebraska and Illinois, the highest shares. Mississippi reported 3%, even though over half of its soybean fields were treated with dicamba, largely because 73% of its soybeans were dicamba-tolerant.
These are 2018 survey figures for one herbicide and one crop. They are not a current national count of all phytotoxicity. Dicamba rules have also changed several times since then. EPA’s page on dicamba-tolerant crops, updated February 2026, limits that approval to the 2026 and 2027 growing seasons, so always check the current federal registration, your state rules and the label before use.
Specialty crops carry a different kind of risk
Fruit and vegetable growers can lose a crop even when plants look fine. Ohio State notes that dicamba has few established residue tolerances on fruit and vegetables, so any detectable residue on most of them can make the crop unsellable. Check the current tolerance list for your crop. Growers interviewed in a 2019 University of Missouri project called herbicide drift a serious barrier to expanding fruit and vegetable production, and some said they lost markets because they could not guarantee produce was clear of drift.
Greenhouses are not fully protected. Drift can enter and become trapped, and running ventilation fans can pull in contaminated air. Herbicides can also arrive in irrigation water, compost and mulch. The same care applies to vertical farming and other indoor systems, where a contaminated water or growing-media source can reach many plants at once.
Chart
Low doses with reported symptoms
Denominator of the labeled-rate fraction, so 800 means 1/800 of the rate; dicamba or 2,4-D; selected crops
What to do in the first 72 hours
Evidence fades fast. Missouri notes that broadleaf herbicides can degrade within several weeks and may become undetectable, and new growth can hide the early injury. Act in this order:
Chart
Soybean fields damaged by off-target dicamba
Share of fields, 2018 farmer survey; Nebraska and Illinois from USDA’s ‘about 1 in 13’; selected states
- Stop and check your own records. List every product, adjuvant, rate, date and sprayer load for that field. Include the product used in the tank before.
- Take dated photos. Use time and GPS stamps. Photograph the worst area, the edge of the damage and a healthy area for comparison.
- Map the pattern. Mark affected areas, field elevation and nearby land uses. Inversion drift tends to settle in low spots.
- Record the weather. Note temperature, wind speed and direction, and fog for the spray event and the days after it. Use a local station if you can.
- Collect samples quickly. Ask a lab about its rules first. Missouri suggests sealing damaged plant samples in a zipper bag and keeping them frozen, as soon as possible.
- Get a diagnosis. Call your extension office, crop consultant or plant clinic to rule out other causes.
- Report suspected drift on time. Deadlines vary. Missouri requires pesticide incidents to be reported within 30 days of the suspected event. Find your own state or provincial rule.
- Leave a control strip. Do not replant or treat the whole area until you have advice. Compare yield from affected and unaffected strips at harvest.
This is general information, not legal advice. Talk to a qualified lawyer about a claim. Ohio State also warns not to rely on crop insurance, since insurers typically do not cover herbicide drift; check your own policy before the season starts. The Missouri article suggests talking openly with neighbors first, since an agreement can cost less than a court case.
How to prevent phytotoxicity: a pre-spray checklist
Good crop protection means protecting the crop from the treatment as well as from the pest. Use this checklist before each spray. Always follow the product label and local rules, which take priority over any general guide.
- Read the current label. Confirm crop, growth stage, rate, adjuvants, wind and temperature limits, buffers and rotation intervals. Ohio State notes that applicators who ignore label instructions can face fines or lose their license.
- Test a small area. Try a new product or mix on a sample of plants first and wait long enough to see a response.
- Check tank mix partners. Read every label in the mix. If compatibility or crop safety is not stated, test first or ask the supplier.
- Check the weather twice. Check the forecast the day before and measure conditions at the field just before you start.
- Look for an inversion. Be careful around sunrise and sunset, and when you see fog, heavy dew or layered smoke.
- Check who is downwind. Use your state’s sensitive crop registry, such as DriftWatch where it runs, and talk to neighbors.
- Calibrate and clean. Calibrate nozzles and clean the whole system, including boom ends, as the label says.
- Limit overlaps. Section control and guidance can reduce double-sprayed strips and boundary overlap.
- Avoid stressed windows. Follow label advice on crops under heat or drought stress.
- Keep records. Save product, batch, rate, water volume, field, time, wind, temperature and operator for each load.
Ohio State’s list of generally prohibited practices included spraying in winds above 15 mph for 2,4-D or 10 mph for dicamba, and buffers of at least 30 feet for 2,4-D and 110 feet for dicamba. These figures date from that fact sheet and apply to the products it covered. They are not universal limits, so use the numbers on your own label.
If you grow the sensitive crop
Register your fields, talk to neighbors about what you grow and what it is worth, and keep yield and cost records for each crop. Ohio State also suggests an accurate farm map, ideally outlined on aerial or satellite images, a weather station with data logging, and scouting several times a week during spray season. Windbreaks may help but are unproven: Missouri says best practices for this use have not been extensively studied.
Is the prevention worth the cost?
Prevention has a real cost: a delayed spray, new nozzles, an unsprayed strip, or extra cleaning time. Compare that with the value of the crop you could injure. The calculator below is for that decision. Enter your own area, yield, price and an honest guess at the yield loss and at the chance of an injury event.
Yield loss is only part of the picture. It leaves out lost grade, residue rejection, replanting, damage to perennial plants, legal costs and lost customers. If those apply, treat the result as a low estimate.
Try the numbers for your own farm below.
Calculator
Is the prevention worth more than it costs?
Enter your own field, price and risk guesses. The price is an example, use today’s price.
- Crop value lost if injury happens (US$): $2,500
- Expected loss at your chance (US$): $250
- Break-even chance of injury: 10.0 %
Example values only, chosen to sit near break-even. They are not a benchmark or a forecast. There are no fixed constants: every number is your input. The result assumes the prevention steps remove the whole risk; if they remove only part, the benefit is smaller. Yield loss excludes lost grade, residue rejection, replanting, damage to perennial plants, legal costs and lost customers.
Phytotoxicity in organic systems
Organic inputs can also injure plants. The neem, oil, sulfur and copper examples above include products used in organic programs, and UC IPM lists sulfur and some oils as acceptable on organically certified grapes (check with your certifier). “Natural” says nothing about crop safety, so the same label and test-strip rules apply.
Drift adds another risk for certified growers. Ohio State says drift residues above acceptable levels can make organic crops unmarketable and may cause certification problems. It suggests keeping evidence of precautions, such as buffers, signs and neighbor agreements, because your certifier may be able to work with you if you have done so. Call your certifier as soon as you suspect drift.

▶ Herbicide injury symptoms in organic and conventional farming · 17:24
Residue limits, records and regulators
Phytotoxicity and residue limits are separate issues, but the same records serve both. EPA sets tolerances, the maximum amount of a pesticide allowed in or on a food, and notes that some countries call these maximum residue limits (MRLs). A crop can look healthy and still exceed a limit, or look badly injured and still be within it.
Your national regulator decides what is legal where you farm. In the US that is EPA with your state agency, in Canada the Pest Management Regulatory Agency, and in Great Britain the Health and Safety Executive. In the EU and in Australia and New Zealand, check the national authority. Good records and Good Agricultural Practices make a complaint or audit much easier to handle.
Can satellites help with phytotoxicity?
Satellite images do not identify a chemical. They show changes in plant vigor, and those changes could come from water stress, pests, disease, nutrition or spray injury. Their use is in telling you where to look. A straight strip, a sharp edge along a boom pass, or a gradient starting from a field boundary is a good reason to walk that area.
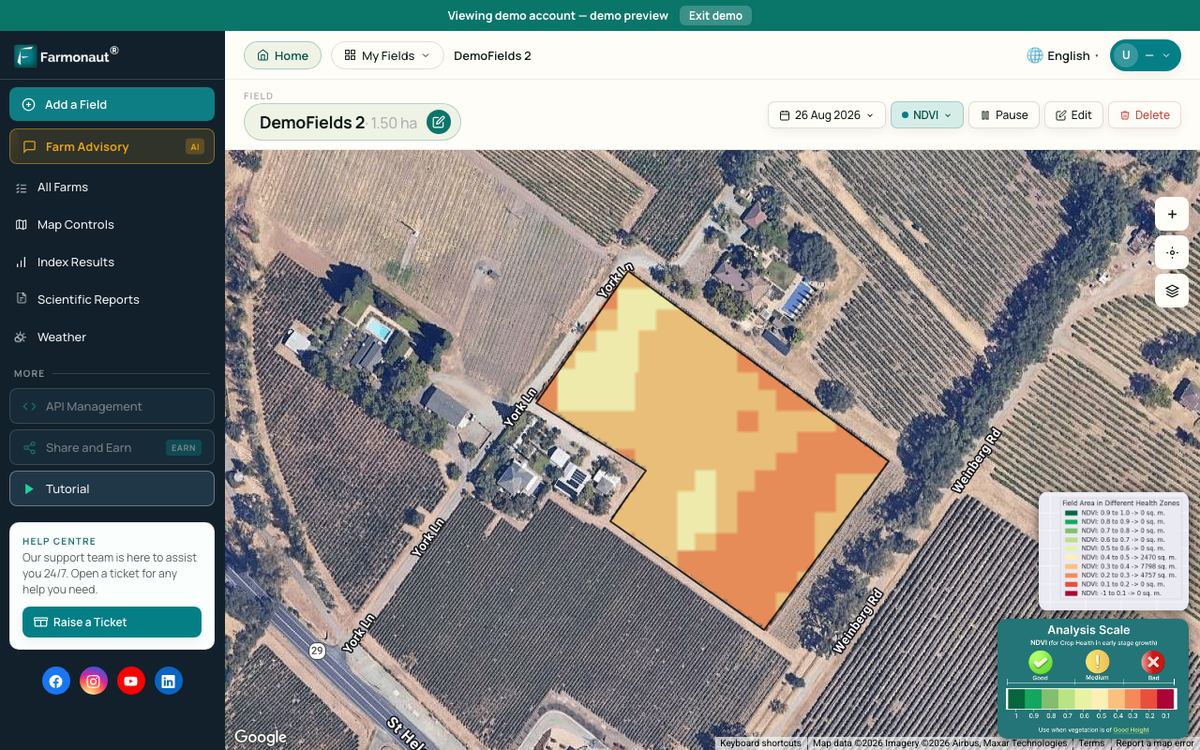
Past images also help with records, because they can show when a change began and how far it reached. Field checks, spray records and lab results are still needed to confirm a cause. Our crop monitoring platform offers this kind of vegetation map for a mapped field. Teams that build their own reports can use the API documentation and developer docs.
Ground equipment addresses the application side. See precision agriculture tools for section control, guidance and variable-rate options, and check that any variable-rate plan stays within the label’s rate.
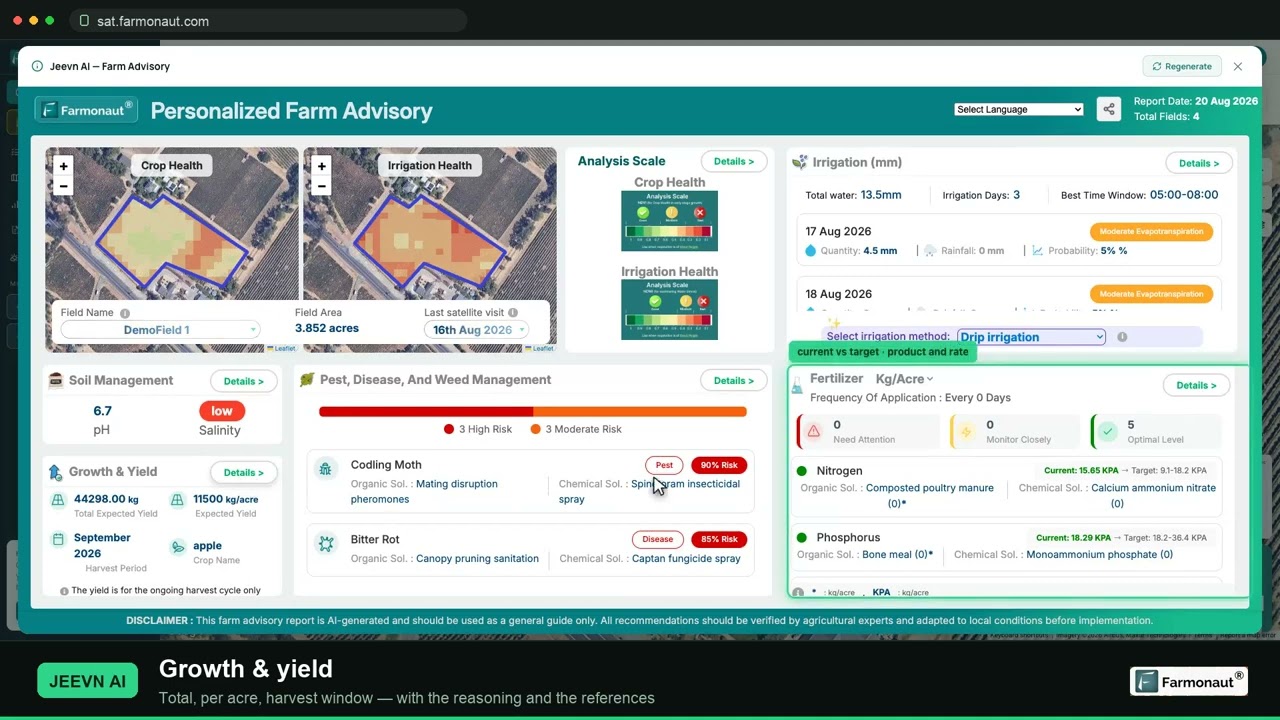
▶ How to read NDVI maps and spot crop stress on your own field · 19:36
FAQ
What does phytotoxicity mean?
It means a substance is harming a plant. The cause may be a pesticide, an adjuvant, a metal, salt or another chemical. Injury can range from a mild leaf spot to the death of the plant.
What is a phytotoxic effect?
It is the visible or measurable harm that follows exposure. Examples are leaf burn, yellowing, cupping, stunting, poor fruit set and damaged roots.
Can plants recover from phytotoxicity?
Sometimes. Early season injury may fade within weeks with no yield loss, but a crop that seems to recover can still show poor fruit at harvest. Severity depends on the crop, its stage, the product and the dose. Compare with an unaffected strip and judge by yield.
How can I tell phytotoxicity from disease?
Check the field pattern and spray dates. Injury that follows spray passes, wind paths or field edges, or that affects several plant species, points toward a chemical. Patches that grow over time point toward disease. A plant clinic or lab can confirm the cause.
Do insecticides cause phytotoxicity?
They can, depending on the formulation, crop, mix and weather. Spray oils used against insects are a well-known example, and UC IPM’s citrus guidance links oil rate and warm conditions to risk. Check the crop safety section on the label and test a small area first.
Can organic products be phytotoxic?
Yes. Copper, sulfur, oils and neem products can injure some crops under the wrong conditions or in the wrong mix. Follow the label and your certifier’s rules.
Related pages on our site: phytotoxicity tips for crops and sprayer and farm tool upkeep.
Farmonaut crop monitoring
See where to walk your fields
Draw your fields once and Farmonaut shows satellite vegetation maps for them through the season, on web, Android or iOS.



Keep reading

Sources
- Ohio State University IPM, Dicamba and 2,4-D fact sheet series: ipm-drift.cfaes.ohio-state.edu
- Ohio State University IPM, Frequently asked questions on herbicide drift: ipm-drift.cfaes.ohio-state.edu
- Ohio State University IPM, How dicamba and 2,4-D drift damages plants: ipm-drift.cfaes.ohio-state.edu
- Ohio State University IPM, How drift happens: ipm-drift.cfaes.ohio-state.edu
- Ohio State University IPM, Preparing for drift damage: ipm-drift.cfaes.ohio-state.edu
- University of Nebraska-Lincoln CropWatch, Dicamba injury symptoms on sensitive crops (2017): cropwatch.unl.edu
- University of Missouri IPM, Herbicide drift and specialty crops (2023): ipm.missouri.edu
- USDA Economic Research Service, Amber Waves, dicamba-tolerant soybean seeds (October 2019): ers.usda.gov
- North Dakota State University Extension, Air temperature inversions and pesticide spray drift: ag.ndsu.edu
- US EPA, Introduction to pesticide drift: epa.gov
- US EPA, Pesticide tolerances: epa.gov
- FAO, Wastewater treatment and use in agriculture, Irrigation and Drainage Paper 47: fao.org
- US EPA, The use of soil amendments for remediation, revitalization and reuse (2007): clu-in.org
- UC IPM, Citrus: identifying diseases and disorders of leaves and twigs: ipm.ucanr.edu
- UC IPM, Grape powdery mildew guidelines: ipm.ucanr.edu
- UC IPM, Citrus black scale guidelines: ipm.ucanr.edu
- University of Florida IFAS, Chapter 18: Tomato production (HS739): edis.ifas.ufl.edu
- University of Florida IFAS, Florida Citrus Production Guide: Citrus Canker (PP-182): edis.ifas.ufl.edu
- US EPA pesticide label database, Neem Oil Concentrate 70 label (88760-15): www3.epa.gov
Discussion
Questions, corrections or field experience? Share them below. First-time comments are reviewed before they appear, and your email is never published.
No comments yet. Be the first to add a question or your experience.

 Tucor
 Saraswati Agro
 Geno
 Hayleys Agriculture
 Linx Agritech
 Adinet
 Save Your Soils
 Grandstream Algérie
 XOS Realty
 Geospatial Lab Africa
 Agro La Gándara
 HIPSAC
 ZOL Zimbabwe
 Juligerm
 MISE Maroc
 NWNS

 Licence holder · Niger · Gold










