

Field sensors · Buyer guide
Agriculture Field Monitoring System: Sensors and Costs
A field monitoring system pairs a weather station and soil moisture probes with a data link and an app that sends alerts. Pennsylvania NRCS payment rates for fiscal year 2026 run from $848 to $2,546 per soil moisture sensor unit, and 22% of US farms used some precision practice in 2025 (USDA NASS).
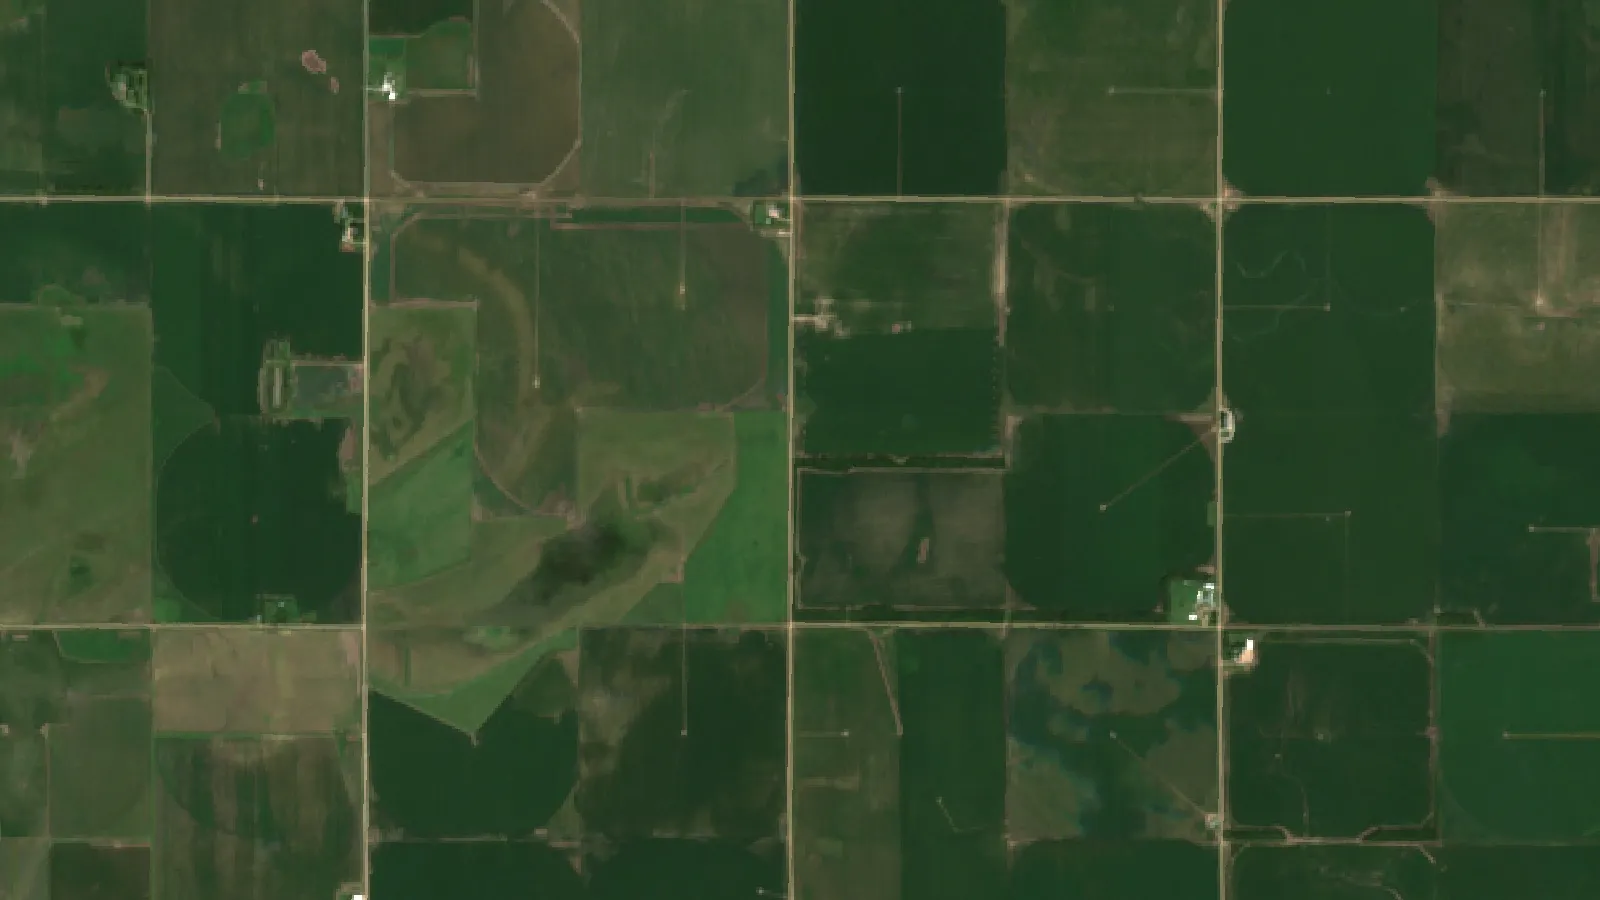
Key takeaways
- A working system has four parts: sensors, a logger, a data link (cellular, LoRa, Wi-Fi or satellite) and software that sends alerts.
- 22% of US farms used a precision agriculture practice in 2025, down from 27% in 2023 (USDA NASS, August 2025); the survey does not count sensor use on its own.
- Pennsylvania NRCS EQIP payment rates for fiscal year 2026: $848.19 per site for soil moisture sensors, $2,546.27 with data loggers and telemetry.
- 74% of US farms with internet used a cellular plan in 2025 and 24% used satellite (USDA NASS), so check signal at each sensor site.
- Start with one probe site per management zone, at two or more root-zone depths, and review after one season.
In this article
- What an agriculture field monitoring system does
- How many farms use monitoring technology
- What a farm weather station measures
- Soil moisture sensors and how many you need
- Connectivity: how sensor data leaves the field
- Agriculture field monitoring system costs
- How to set up a field monitoring system
- Row crops vs orchards and vineyards
- Public data that adds to your own sensors
- Is a sensor network worth it on your field?
- How we checked the numbers
- FAQ
An agriculture field monitoring system is a set of ground sensors, a weather station, a data link and an app that tell you what is happening in one field right now. It measures soil water, air temperature, humidity, rain, wind and leaf wetness at fixed points, then sends alerts when a reading crosses a limit you set. This guide covers what to measure, how many probes you need, how the data gets off the field, and what a setup costs, using dated public numbers.
The focus here is on ground hardware: weather stations and in-field IoT sensors. Drones and satellites come up only where they work alongside the ground network. A calculator near the end lets you test whether a sensor network pays for itself on your own field.
What an agriculture field monitoring system does
A field monitoring system turns raw conditions into decisions. A probe reads soil water at 30 cm. A station logs 2 mm of rain and 11 hours of wet leaves. The software compares those readings with limits and sends a text: irrigate block 4, frost risk tonight, wind too strong to spray. The value is not the sensor itself. It is the alert that arrives in time to act.
Every working setup has four parts:
- Sensors that measure one thing at one spot, such as soil water, temperature or rainfall.
- A logger or node that stores readings and powers the sensors, usually from a small solar panel and battery.
- A data link that moves readings off the field: cellular, LoRa radio, Wi-Fi near the yard, or satellite.
- Software on a phone or computer that shows graphs, runs models and sends alerts.
If one part is missing, the system still collects data, but someone has to walk out and read it. A common reason a sensor purchase ends up unused is that the readings never reach a screen the farmer checks each day.
Ground sensors give exact readings at a point. They do not show what is happening 300 metres away in a sandy patch or a low spot. That is why many growers pair a small ground network with a wider view, such as satellite crop maps, and use the ground data to check what the maps suggest. Our older piece on an IoT based agriculture monitoring system walks through the same layers from a hardware angle.
How many farms use monitoring technology
USDA’s farm technology survey does not count farms with a weather station or soil probe as its own line. The closest measure comes from USDA’s farm technology survey, which asks if a farm used any precision agriculture practice in the past 12 months. In the USDA NASS Technology Use report of August 2025, 22% of US farms said yes in 2025, down from 27% in 2023. The survey question lists GPS guidance, yield mapping, variable rate, drones, electronic tags and robotic milking. It does not name soil or weather sensors, so treat these as a broad signal, not a sensor count.
Chart
Farms using precision agriculture practices
Percent of farms, selected states and US total
Adoption varies a lot by state. Grain states with large fields report the highest shares. States with many small or livestock farms report lower shares. The chart shows selected states from the same report.
Crop-level data tells a similar story. The USDA Economic Research Service report The Adoption of Digital Agriculture Technologies (EIB-248) found auto-steer and guidance on 58% of planted corn acres in 2016, up from 5.3% in 2001. The same report estimated guidance use at 72.9% for sorghum and 64.5% for cotton in 2019. In contrast, yield maps, soil maps and variable rate tools were used on only 5% to 25% of planted acres of winter wheat, cotton, sorghum and rice, as the ERS summary page notes.
The takeaway: steering tools are common on large row-crop farms, while field sensing still sits with a minority of growers. A grower who adds soil and weather sensing is not late. The tools are mature, but the habit of using sensor data to make daily calls is still spreading.
What a farm weather station measures
A farm weather station is a mast with several sensors and a logger. A basic unit measures air temperature, relative humidity, rainfall, wind speed and wind direction. Better units add solar radiation, leaf wetness and soil temperature. Each reading supports a different decision.
- Air temperature: frost alerts, growing degree days for crop stages and insect timing.
- Relative humidity and leaf wetness: disease models for fungal diseases that need wet leaves at certain temperatures.
- Rainfall: measured at the field, not at the nearest airport, which can be far away and miss summer storms.
- Wind speed and direction: spray timing to limit drift, and wind damage risk on tall crops.
- Solar radiation: one of the inputs for crop water use.
Rainfall alone is a poor guide to irrigation. Crops lose water through their leaves and the soil surface, and that loss depends on sun, heat, wind and humidity. Agronomists call it evapotranspiration, or ET. The FAO Irrigation and Drainage Paper 56 sets out the standard method: compute a reference ET from weather data, then multiply it by a crop coefficient for the crop and growth stage. A station with temperature, humidity, wind and solar radiation sensors gives you what you need for that reference figure.
For tips on choosing hardware feature by feature, see our guide to choosing a farm weather station. For how station data feeds forecasts, see this overview of weather forecasting types in agriculture.
Disease models that run on station data
Leaf wetness and temperature drive many plant disease models. The UConn IPM program describes how the TOM-CAST model for tomato early blight adds up disease severity values from hours of leaf wetness at given temperatures. In UConn’s write-up of forecasting models, growers spray first when 25 severity values have built up since transplanting, then at set intervals after that, with the interval depending on the product. The same article notes that Connecticut set up 41 weather stations at farms and schools, linked to Cornell’s NEWA network, so growers could use nearby station data without owning a mast.
Two lessons follow. First, a model is only as good as the station it reads, so a station close to the crop matters. Second, you may not need your own station if a public network already has one nearby. Any fungicide decision still has to follow the product label and local rules, and models support scouting rather than replace it.
Soil moisture sensors and how many you need
Soil moisture probes are the core of most irrigation-focused systems. They come in a few broad types:
- Tensiometers and matric sensors read how hard roots must pull to get water. They suit irrigation timing on many soils.
- Capacitance and TDR probes estimate the water share of the soil by volume. Multi-depth versions read several layers from one tube.
- Neutron probes are accurate and used in research, but need a licence and a trained operator, so few farms run them.
Place probes where they represent a real management zone: the main soil type under one pivot or one irrigation block. Put at least two depths in the root zone, for example one shallow and one deeper, so you can see if water is reaching the roots or draining past them. Avoid wheel tracks, field edges and low spots unless that spot is what you want to watch.
How many sites? One site per uniform irrigation zone is a common starting point. A pivot on one soil type may need one site. A field with sand on a ridge and clay in a swale needs at least two, because the two soils dry at very different rates. Satellite maps or yield maps from past seasons help you see where those zones are before you buy hardware.
Probes also help you check a model. In a two-year variable rate irrigation study in West-Central Nebraska, researchers ran irrigation on a satellite-based ET model and compared it with plots scheduled from neutron probe readings. In 2018, the model-led plots got 265 mm of planned irrigation against 282 mm for the probe-led plots under full irrigation, with no significant yield difference in either year. The authors called the model promising but said it needed more testing. That is a fair summary of the field: models and maps narrow the search, and ground readings keep them honest.
Connectivity: how sensor data leaves the field
A sensor that cannot send its data is a data logger you have to visit. The link you choose depends on coverage, distance and how often you need readings.
| Link | Typical range | Good for | Watch out for |
|---|---|---|---|
| Cellular | Wherever a carrier has signal | Single stations, few sites | Monthly data plan per device; weak signal in valleys |
| LoRa radio | Several km to a gateway, line of sight helps | Many low-power probes on one farm | Needs a gateway with its own internet link |
| Wi-Fi | Near the farmyard | Greenhouses, yards, sheds | Short range in open fields |
| Satellite IoT | Almost anywhere | Remote paddocks and rangeland | Higher cost per message; small data packets |
Farm internet access shapes these choices. The same USDA NASS report found that 85% of US farms had internet access in 2025. Of farms with internet, 74% used a cellular data plan, 55% used broadband such as DSL, cable or fibre, and 24% used satellite. Farms can use more than one method, so the shares add up to more than 100%.
A practical rule: check the signal at the spot where each sensor will stand, not at the house. A phone with signal bars at the yard tells you little about a pivot corner two miles away behind a ridge. If cellular is weak, one LoRa gateway on a tall building or grain bin can often reach probes across a whole farm.
Chart
How US farms reach the internet
Percent of farms with internet access, by method, 2025 (more than one method allowed)
Agriculture field monitoring system costs
Hardware prices vary widely by brand, number of depths and data plan, and vendors change list prices often. Public payment rates give a neutral reference point. USDA’s Natural Resources Conservation Service pays farmers set rates for conservation practices under EQIP. The Pennsylvania NRCS cost list for fiscal year 2026 sets these base payments per site under Irrigation Water Management (practice 449):
- Soil moisture sensors: $848.19 per site.
- Sensors with data loggers: $2,236.54 per site.
- Sensors with data loggers and telemetry: $2,546.27 per site.
Each also has a per-acre implementation rate of $5.27 to $6.74. Rates for historically underserved producers are higher. These are payment rates for one state and one year, not shop prices, and they are meant to cover part of a typical cost. Still, they show the jump in cost when you add logging and remote data transfer. Rates differ by state, so check your own state’s list, and talk to your local NRCS office about eligibility.
Running costs matter as much as the upfront price. Plan for data plans or platform fees per site, battery and sensor replacement, removal and reinstall around tillage or harvest, and your own time to check the readings. A probe that sits in the field without anyone looking at the data costs money and saves nothing.
Where the payback comes from
The return on a sensor network usually comes from a few places: fewer irrigation passes, lower pumping energy, less nitrogen washed past the roots, fewer frost or disease losses, and less driving around to check fields. The size of each varies by crop, soil, water price and how well you already manage. That is why the calculator below uses your numbers rather than a national average.
Chart
NRCS payment per soil moisture sensor site
US dollars per site, base rate, Irrigation Water Management (449), Pennsylvania, fiscal year 2026
How to set up a field monitoring system
A simple order of work keeps the project small and useful:
- Pick one decision. Irrigation timing, frost protection or spray timing. Buy for that decision first.
- Map your zones. Use soil maps, yield maps or satellite crop maps to find areas that behave differently.
- Choose sites and depths. One site per zone to start, with probes at two or more depths in the root zone.
- Test the data link. Check signal at each site, or plan a LoRa gateway.
- Set alert limits. For example, a soil water trigger for irrigation or a temperature trigger for frost.
- Review after one season. Compare alerts with what you saw in the field, then add or move sites.
Start small. One weather station and two or three probe sites on your most valuable or most variable field will teach you more than a large network nobody checks.

▶ Six plain steps to start precision agriculture on a farm without buying a robot. · 4:18
Row crops vs orchards and vineyards
The hardware is the same. What changes is where you place it and which alerts matter most.
- Perennial crops stay in place. Probes and stations can stay put for years, so each season builds on the last. In row crops, sensors often come out before tillage and harvest.
- Frost matters more in orchards and vines. A spring frost can cost a whole crop of fruit. Temperature sensors at canopy height, not just at the mast, give earlier warning for fans or sprinklers.
- Cold air pools in low spots. Place a temperature sensor in the lowest part of the block as well as the highest.
- Disease models run on canopy data. Leaf wetness sensors should sit in the canopy where the disease starts.
Row crops on large, even fields may need fewer sites per acre. Mixed soils, terraces or hillside blocks need more.
Public data that adds to your own sensors
You do not have to collect every reading yourself. Public networks add context for free or at low cost:
▶ How satellite NDVI maps show crop stress across a whole farm, a useful companion to ground sensors. · 4:09
- National weather services give forecasts and nearby station history, useful for checking your own station.
- State and regional agweather networks, such as the Cornell NEWA network mentioned above, run pest and disease models on their station data.
- The USGS National Water Dashboard shows streamflow, groundwater and other water data across the US. It tells you what is happening in the watershed, not in your field.
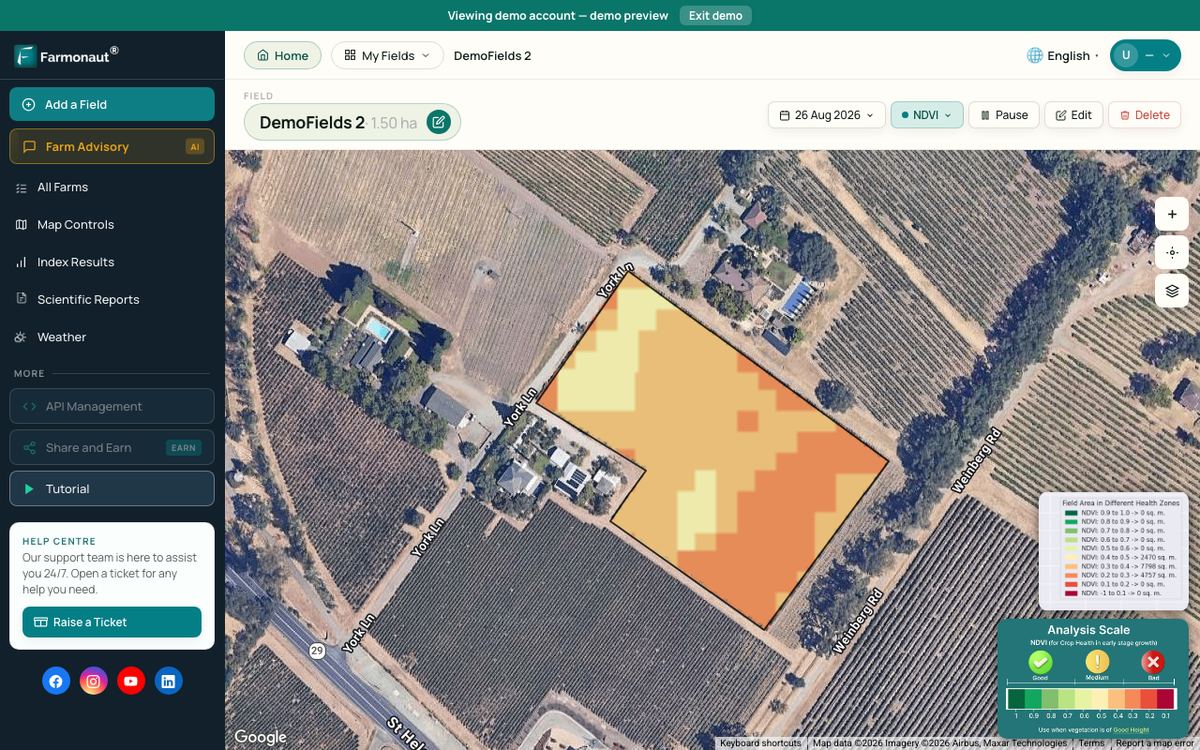
- Satellite crop maps show differences in plant vigour across whole fields every few days when skies are clear, which helps place probes and spot problems between them.
Farmonaut’s Satellite + AI Farm Monitoring System works in this last layer. It shows satellite vegetation and moisture maps for fields you draw in an app, with no hardware to install, and can sit alongside a ground sensor network.
Related pages on our site: multi-field admin dashboard, fleet management, crop loan and insurance verification, product traceability, carbon footprinting, API developer docs, satellite and weather API and web and mobile apps.
Is a sensor network worth it on your field?
The calculator compares the yearly cost of a sensor network with the value of water you might save. Enter your own field size, number of sites, hardware cost, yearly fees, and your cost to pump one acre-inch of water. The default values are round examples set near break-even, not benchmarks. Water saved varies widely, so try a low and a high figure. The result leaves out yield effects, nitrogen savings and labour, which can push it either way.
Try the numbers for your own farm below.
Calculator
Does a soil sensor network pay for itself?
Enter your own field, sensor and water cost numbers.
- Yearly network cost: $1,600
- Yearly value of water saved: $1,600
- Water saving needed to break even: 1.00 in/acre
Example values only, set near break-even; not a benchmark or a forecast. Every number is your input. Hardware is spread evenly over its life with no interest. Water savings vary widely by crop, soil and current practice; the result leaves out yield, nitrogen and labour effects. For a public cost reference see the NRCS Pennsylvania FY26 cost list (payment rates, 2026).
How we checked the numbers
Every figure on this page comes from a public source with a date. Adoption and internet figures come from the USDA NASS Technology Use report of August 2025 and the USDA ERS report EIB-248. Cost references are NRCS EQIP payment rates for Pennsylvania in fiscal year 2026, which are payment rates, not retail prices. The ET method is from FAO Paper 56, the disease model details are from UConn IPM, and the irrigation comparison is from a peer-reviewed Nebraska field study. USDA lists release dates for its surveys in the NASS Guide to Surveys, and newer figures appear on the NASS data and statistics page. Check those before you rely on any adoption share here.
We left out claims we could not trace to a source, such as general yield gains from sensors. Results depend on the crop, soil, water price and how the data is used.
FAQ
What is an agriculture field monitoring system?
It is a set of in-field sensors, a weather station, a data link and software that track soil water, weather and crop conditions on one farm. It sends alerts when readings cross limits you set, such as a soil water trigger for irrigation or a frost warning.
How many soil moisture probes do I need per field?
Start with one site per zone that you manage differently, such as each soil type under a pivot. Place probes at two or more depths in the root zone. Add sites after one season if readings do not match what you see in the crop.
Do I need my own weather station?
Not always. If a public or regional network has a station close to your field, its data may be enough for disease models and ET. Your own station helps when the nearest one is far away, on different terrain, or misses local storms.
What does a soil sensor setup cost?
It depends on brand, depths and data plan. As a neutral reference, Pennsylvania NRCS EQIP payment rates for fiscal year 2026 are $848.19 per site for sensors alone and $2,546.27 per site for sensors with data loggers and telemetry. These are payment rates, not shop prices, so get quotes for your own field.
Can satellites replace ground sensors?
No, they do different jobs. Satellite maps show differences across whole fields but cannot read soil water at a set depth. Ground probes give exact readings at a point but miss what lies between them. Many growers use both, with maps to place probes and probes to check the maps.
Farmonaut crop monitoring
See your own fields from space
Draw your fields once and Farmonaut shows satellite vegetation maps for them through the season, on web, Android or iOS.



Sources
- USDA NASS, Technology Use (Farm Computer Usage and Ownership), August 2025: esmis.nal.usda.gov
- USDA ERS, The Adoption of Digital Agriculture Technologies, EIB-248 (2023): ers.usda.gov
- USDA ERS, precision agriculture adoption summary page: ers.usda.gov
- USDA NRCS Pennsylvania, FY26 EQIP and CSP published cost list (2026): nrcs-prod.azureedge.us
- FAO, Irrigation and Drainage Paper 56, Chapter 6: single crop coefficient (1998): fao.org
- UConn IPM, Using forecasting models to time tomato fungicides (2014): ipm.cahnr.uconn.edu
- Frontiers in Big Data / PMC, Variable rate irrigation of maize and soybean in West-Central Nebraska (2021): ncbi.nlm.nih.gov
- USGS, National Water Dashboard: dashboard.waterdata.usgs.gov
- USDA NASS, Guide to NASS Surveys: nass.usda.gov
- USDA NASS, Data and Statistics: nass.usda.gov
- farmdoc daily (University of Illinois), Precision agriculture and farm service technician demand (2026): farmdocdaily.illinois.edu
Discussion
Questions, corrections or field experience? Share them below. First-time comments are reviewed before they appear, and your email is never published.
No comments yet. Be the first to add a question or your experience.

 TVS Electronics
 BW Pipelines
 WICO
WICO Gen Chayat
 Chimera Innovation
 Hiteshi Infotech
 SkyHarvest
 Polaris Digitech
 Teledarbas
 Wild Oak Farm
 SFX
SFX BACF Africa
 Doodlakine
 Exurbia Geospatial
 FieldZero
 Indico Company
 Licence holder · Niger · Gold










